7565 Mercier St · New Orleans, LA
Flood risk No data
- FEMA flood zone
- —
- Chance of flooding over 30 yrs
- —
- Est. flood insurance / yr
- —
Fire risk No data
- Est. fire insurance / yr
- —
Heat risk No data
- Hot days now (above threshold)
- —
- Hot days in 30 yrs
- —
Wind risk No data
- Chance of severe wind over 30 yrs
- —
Air-quality risk No data
- Unhealthy air days now
- —
- Unhealthy air days in 30 yrs
- —
Risk factors via First Street. Map © Google.
Why this score? — see what drove the B- grade
The composite is a weighted blend of 9 inputs, each scored 0–100. Each bar is that input's sub-score; the figure is the points it added to the 100-point composite (weight × sub-score).
- Cash flow +30.0/30.0
- 1% rule +10.0/10.0
- DSCR +10.0/10.0
- ARV discount +7.5/15.0
- Livability +4.0/5.0
- Rent growth +2.5/5.0
- Condition / age +2.5/5.0
- Schools +1.6/10.0
- Appreciation +0.0/10.0
$75,000
🖨 Deal sheet 📄 Offer letter ✓ Due diligence
Listing remarks MLS
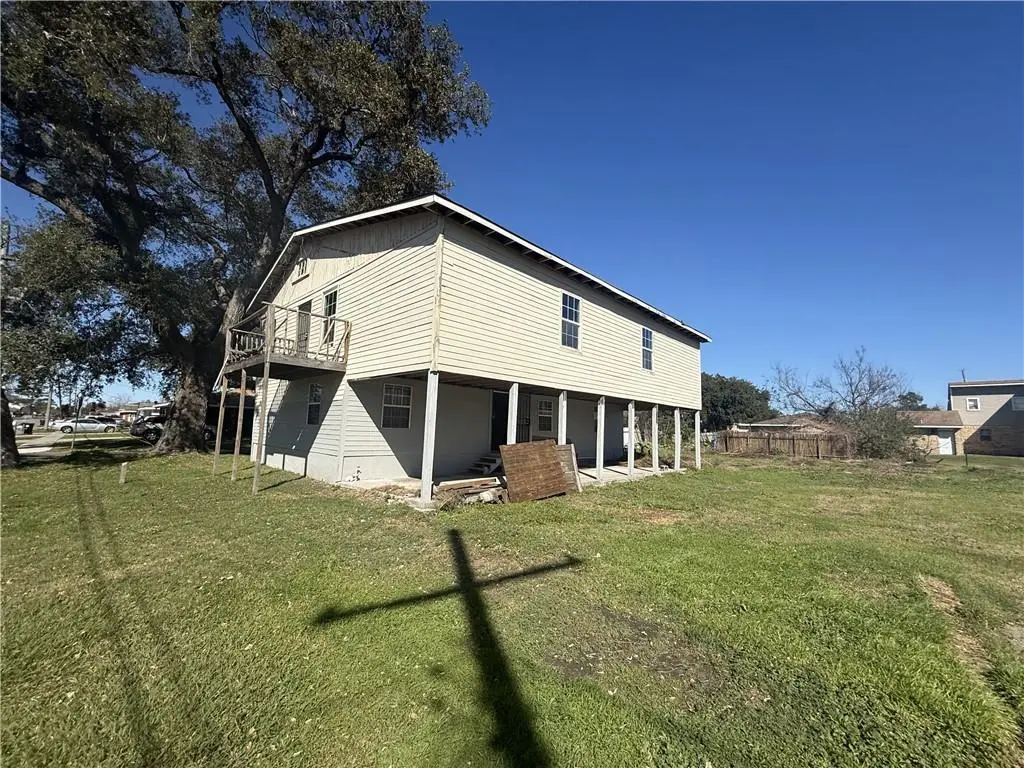
Investor opportunity. Two-story corner property with recent updates including a new roof, new windows, and updated interior plumbing. Property is being sold AS IS. Seller is motivated. All measurements and information are deemed reliable but not guaranteed. Buyer to verify. Seller is selling Lots 26-27 only with the existing house (approx. 50 x 120).
Key facts
- New roof
- New windows
- Parking
Tags
Neighborhood map
What this means for you Summary
Snapshot
- This is a 4-bed/2.0-bath other listed at $75k.
Deal economics
- At list price, monthly cash flow is $894 ($11k/yr) — positive.
- The deal already cash-flows at list — no discount required.
- Meets the 1% rule at list price ($2k rent vs $75k).
- Recommended offer: $66k (12.0% below list) — sets the bar for market timing.
- Cap rate 20.6% vs local median 4.4% in New Orleans — top-decile yield for the area; either an underpriced asset or a hidden risk that comps aren't pricing in. Stress-test before assuming the spread holds.
Location & tenants
- Location reads 81/100 on livability (#3 in LA, #1,383 nationally) — a professional / high-income tenant draw. Strengths: amenities A+, commute A+, health & safety A+; Watch: crime C-, employment D.
- Orleans Parish (urban): math 11% / reading 27% proficiency, ranked #69 of 98 in LA (top 70%) — low school quality limits family demand, transient renter base, plan for 1-2y turnover; 68% free/reduced lunch — lower-income household profile, screen leases tightly.
- Market conditions: 105 active listings in the ZIP; 8 comparable units currently listed for rent nearby; rentals at typical pace (median 24d on market — plan ~3-4 weeks tenant-placement turnaround); 710 units permitted in Orleans Parish in 2024 (244 in 5+ unit buildings).
Forward outlook
- Local home prices are declining (-3.0%/yr); year-one equity from $519 of loan paydown is wiped out by about $2k of value loss. Plan a longer hold.
- Orleans County population projected at +61% by 2050 — long-run rental-demand tailwind backs the buy-and-hold thesis.
- At projected returns (-3.0% appreciation + 3.0% rent growth), your $21k cash investment doubles in ~3 years — after that, you're playing with house money.
Negotiation context
- It's been on market 133 days — a 12% lower offer ($66k) is reasonable based on typical stale-listing flexibility.
- 3 sale attempts since 4y ago; this cycle's ask has dropped $10k (12%) from the opening price — seller is motivated, your offer sets the floor, not the list.
- Current owner paid $63k; 19% above their basis — modest negotiation headroom, anchor on the comps not their cost.
Questions for the listing agent
- It's been on market 133 days. Have you received any prior offers? Is the seller open to a 12% concession, seller financing, or rate buy-down credit?
- Why hasn't it sold? Are there any deal-killer items the seller is aware of (foundation, flood, title, zoning, code violations)?
- Is there a deadline driving the sale (1031 exchange, divorce, estate, relocation)? That informs how much negotiation room exists.
- What's the average days-on-market for RENTAL listings here right now (not sales)? A rising rental-DOM trend means longer vacancies and softer asking-rent achievability than the comps imply.
- What's the recent tenant-quality profile in this submarket — average credit score on applications, eviction rate, late-payment / NSF rate, and stable-employment percentage? A property-management company in the area should have these aggregated.
- How much new for-sale + rental construction is in the pipeline within 1–3 miles? Heavy new supply typically softens prices + rents 12–24 months out; constrained supply supports both.
Investment metrics
- 1% rule
- 2.41% ✓
- Cap rate
- 20.60%
- Cash-on-cash
- 51.08%
- DSCR
- 3.27
- GRM
- 3.5
CMA / ARV
- ARV (median comp)
- $265,692
- List price
- $75,000
- Delta
- -71.77%
- Verdict
- UNDERPRICED
- Comps
- 20 within 1.0 mi
Projected returns pro-forma
-3.0% appreciation · 3.0% rent growth · sell at horizon
- IRR
- 48.9%
- Equity multiple
- 3.13×
- Total profit
- $44,820
- Equity at exit
- $11,183
- IRR
- 54.5%
- Equity multiple
- 6.36×
- Total profit
- $112,497
- Equity at exit
- $6,485
Cash invested: $21,000 (down + closing). Projections, not guarantees.
Landlord ↔ Tenant lean methodology
- Overall (STATE)
- 90 Strongly Landlord-Friendly
- State Louisiana
- 90 Strongly Landlord-Friendly · R+12
- County
- — inherits STATE
- City
- — inherits STATE
ZIP-level market 70128
- Home prices YoY
- -5.9%
- Active inventory
- 105
- Price-to-rent
- 3.5×
Monthly cashflow live
- Estimated rent
- $1,810 high interval (Pro) →
- Mortgage (P&I)
- −$393
- Tax from tax record
- −$111 /mo · $1,332/yr
- Insurance
- −$31
- HOA
- −$0
- Vacancy / Maint / Mgmt
- −$380
- Net cashflow
- $894
Break-even live
UW: 25.0% down · 7.5% · 30yr · 1.5% tax · 5.0% vac · 8.0% maint · 8.0% mgmt
Financing live
Cash to close
- Down payment
- $18,750
- Closing costs
- $2,250
- Reserves months
- —
- Total cash needed
- —
Loan-product check · same deal, 3 products live
Conventional
25% down · 7.5% · 30yr
- Down + closing
- —
- Monthly P&I
- —
- Monthly cashflow
- —
- DSCR
- —
- Eligible?
- —
Personal DTI + credit; lowest rate.
DSCR
20% down · 8.5% · 30yr
- Down + closing
- —
- Monthly P&I
- —
- Monthly cashflow
- —
- DSCR
- —
- Eligible?
- —
No personal income docs; deal must DSCR.
Hard money
10% down · 12.0% · 12mo
- Down + closing
- —
- Monthly P&I
- —
- Monthly cashflow
- —
- DSCR
- —
- Eligible?
- —
Short-term bridge; refi at stabilization.
Rent comps 8 comps
| Address | Beds | Baths | Sqft | Rent | $/sqft | DOM | Units | Dist |
|---|---|---|---|---|---|---|---|---|
| 10951 Roger Dr Unit B New Orleans, LA | 3.0 | 2.5 | 2048 | $1,850 | $0.90 | 23d | 1 | 0.52mi |
| 5754 Louis Prima Dr E New Orleans, LA | 3.0 | 2.5 | 2069 | $2,195 | $1.06 | 23d | 1 | 1.08mi |
| 7201 Salem Dr New Orleans, LA | 3.0 | 2.5 | 1764 | $1,650 | $0.94 | 23d | 1 | 1.36mi |
| 8936 Curran Blvd New Orleans, LA | 3.0 | 2.0 | 2050 | $1,575 | $0.77 | 21d | 1 | 1.37mi |
| 7202 Salem Dr New Orleans, LA | 3.0 | 2.5 | 1995 | $1,750 | $0.88 | 23d | 1 | 1.39mi |
| 6972 Bundy Rd New Orleans, LA | 3.0 | 2.5 | 2048 | $1,500 | $0.73 | 23d | 1 | 1.40mi |
| 6951 Salem Dr New Orleans, LA | 3.0 | 2.5 | 1900 | $1,875 | $0.99 | 23d | 1 | 1.43mi |
| 7063 Boston Dr New Orleans, LA | 4.0 | 2.5 | 1750 | $1,900 | $1.09 | 16d | 1 | 1.46mi |
Listing history 20 events
-
2026-06-18days on market $75,000 Active 133 DOM
-
2026-06-17days on market $75,000 Active 132 DOM
-
2026-06-16days on market $75,000 Active 131 DOM
-
2026-06-15days on market $75,000 Active 130 DOM
-
2026-06-13days on market $75,000 Active 128 DOM
-
2026-06-10days on market $75,000 Active 125 DOM
-
2026-06-09days on market $75,000 Active 124 DOM
-
2026-06-08days on market $75,000 Active 123 DOM
-
2026-06-07days on market $75,000 Active 122 DOM
-
2026-06-05days on market $75,000 Active 119 DOM
-
2026-06-03days on market $75,000 Active 118 DOM
-
2026-06-02days on market $75,000 Active 117 DOM
-
2026-06-01days on market $75,000 Active 116 DOM
-
2026-05-31days on market $75,000 Active 115 DOM
-
2026-05-14price $75,000 352-char remark
Show marketing remark (358 chars)
Investor opportunity. Two-story corner property with recent updates including a new roof, new windows, and updated interior plumbing. Property is being sold AS IS. Seller is motivated. All measurements and information are deemed reliable but not guaranteed. Buyer to verify. Seller is selling Lots 26–27 only with the existing house (approx. 50 x 120).
-
2026-05-14price $75,000 358-char remark
Show marketing remark (358 chars)
Investor opportunity. Two-story corner property with recent updates including a new roof, new windows, and updated interior plumbing. Property is being sold AS IS. Seller is motivated. All measurements and information are deemed reliable but not guaranteed. Buyer to verify. Seller is selling Lots 26–27 only with the existing house (approx. 50 x 120).
-
2026-01-20$85,000 Active 352-char remark
Show marketing remark (358 chars)
Investor opportunity. Two-story corner property with recent updates including a new roof, new windows, and updated interior plumbing. Property is being sold AS IS. Seller is motivated. All measurements and information are deemed reliable but not guaranteed. Buyer to verify. Seller is selling Lots 26–27 only with the existing house (approx. 50 x 120).
-
2026-01-20$85,000 Active 358-char remark
Show marketing remark (358 chars)
Investor opportunity. Two-story corner property with recent updates including a new roof, new windows, and updated interior plumbing. Property is being sold AS IS. Seller is motivated. All measurements and information are deemed reliable but not guaranteed. Buyer to verify. Seller is selling Lots 26–27 only with the existing house (approx. 50 x 120).
-
2022-10-13$79,000
-
1998-08-28soldstatus $63,000
ⓘ Source: listings_history table (triggers on properties + properties_extension) + one-shot
backfill from property_details.listing_events for pre-trigger history.
Tax reassessment forecast LA · Resets to sale price
- Current annual tax
- $1,332 · $111/mo
- Projected year-2 tax
- $1,332 · $111/mo
- Expected delta
- $0/yr ($0/mo · 0.0%)
ⓘ Screening estimate from a state-policy table — verify with the county assessor before closing.
Nearby sold comps map
Loading sold comps map…
Walkable amenities ~0.75 mi
Loading nearby amenities…
Taxation est. · year 1
- Rental income
- $21,714
- − Mortgage interest
- −$4,201
- − Property taxes
- −$1,332
- − Insurance
- −$375
- − Repairs & maintenance
- −$1,737
- − Management
- −$1,737
- − Depreciation
- −$2,182
- Taxable income
- $10,150
- Est. tax owed @ 24.0%
- −$2,436
- After-tax cash flow
- $8,291/yr
For passive investors: Depreciation is non-cash, so a rental often shows a tax loss while cash-flowing — sheltering income. Rental losses are passive: they offset passive income freely, and up to $25,000/yr can offset ordinary (W-2) income if you actively participate and your MAGI is under $100k (phasing out to $0 by $150k); unused losses carry forward. On sale, claimed depreciation is recaptured at up to 25%, and gains may owe capital-gains tax (a 1031 exchange can defer both). Figures are a year-1 estimate at your 24.0% rate — not tax advice; consult a CPA.
Schools (NCES district)
- District
- Orleans Parish
- NCES district ID
- 2201170
- Math proficiency
- 11% ▼ -52.00%
- Reading proficiency
- 27% ▼ -46.00%
- Median HH income
- $37,011
- Composite
- 15.78/100
- National rank
- #9271
- State rank
- #69 of 98 in LA
Livability — New Orleans
- Score
- 81/100
- State rank
- #3
- US rank
- #1383
Category grades
Schools grade is shown separately in the Schools card above.
Census & demographics
- Census place
- New Orleans, LA
- City population
- 338,817
- Population (ZIP)
- 22,973
Population outlook (Orleans County) Hauer SSP2
- Today (2025)
- 513,025 people
- By 2030
- 575,781 · +12.2%
- By 2040
- 700,174 · +36.5%
- By 2050
- 826,541 · +61.1%
- By 2075
- 1,123,374 · +119.0%
- By 2100
- 1,355,609 · +164.2%
Race, ethnicity, and origin ACS 2023
- Neighborhood character
- Predominantly Black (86%)
- Race & ethnicity
- Black 86% Asian 5% White 4% Two or more races 3%
- Foreign-born
- 4% · Vietnam, Canada
- Languages at home
- 95% English-only · Vietnamese 4% Spanish 1%
Political lean MEDSL · Orleans
- 2024 margin
- Solid D (+67.0) · D 82.2% · R 15.2% · Other 2.7%
- 2008→2024 swing
- +6.7pp toward D · 2008: 60.3pp · 2024: 67.0pp
- All cycles
- 2024: D+67.0 2020: D+68.2 2016: D+66.2 2012: D+62.5 2008: D+60.3
Not yet ingested
- Civics
- —
Market trends
- HPI YoY
- ▼ -15.51%
- Current HPI
- 247.7131
- Rent YoY
- —
- Metro
- —
- State GDP YoY
- ▲ 3.29%
- F500 in state
- 10
Industry mix (Fortune 500 HQ in LA)
| Industry | F500 HQs | Revenue |
|---|---|---|
| Telecommunications | 2 | $23B |
|
||
| Utilities | 1 | $12B |
|
||
| Wholesale / Distribution | 1 | $5B |
|
||
| Advertising | 1 | $2B |
|
||
Price history
+19.0% since first listed6 events — show timeline
- 2026-05-14 Price Changed $75,000 AcadianaMLS
- 2026-05-14 Price Changed $75,000 GSREIN
- 2026-01-20 Listed $85,000 GSREIN
- 2026-01-20 Listed $85,000 AcadianaMLS
- 2022-10-13 Listed $79,000 AcadianaMLS
- 1998-08-28 Sold (Public Records) $63,000 Public Records
Property tax history
+9.3%/yrLatest (2026): $1,332 · +1.1% YoY. Source: county tax records.
Cash-flow waterfall
monthlySold comps — $/sqft
last 12 mo · ≤1 miLoading sold comps…