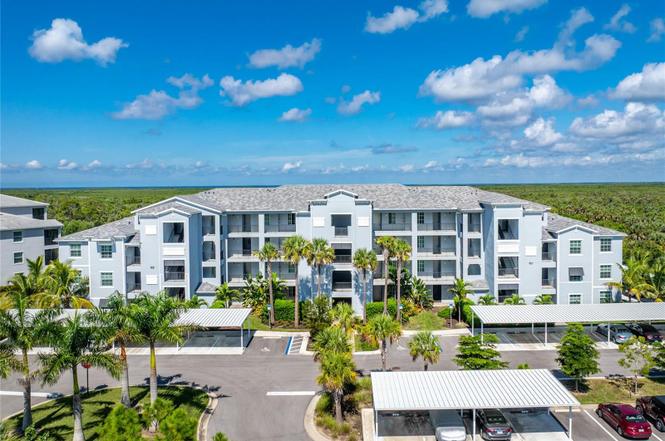
14121 Heritage Landing Blvd #731 · Punta Gorda, FL
Flood risk 9/10 · Severe
- FEMA flood zone
- AE
- Chance of flooding over 30 yrs
- 0.99%
- Est. flood insurance / yr
- $1,737 – $8,500
Fire risk 7/10 · Major
- Est. fire insurance / yr
- $947 – $1,759
Heat risk 10/10 · Severe
- Hot days now (above 107°F)
- 7 days/yr
- Hot days in 30 yrs
- 28 days/yr
Wind risk 10/10 · Severe
- Chance of severe wind over 30 yrs
- 99.0%
Air-quality risk 2/10 · Minimal
- Unhealthy air days now
- 1 days/yr
- Unhealthy air days in 30 yrs
- 2 days/yr
Risk factors via First Street. Map © Google.
Why this score? — see what drove the F grade
The composite is a weighted blend of 9 inputs, each scored 0–100. Each bar is that input's sub-score; the figure is the points it added to the 100-point composite (weight × sub-score).
- ARV discount +7.5/15.0
- Schools +4.6/10.0
- Livability +3.8/5.0
- 1% rule +3.1/10.0
- Rent growth +2.5/5.0
- Condition / age +2.5/5.0
- Cash flow +2.1/30.0
- DSCR +0.0/10.0
- Appreciation +0.0/10.0
$299,900
🖨 Deal sheet (PDF) 📄 Offer letter ✓ Due diligence
Listing remarks
Under contract-accepting backup offers. Welcome to this stunning never-lived-in 3-bedroom, 2-bathroom END UNIT condo in the highly sought-after Heritage Landing Golf & Country Club. Offering 1,407 square feet of beautifully upgraded living space, this unit combines luxury, comfort, and resort-style living — all with a GOLF MEMBERSHIP included! Step inside to find elegant crown molding, plantation shutters, and custom California closets, adding a touch of sophistication and function throughout. The modern kitchen features stainless steel appliances, quartz countertops, and a spacious layout perfect for entertaining. The primary suite boasts two walk-in closets and a spa-like bat
Key facts
- Resort-style pool
- $897 HOA
- Parking
Tags
Property features AI
Finance
- Other: CDD (community development district) applicable; Lease restrictions in place
- Financial info: Total monthly fees listed (association/condo fees shown in records)
- HOA & community: HOA required (Icon Management; Heritage Landing Golf and Country Club); Monthly condo fee listed; condo and association fees paid quarterly; Association fees cover pool, security, sewer, trash, water, insurance, structure maintenance, grounds maintenance, management, recreational facilities, escrow reserves; Community amenities include clubhouse, fitness center, pool, tennis courts, golf, sidewalks, community mailbox, deed restrictions; golf carts allowed; irrigation with reclaimed water; Buyer approval required; Pets allowed with restrictions (breed, number, size)
Exterior
- Parking: Covered parking; Guest parking; 1-car carport
- Security: 24-hour guard; Community security included with association
- Utilities: Public water; Public sewer; Cable available; Electricity connected
- Home design: Condominium; One-level unit on 3rd floor of a 4-story building; East-facing
- Construction: Block and stucco construction; Shingle roof; Slab foundation; Built by Lennar (Carolina model)
- Exterior features: Lighting; Sidewalk; Sliding doors; Storage; Tennis courts
Interior
- Kitchen: Dishwasher; Disposal; Microwave; Range; Refrigerator; Electric water heater
- Bedrooms: 3 bedrooms
- Flooring: Carpet; Ceramic tile
- Bathrooms: 2 full bathrooms
- Heating & cooling: Central heating (electric); Central air
- Interior features: Ceiling fans; Crown molding; Elevator in building; Open floor plan; Thermostat; Walk-in closets; Window treatments
- Laundry & utility: Washer and dryer included; Inside laundry room
Neighborhood map
What this means for you Summary
Snapshot
- This is a 2-bed/2.0-bath condo listed at $300k.
Deal economics
- At list price, monthly cash flow is $-2k ($-18k/yr) — negative.
- To cash-flow at today's rent, offer at most $85k (71.6% below list).
- To meet the 1% rule (rent ≥ 1% of price), the offer needs to be $242k (19.3% below list).
- Recommended offer: $85k (71.6% below list) — sets the bar for cash-flow.
- Cap rate 1.9% vs local median 2.8% in Punta Gorda — below-typical yield; the buyer is paying a premium for something (appreciation thesis, condition, location) that the cap rate doesn't capture.
Location & tenants
- Location reads 76/100 on livability (#225 in FL, #3,567 nationally) — a middle-class / working-renter tenant base. Strengths: crime A+, health & safety A+, housing B; Watch: cost of living D+, amenities D-, commute F.
- Charlotte (suburban): math 54% / reading 54% proficiency, ranked #22 of 73 in FL (top 30%) — acceptable for families but not a draw, mixed tenant base, ~2y average lease.
- Zoned schools: East Elementary School (math 67% / reading 68%, grade B+, #435 of 2,144 statewide, top 21%, 761 students, 52% FRL); Punta Gorda Middle School (math 54% / reading 52%, grade C+, #209 of 571 statewide, top 37%, 1,120 students, 41% FRL); Charlotte High School (math 44% / reading 46%, grade D-, #228 of 667 statewide, top 35%, 1,994 students, 41% FRL).
- Market conditions: 1490 active listings in the ZIP; 33 comparable units currently listed for rent nearby; rentals at typical pace (median 23d on market — plan ~3-4 weeks tenant-placement turnaround); solid renter incomes; 4,585 units permitted in Charlotte County in 2024 (703 in 5+ unit buildings).
- This rent runs 38% of the median local income ($77k/yr) — at the standard rent-burdened threshold; future hikes will face affordability resistance.
Forward outlook
- Local home prices are declining (-3.0%/yr); year-one equity from $2k of loan paydown is wiped out by about $9k of value loss. Plan a longer hold.
- Charlotte County population projected at +24% by 2050 — long-run rental-demand tailwind backs the buy-and-hold thesis.
Negotiation context
- It's been on market 273 days — a 12% lower offer ($264k) is reasonable based on typical stale-listing flexibility.
- 5 sale attempts since 3y ago; this cycle's ask has dropped $45k (13%) from the opening price — seller is motivated, your offer sets the floor, not the list.
Risks & watch-outs
- Watch-outs: flood insurance adds $427/mo; HOA is 37% of rent.
- Climate carrying-cost: in FEMA flood zone AE (mandatory federal flood insurance); severe wind risk, 99% chance of damaging wind over 30y; major wildfire risk; extreme-heat days projected 7→28/yr by 2055 (HVAC capex compounding) — expect insurance premiums to compound above CPI over the hold.
Questions for the listing agent
- What do current leases actually rent for vs. the listed asking? Can we see a recent rent roll and the last 12 months of T-12 income?
- It's been on market 273 days. Have you received any prior offers? Is the seller open to a 72% concession, seller financing, or rate buy-down credit?
- What's the actual annual flood-insurance premium (NFIP or private), and is the property in a SFHA with mandatory coverage?
- What does the HOA fee cover, when was the last increase, and are there any pending special assessments or reserve-fund shortfalls?
- Any open or pending special assessments — roof, HVAC, plumbing, elevator, façade? What's the per-unit balance and payoff schedule, and is the seller paying it off at close or rolling it to the buyer?
- Why hasn't it sold? Are there any deal-killer items the seller is aware of (foundation, flood, title, zoning, code violations)?
- Is there a deadline driving the sale (1031 exchange, divorce, estate, relocation)? That informs how much negotiation room exists.
- Schools are A-rated — typically a magnet for longer-tenancy family renters. What's the average tenant stay here, and is there a school-zone premium baked into asking?
- The area grade is low — what's the realistic commute time and amenity access for the typical tenant pool here? Any planned neighborhood developments (good or bad) we should know about?
- What's the average days-on-market for RENTAL listings here right now (not sales)? A rising rental-DOM trend means longer vacancies and softer asking-rent achievability than the comps imply.
- What's the recent tenant-quality profile in this submarket — average credit score on applications, eviction rate, late-payment / NSF rate, and stable-employment percentage? A property-management company in the area should have these aggregated.
- How much new apartment / multifamily construction is in the pipeline within 1–3 miles? Heavy new supply (>2% of stock underway) typically softens rents 12–24 months out; light construction supports rent growth.
Investment metrics
- 1% rule
- 0.81% ✗
- Cap rate
- 1.90%
- Cash-on-cash
- -15.67%
- DSCR
- 0.30
- GRM
- 10.3
CMA / ARV
No comps found within radius.
Projected returns pro-forma
-3.0% appreciation · 3.0% rent growth · sell at horizon
- IRR
- -61.8%
- Equity multiple
- -0.72×
- Total profit
- $-144,744
- Equity at exit
- $44,716
- IRR
- —
- Equity multiple
- -1.95×
- Total profit
- $-247,422
- Equity at exit
- $25,930
Cash invested: $83,972 (down + closing). Projections, not guarantees.
Landlord ↔ Tenant lean methodology
- Overall (STATE)
- 87 Strongly Landlord-Friendly
- State Florida
- 87 Strongly Landlord-Friendly · R+3
- County
- — inherits STATE
- City
- — inherits STATE
ZIP-level market 33955
- Home prices YoY
- -24.5%
- Active inventory
- 1490
- Price-to-rent
- 10.3×
Monthly cashflow live
- Estimated rent
- $2,419 medium interval (Pro) →
- Mortgage (P&I)
- −$1,573
- Tax from tax record
- −$413 /mo · $4,961/yr
- Insurance
- −$125
- Flood insurance flood zone
- −$427 /mo · $5,118/yr
- HOA
- −$897
- Vacancy / Maint / Mgmt
- −$508
- Net cashflow
- $-1,523
Break-even live
Sensitivity live
| Price | -10% $-1,354 | -5% $-1,438 | +0% $-1,523 | +5% $-1,608 | +10% $-1,693 |
|---|---|---|---|---|---|
| Rent | -10% $-1,714 | -5% $-1,619 | +0% $-1,523 | +5% $-1,428 | +10% $-1,332 |
| Rate | -1.0pp $-1,372 | -0.5pp $-1,447 | base $-1,523 | +0.5pp $-1,601 | +1.0pp $-1,680 |
UW: 25.0% down · 7.5% · 30yr · 1.5% tax · 5.0% vac · 8.0% maint · 8.0% mgmt
Financing live
Cash to close
- Down payment
- $74,975
- Closing costs
- $8,997
- Reserves months
- —
- Total cash needed
- —
Loan-product check · same deal, 3 products live
Conventional
25% down · 7.5% · 30yr
- Down + closing
- —
- Monthly P&I
- —
- Monthly cashflow
- —
- DSCR
- —
- Eligible?
- —
Personal DTI + credit; lowest rate.
DSCR
20% down · 8.5% · 30yr
- Down + closing
- —
- Monthly P&I
- —
- Monthly cashflow
- —
- DSCR
- —
- Eligible?
- —
No personal income docs; deal must DSCR.
Hard money
10% down · 12.0% · 12mo
- Down + closing
- —
- Monthly P&I
- —
- Monthly cashflow
- —
- DSCR
- —
- Eligible?
- —
Short-term bridge; refi at stabilization.
Rent comps 33 comps
| Address | Beds | Baths | Sqft | Rent | $/sqft | DOM | Units | Dist |
|---|---|---|---|---|---|---|---|---|
| 14121 Heritage Landing Blvd #743 Punta Gorda, FL | 2.0 | 2.0 | 1120 | $6,000 | $5.36 | 22d | 1 | 0.04mi |
| 14091 Heritage Landing Blvd Punta Gorda, FL | 2.0 | 2.0 | 1157 | $5,000 | $4.32 | 22d | 2 | 0.11mi |
| 14091 Heritage Landing Blvd Unit Reservation spot 1 Punta Gorda, FL | 2.0 | 2.0 | 1194 | $5,000 | $4.19 | 22d | 1 | 0.11mi |
| 14141 Heritage Landing Blvd #935 Punta Gorda, FL | 2.0 | 2.0 | 1120 | $5,500 | $4.91 | 22d | 1 | 0.12mi |
| 14141 Heritage Landing Blvd #922 Punta Gorda, FL | 2.0 | 2.0 | 1154 | $2,200 | $1.91 | 22d | 1 | 0.12mi |
| 14081 Heritage Landing Blvd Punta Gorda, FL | 2.0 | 2.0 | 1176 | $5,750 | $4.89 | 22d | 2 | 0.17mi |
| 14050 Heritage Landing Blvd #226 Punta Gorda, FL | 2.0 | 2.0 | 1596 | $6,500 | $4.07 | 22d | 1 | 0.17mi |
| 14149 Poppy Field Loop #6011 Punta Gorda, FL | 3.0 | 2.0 | 1741 | $6,500 | $3.73 | 22d | 1 | 0.18mi |
| 14161 Poppy Field Loop #5811 Punta Gorda, FL | 3.0 | 2.0 | 1741 | $4,200 | $2.41 | 22d | 1 | 0.20mi |
| 14161 Heritage Landing Blvd #1118 Punta Gorda, FL | 2.0 | 2.0 | 1407 | $1,800 | $1.28 | 22d | 1 | 0.22mi |
| 14061 Heritage Landing Blvd Punta Gorda, FL | 2.0–3.0 | 2.0 | 1302 | $4,000 | $3.07 | 22d | 3 | 0.26mi |
| 14051 Heritage Landing Blvd Punta Gorda, FL | 2.0–3.0 | 2.0 | 1280 | $4,000 | $3.12 | 22d | 2 | 0.29mi |
| 14051 Heritage Landing Blvd Unit Reservation spot 1 Punta Gorda, FL | 2.0 | 2.0 | 1198 | $2,600 | $2.17 | 22d | 1 | 0.30mi |
| 14191 Heritage Landing Blvd #1214 Punta Gorda, FL | 2.0 | 2.0 | 1120 | $1,585 | $1.42 | 22d | 1 | 0.31mi |
| 14201 Heritage Landing Blvd Unit 1338 Punta Gorda, FL | 3.0 | 2.0 | 1301 | $6,000 | $4.61 | 22d | 1 | 0.35mi |
| 14201 Heritage Landing Blvd #1312 Punta Gorda, FL | 2.0 | 2.0 | 1154 | $1,750 | $1.52 | 22d | 1 | 0.35mi |
| 14041 Heritage Landing Blvd #642 Punta Gorda, FL | 2.0 | 2.0 | 1154 | $6,000 | $5.20 | 22d | 1 | 0.35mi |
| 14194 Heritage Landing Blvd #614 Punta Gorda, FL | 2.0 | 2.0 | 1366 | $1,995 | $1.46 | 22d | 1 | 0.38mi |
| 14649 Sycamore Ct #2912 Punta Gorda, FL | 3.0 | 2.0 | 1741 | $7,000 | $4.02 | 22d | 1 | 0.43mi |
| 14184 Heritage Landing Blvd Punta Gorda, FL | 2.0 | 2.0 | 1366 | $1,947 | $1.43 | 22d | 2 | 0.45mi |
| 14221 Heritage Landing Blvd Unit 2014 Punta Gorda, FL | 2.0 | 2.0 | 1366 | $6,000 | $4.39 | 22d | 1 | 0.45mi |
| 14656 Sycamore Ct #3211 Punta Gorda, FL | 3.0 | 2.0 | 1741 | $7,000 | $4.02 | 22d | 1 | 0.46mi |
| 14231 Heritage Landing Blvd Unit 1928 Punta Gorda, FL | 2.0 | 2.0 | 1596 | $6,000 | $3.76 | 22d | 1 | 0.50mi |
| 14271 Heritage Landing Blvd Punta Gorda, FL | 2.0 | 2.0 | 1355 | $6,500 | $4.80 | 22d | 1 | 0.52mi |
| 14224 Heritage Landing Blvd #921 Punta Gorda, FL | 2.0 | 2.0 | 1569 | $3,400 | $2.17 | 22d | 1 | 0.52mi |
| 14224 Heritage Landing Blvd Unit 1 Punta Gorda, FL | 2.0 | 2.0 | 1366 | $4,500 | $3.29 | 22d | 1 | 0.52mi |
| 14241 Heritage Landing Blvd #1821 Punta Gorda, FL | 2.0 | 2.0 | 1569 | $6,000 | $3.82 | 22d | 1 | 0.55mi |
| 14251 Heritage Landing Blvd Unit 1723 Punta Gorda, FL | 2.0 | 2.0 | 1366 | $6,000 | $4.39 | 22d | 1 | 0.60mi |
| 14251 Heritage Landing Blvd Unit 1713 Punta Gorda, FL | 2.0 | 2.0 | 1366 | $4,800 | $3.51 | 15d | 1 | 0.60mi |
| 14261 Heritage Landing Blvd #1615 Punta Gorda, FL | 2.0 | 2.0 | 1366 | $6,000 | $4.39 | 22d | 1 | 0.64mi |
| 14271 Heritage Landing Blvd #1527 Punta Gorda, FL | 2.0 | 2.0 | 1422 | $2,800 | $1.97 | 22d | 1 | 0.69mi |
| 14267 Heritage Landing Blvd #1222 Punta Gorda, FL | 2.0 | 2.0 | 1569 | $4,200 | $2.68 | 22d | 1 | 0.71mi |
| 14040 Heritage Landing Blvd #113 Punta Gorda, FL | 2.0 | 2.0 | 1438 | $6,500 | $4.52 | 22d | 1 | 0.78mi |
HOA detail condo
- Monthly dues
- $897 · $10,764/yr
- Assessments
- None detected in remarks — confirm with the listing agent.
Listing history 33 events
-
2026-06-22statusdays on market $299,900 Pending 273 DOM
-
2026-06-18days on market $299,900 Active 272 DOM
-
2026-06-17days on market $299,900 Active 271 DOM
-
2026-06-16days on market $299,900 Active 270 DOM
-
2026-06-15days on market $299,900 Active 269 DOM
-
2026-06-14days on market $299,900 Active 267 DOM
-
2026-06-13days on market $299,900 Active 266 DOM
-
2026-06-10days on market $299,900 Active 264 DOM
-
2026-06-09days on market $299,900 Active 263 DOM
-
2026-06-08days on market $299,900 Active 262 DOM
-
2026-06-05days on market $299,900 Active 258 DOM
-
2026-06-02days on market $299,900 Active 256 DOM
-
2026-06-01days on market $299,900 Active 255 DOM
-
2026-05-31days on market $299,900 Active 254 DOM
-
2026-05-30days on market $299,900 Active 253 DOM
-
2026-04-06price $299,900
-
2026-03-04price $309,900
-
2026-01-26price $319,900
-
2025-11-19price $334,900
-
2025-09-19$344,900 Active
-
2025-07-09historical
-
2025-03-01price $379,500
-
2024-07-09$383,500 Active
-
2024-06-01historical
-
2024-04-29price $389,900
-
2024-01-03status Active
-
2023-12-30historical
-
2023-11-01price $399,900
-
2023-09-15price $446,500
-
2023-07-10$448,900 Active
-
2023-07-08historical
-
2023-04-07price $444,998
-
2023-01-09$450,000 Active
ⓘ Source: listings_history table (triggers on properties + properties_extension) + one-shot
backfill from property_details.listing_events for pre-trigger history.
Tax reassessment forecast FL · Resets to sale price
- Current annual tax
- $4,961 · $413/mo
- Projected year-2 tax
- $4,961 · $413/mo
- Expected delta
- $0/yr ($0/mo · 0.0%)
ⓘ Screening estimate from a state-policy table — verify with the county assessor before closing.
Climate risk First Street
- Flood 9/10 Extreme FEMA zone AE · 99% chance over 30 yrs
- Wildfire 7/10 Severe
- Heat 10/10 Extreme 7 d/yr ≥107°F today · 28 d/yr by 30 yrs out
- Wind 10/10 Extreme 99% chance of damaging wind over 30 yrs
- Air quality 2/10 Low 1 unhealthy d/yr today · 2 by 30 yrs out
Nearby sold comps map
Loading sold comps map…
Walkable amenities ~0.75 mi
Loading nearby amenities…
Taxation est. · year 1
- Rental income
- $29,033
- − Mortgage interest
- −$16,799
- − Property taxes
- −$4,961
- − Insurance
- −$6,618
- − Repairs & maintenance
- −$2,323
- − Management
- −$2,323
- − HOA
- −$10,764
- − Depreciation
- −$8,724
- Taxable loss
- −$23,479
- Est. tax savings @ 24.0%
- +$5,635
- After-tax cash flow
- $-12,645/yr
For passive investors: Depreciation is non-cash, so a rental often shows a tax loss while cash-flowing — sheltering income. Rental losses are passive: they offset passive income freely, and up to $25,000/yr can offset ordinary (W-2) income if you actively participate and your MAGI is under $100k (phasing out to $0 by $150k); unused losses carry forward. On sale, claimed depreciation is recaptured at up to 25%, and gains may owe capital-gains tax (a 1031 exchange can defer both). Figures are a year-1 estimate at your 24.0% rate — not tax advice; consult a CPA.
Schools (NCES district)
- District
- Charlotte
- NCES district ID
- 1200240
- Math proficiency
- 54% ▼ -6.00%
- Reading proficiency
- 54% ▼ -1.00%
- Median HH income
- $44,864
- Composite
- 45.62/100
- National rank
- #2586
- State rank
- #22 of 73 in FL
Livability — Punta Gorda
- Score
- 76/100
- State rank
- #225
- US rank
- #3567
Category grades
Schools grade is shown separately in the Schools card above.
Census & demographics
- County
- Charlotte County · 196,994 people
- City population
- 68,831
- Metro
- Punta Gorda, FL
- Population (ZIP)
- 12,399
- Household income
- $76,943
- Rent vs Own
- Severe rent burden
- 226.0
Population outlook (Charlotte County) Hauer SSP2
- Today (2025)
- 198,646 people
- By 2030
- 210,507 · +6.0%
- By 2040
- 230,857 · +16.2%
- By 2050
- 247,148 · +24.4%
- By 2075
- 281,777 · +41.8%
- By 2100
- 293,609 · +47.8%
Race, ethnicity, and origin ACS 2023
- Neighborhood character
- Predominantly White (84%)
- Race & ethnicity
- White 84% Hispanic / Latino 10% Two or more races 9% Black 2%
- Hispanic origin (detail)
- Mexican 4% Puerto Rican 2% Cuban 4%
- Common ancestry
- Romanian 5% Italian 3% Serbian 3%
- Foreign-born
- 8% · Canada
- Languages at home
- 91% English-only · Spanish 5% Other Indo-European 1%
Political lean MEDSL · Charlotte
- 2024 margin
- Solid R (+34.0) · D 32.7% · R 66.7%
- 2008→2024 swing
- -26.7pp toward R · 2008: -7.2pp · 2024: -34.0pp
- All cycles
- 2024: R+34.0 2020: R+26.6 2016: R+27.8 2012: R+14.3 2008: R+7.2
Not yet ingested
- Civics
- —
Market trends
- HPI YoY
- ▼ -78.71%
- Current HPI
- 242.9043
- Rent YoY
- —
- Metro
- Punta Gorda, FL
- State GDP YoY
- ▲ 3.28%
- F500 in state
- 36
Industry mix (Fortune 500 HQ in FL)
| Industry | F500 HQs | Revenue |
|---|---|---|
| Industrial Technology | 2 | $29B |
|
||
| Insurance | 2 | $17B |
|
||
| Retail | 1 | $60B |
|
||
| Technology Distribution | 1 | $58B |
|
||
| Homebuilding | 1 | $35B |
|
||
| Technology Manufacturing | 1 | $35B |
|
||
Price history
-33.4% since first listed18 events — show timeline
- 2026-04-06 Price Changed $299,900 Stellar MLS as Distributed by MLS Grid
- 2026-03-04 Price Changed $309,900 Stellar MLS as Distributed by MLS Grid
- 2026-01-26 Price Changed $319,900 Stellar MLS as Distributed by MLS Grid
- 2025-11-19 Price Changed $334,900 Stellar MLS as Distributed by MLS Grid
- 2025-09-19 Listed $344,900 Stellar MLS as Distributed by MLS Grid
- 2025-07-09 Listing Removed — Stellar MLS as Distributed by MLS Grid
- 2025-03-01 Price Changed $379,500 Stellar MLS as Distributed by MLS Grid
- 2024-07-09 Listed $383,500 Stellar MLS as Distributed by MLS Grid
- 2024-06-01 Listing Removed — Stellar MLS as Distributed by MLS Grid
- 2024-04-29 Price Changed $389,900 Stellar MLS as Distributed by MLS Grid
- 2024-01-03 Relisted — Stellar MLS as Distributed by MLS Grid
- 2023-12-30 Listing Removed — Stellar MLS as Distributed by MLS Grid
- 2023-11-01 Price Changed $399,900 Stellar MLS as Distributed by MLS Grid
- 2023-09-15 Price Changed $446,500 Stellar MLS as Distributed by MLS Grid
- 2023-07-10 Listed $448,900 Stellar MLS as Distributed by MLS Grid
- 2023-07-08 Listing Removed — Stellar MLS as Distributed by MLS Grid
- 2023-04-07 Price Changed $444,998 Stellar MLS as Distributed by MLS Grid
- 2023-01-09 Listed $450,000 Stellar MLS as Distributed by MLS Grid
Property tax history
-5.8%/yrLatest (2025): $4,961 · -5.9% YoY. Source: county tax records.
Cash-flow waterfall
monthlySold comps — $/sqft
last 12 mo · ≤1 miLoading sold comps…