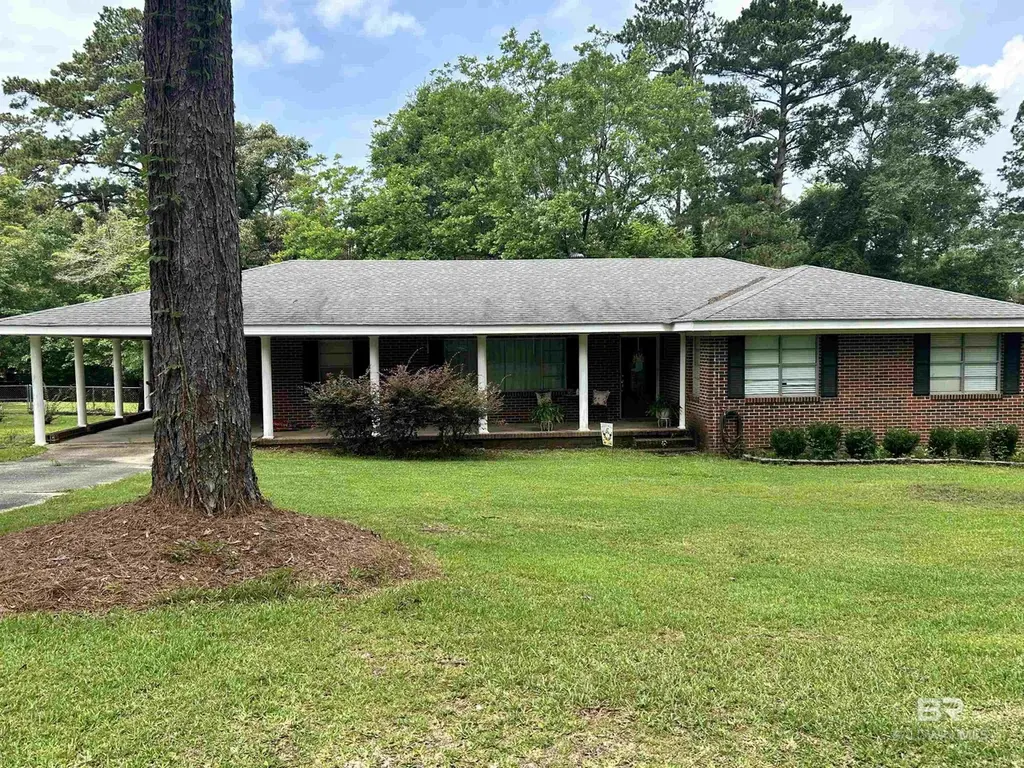
1701 Collier Ave · Bay Minette, AL
Flood risk 1/10 · Minimal
- FEMA flood zone
- X (unshaded)
- Chance of flooding over 30 yrs
- 0.0%
- Est. flood insurance / yr
- $507 – $1,088
Fire risk 3/10 · Minor
- Est. fire insurance / yr
- $916 – $1,700
Heat risk 8/10 · Major
- Hot days now (above 106°F)
- 7 days/yr
- Hot days in 30 yrs
- 20 days/yr
Wind risk 9/10 · Severe
- Chance of severe wind over 30 yrs
- 99.0%
Air-quality risk 1/10 · Minimal
- Unhealthy air days now
- 0 days/yr
- Unhealthy air days in 30 yrs
- 0 days/yr
Risk factors via First Street. Map © Google.
Why this score? — see what drove the D+ grade
The composite is a weighted blend of 9 inputs, each scored 0–100. Each bar is that input's sub-score; the figure is the points it added to the 100-point composite (weight × sub-score).
- Cash flow +15.0/30.0
- ARV discount +13.1/15.0
- DSCR +4.6/10.0
- Schools +3.9/10.0
- Livability +3.2/5.0
- 1% rule +2.9/10.0
- Rent growth +2.5/5.0
- Condition / age +2.5/5.0
- Appreciation +0.0/10.0
$239,000
🖨 Deal sheet (PDF) 📄 Offer letter ✓ Due diligence
Listing remarks MLS
Check out this great fixer upper that is conveniently located in Bay Minette, not far from the interstate! This 3-bedroom, 2-bathroom brick home offers great potential for those looking to make their own improvements. 2021 Roof and AC. The home sits on 0.6 of an acre, fenced in with a building in the back. There is a 4th room off of the kitchen that can be an office or made into a pantry and a bonus enclosed room off the back! This home has plenty potential to become your dream home. Home sold AS IS, WHERE IS! Buyer to verify all information during due diligence.
Key facts
- Split brick floors
- Fenced back yard
- Large corner lot
Tags
Property features AI
Finance
- HOA & community: No community features; No transfer fees
Exterior
- Parking: Single carport (1 covered space)
- Utilities: Water: North Baldwin Utilities; Electric: Alabama Power
- Home design: One-story residence; Resale property; No waterfront
- Construction: Brick and wood siding with wood frame construction; Composition roof; Building area approx. 1,858 square feet (assessor)
- Exterior features: Covered patio/porch; Fenced yard; Storage structure
Interior
- Kitchen: Electric range; Refrigerator with ice maker; Separate dining room
- Bedrooms: Primary bedroom on the main level (approx. 10' x 18'); Bedroom 2 (approx. 11' x 13'); Bedroom 3 (approx. 10' x 11')
- Flooring: Split brick flooring; Wood flooring
- Bathrooms: 2 full bathrooms
- Heating & cooling: Central electric heating
- Interior features: Ceiling fans; Wood-burning fireplace in the living room
Neighborhood map
What this means for you Summary
Snapshot
- This is a 4-bed/2.0-bath single-family listed at $239k.
Deal economics
- At list price, monthly cash flow is $75 ($906/yr) — positive.
- The deal already cash-flows at list — no discount required.
- To meet the 1% rule (rent ≥ 1% of price), the offer needs to be $190k (20.5% below list).
- Recommended offer: $190k (20.5% below list) — sets the bar for 1% rule.
- Cap rate 6.7% vs local median 3.7% in Bay Minette — top-decile yield for the area; either an underpriced asset or a hidden risk that comps aren't pricing in. Stress-test before assuming the spread holds.
Location & tenants
- Location reads 63/100 on livability (#179 in AL) — a middle-class / working-renter tenant base. Strengths: cost of living A+, housing A, health & safety A; Watch: crime D+, amenities F, commute F.
- Baldwin County (rural): math 33% / reading 57% proficiency, ranked #18 of 129 in AL (top 14%) — families likely to look elsewhere, expect single-tenant / working-renter base with shorter leases.
- Zoned schools: Bay Minette Elementary School (math 20% / reading 47%, grade F, #318 of 627 statewide, top 51%, 796 students, 74% FRL); Bay Minette Middle School (math 11% / reading 40%, grade F, #158 of 257 statewide, top 63%, 435 students, 78% FRL); Baldwin County High School (math 19% / reading 27%, grade F, #140 of 305 statewide, top 46%, 1,039 students, 66% FRL) — zoned schools average 73% FRL vs 38% district-wide (34 pts higher); higher-poverty schools than district average — tighter screening recommended.
- Zoned-school proficiency averages 27% at this address vs 45% district-wide (-18 pts) — the specific schools serving this property underperform the Baldwin County average; the district grade overstates school quality for this exact location.
- Market conditions: 215 active listings in the ZIP; 1 comparable units currently listed for rent nearby; 3,883 units permitted in Baldwin County in 2024 (481 in 5+ unit buildings).
Forward outlook
- Local home prices are declining (-3.0%/yr); year-one equity from $2k of loan paydown is wiped out by about $7k of value loss. Plan a longer hold.
- Baldwin County population projected at +42% by 2050 — long-run rental-demand tailwind backs the buy-and-hold thesis.
Negotiation context
- It's been on market 19 days — a 2% lower offer ($235k) is reasonable based on typical stale-listing flexibility.
- 4 sale attempts since 15y ago with the ask held roughly flat each time — persistent listings suggest the price (not the market) is what's stuck; bring a comps-based counter.
- Current owner paid $160k; 49% above their basis — modest negotiation headroom, anchor on the comps not their cost.
Risks & watch-outs
- Climate carrying-cost: severe wind risk, 99% chance of damaging wind over 30y; extreme-heat days projected 7→20/yr by 2055 (HVAC capex compounding) — expect insurance premiums to compound above CPI over the hold.
Questions for the listing agent
- Built in 1962 — when were the roof, HVAC, electrical panel, plumbing, and water heater last replaced?
- Is there a deadline driving the sale (1031 exchange, divorce, estate, relocation)? That informs how much negotiation room exists.
- Schools are D-rated, which usually means shorter tenancies and higher turnover. Who's the typical renter profile here, and what's been the actual vacancy rate?
- Crime grade is D in this area — have there been break-ins, vandalism, or insurance claims at this property in the last 3 years? What carrier currently insures it and at what premium?
- The area grade is low — what's the realistic commute time and amenity access for the typical tenant pool here? Any planned neighborhood developments (good or bad) we should know about?
- What's the average days-on-market for RENTAL listings here right now (not sales)? A rising rental-DOM trend means longer vacancies and softer asking-rent achievability than the comps imply.
- What's the recent tenant-quality profile in this submarket — average credit score on applications, eviction rate, late-payment / NSF rate, and stable-employment percentage? A property-management company in the area should have these aggregated.
- How much new for-sale + rental construction is in the pipeline within 1–3 miles? Heavy new supply typically softens prices + rents 12–24 months out; constrained supply supports both.
Investment metrics
- 1% rule
- 0.79% ✗
- Cap rate
- 6.67%
- Cash-on-cash
- 1.35%
- DSCR
- 1.06
- GRM
- 10.5
CMA / ARV
- ARV (on-the-fly)
- $273,126
- Comps found
- 12
Show comp detail 12 sales within ~0.75 mi
| Address | Dist | Beds/Ba | Sqft | Sold | Price | $/sf | Match |
|---|---|---|---|---|---|---|---|
| 1605 Collier Ave | 0.06mi | 4/2.5 | 1,767 (-5%) | 1mo | $260,000 | $147 | 86 |
| 1805 Collier Ave | 0.12mi | 4/2.5 | 1,704 (-8%) | 5mo | $125,000 | $73 | 75 |
| 704 Jillian Pl | 0.13mi | 3/2.0 (-1) | 1,677 (-10%) | 7mo | $290,000 | $173 | 67 |
| 1700 Hand Ave | 0.53mi | 3/2.0 (-1) | 1,889 (+2%) | 5mo | $137,000 | $73 | 63 |
| 402 W 15th St | 0.22mi | 3/2.0 (-1) | 1,668 (-10%) | 11mo | $245,000 | $147 | 58 |
| 1909 Mary Jane Dr | 0.73mi | 4/2.0 | 1,876 (+1%) | 9mo | $317,500 | $169 | 57 |
| 1807 Mary Jane Dr | 0.74mi | 4/2.0 | 1,913 (+3%) | 4mo | $317,000 | $166 | 57 |
| 1710 Auburn Ave | 0.66mi | 4/2.0 | 1,753 (-6%) | 5mo | $237,500 | $135 | 56 |
| 400 W 15th St | 0.24mi | 3/2.0 (-1) | 1,602 (-14%) | 10mo | $242,000 | $151 | 53 |
| 1700 Elaine Ave | 0.59mi | 3/2.0 (-1) | 1,607 (-14%) | 0mo | $199,900 | $124 | 44 |
| 1110 Hand Ave | 0.72mi | 3/2.0 (-1) | 2,006 (+8%) | 8mo | $270,000 | $135 | 42 |
| 707 W 9th St | 0.73mi | 4/2.0 | 1,711 (-8%) | 19mo | $275,000 | $161 | 37 |
Match score weights: distance 35% · size 25% · config 20% · recency 20%. Top-matched comps best support the ARV.
Projected returns pro-forma
-3.0% appreciation · 3.0% rent growth · sell at horizon
- IRR
- -14.2%
- Equity multiple
- 0.49×
- Total profit
- $-34,032
- Equity at exit
- $35,636
- IRR
- -5.5%
- Equity multiple
- 0.64×
- Total profit
- $-23,893
- Equity at exit
- $20,664
Cash invested: $66,920 (down + closing). Projections, not guarantees.
Landlord ↔ Tenant lean methodology
- Overall (STATE)
- 90 Strongly Landlord-Friendly
- State Alabama
- 90 Strongly Landlord-Friendly · R+15
- County
- — inherits STATE
- City
- — inherits STATE
ZIP-level market 36507
- Home prices YoY
- -7.2%
- Active inventory
- 215
- Price-to-rent
- 10.5×
Monthly cashflow live
- Estimated rent
- $1,900 medium interval (Pro) →
- Mortgage (P&I)
- −$1,253
- Tax from tax record
- −$73 /mo · $871/yr
- Insurance
- −$100
- HOA
- −$0
- Vacancy / Maint / Mgmt
- −$399
- Net cashflow
- $75
Break-even live
Sensitivity live
| Price | -10% $211 | -5% $143 | +0% $75 | +5% $8 | +10% $-60 |
|---|---|---|---|---|---|
| Rent | -10% $-75 | -5% $0 | +0% $75 | +5% $151 | +10% $226 |
| Rate | -1.0pp $196 | -0.5pp $136 | base $75 | +0.5pp $14 | +1.0pp $-49 |
UW: 25.0% down · 7.5% · 30yr · 1.5% tax · 5.0% vac · 8.0% maint · 8.0% mgmt
Financing live
Cash to close
- Down payment
- $59,750
- Closing costs
- $7,170
- Reserves months
- —
- Total cash needed
- —
Loan-product check · same deal, 3 products live
Conventional
25% down · 7.5% · 30yr
- Down + closing
- —
- Monthly P&I
- —
- Monthly cashflow
- —
- DSCR
- —
- Eligible?
- —
Personal DTI + credit; lowest rate.
DSCR
20% down · 8.5% · 30yr
- Down + closing
- —
- Monthly P&I
- —
- Monthly cashflow
- —
- DSCR
- —
- Eligible?
- —
No personal income docs; deal must DSCR.
Hard money
10% down · 12.0% · 12mo
- Down + closing
- —
- Monthly P&I
- —
- Monthly cashflow
- —
- DSCR
- —
- Eligible?
- —
Short-term bridge; refi at stabilization.
Rent comps 1 comps
| Address | Beds | Baths | Sqft | Rent | $/sqft | DOM | Units | Dist |
|---|---|---|---|---|---|---|---|---|
| 301 Petty Ln Bay Minette, AL | 2.0–3.0 | 3.0 | 1350 | $1,900 | $1.41 | 22d | 1 | 0.67mi |
Listing history 15 events
-
2026-06-21days on market $239,000 Active 19 DOM
-
2026-06-19days on market $239,000 Active 17 DOM
-
2026-06-18days on market $239,000 Active 16 DOM
-
2026-06-17days on market $239,000 Active 15 DOM
-
2026-06-16days on market $239,000 Active 14 DOM
-
2026-06-15days on market $239,000 Active 13 DOM
-
2026-06-14days on market $239,000 Active 11 DOM
-
2026-06-13days on market $239,000 Active 10 DOM
-
2026-06-10days on market $239,000 Active 8 DOM
-
2026-06-09days on market $239,000 Active 7 DOM
-
2026-06-08days on market $239,000 Active 6 DOM
-
2026-06-07days on market $239,000 Active 5 DOM
-
2026-06-05days on market $239,000 Active 2 DOM
-
2026-06-03remarks 566-char remark
-
2026-06-03$239,000 Active 1 DOM
ⓘ Source: listings_history table (triggers on properties + properties_extension) + one-shot
backfill from property_details.listing_events for pre-trigger history.
Tax reassessment forecast AL · Resets to sale price
- Current annual tax
- $871 · $73/mo
- Projected year-2 tax
- $980 · $82/mo
- Expected delta
- +$109/yr (+$9/mo · 12.5%)
ⓘ Screening estimate from a state-policy table — verify with the county assessor before closing.
Climate risk First Street
- Flood 1/10 Low FEMA zone X (unshaded) · 0% chance over 30 yrs
- Wildfire 3/10 Moderate
- Heat 8/10 Severe 7 d/yr ≥106°F today · 20 d/yr by 30 yrs out
- Wind 9/10 Extreme 99% chance of damaging wind over 30 yrs
- Air quality 1/10 Low 0 unhealthy d/yr today · 0 by 30 yrs out
Nearby sold comps map
Loading sold comps map…
Walkable amenities ~0.75 mi
Loading nearby amenities…
Taxation est. · year 1
- Rental income
- $22,800
- − Mortgage interest
- −$13,388
- − Property taxes
- −$871
- − Insurance
- −$1,195
- − Repairs & maintenance
- −$1,824
- − Management
- −$1,824
- − Depreciation
- −$6,953
- Taxable loss
- −$3,255
- Est. tax savings @ 24.0%
- +$781
- After-tax cash flow
- $1,687/yr
For passive investors: Depreciation is non-cash, so a rental often shows a tax loss while cash-flowing — sheltering income. Rental losses are passive: they offset passive income freely, and up to $25,000/yr can offset ordinary (W-2) income if you actively participate and your MAGI is under $100k (phasing out to $0 by $150k); unused losses carry forward. On sale, claimed depreciation is recaptured at up to 25%, and gains may owe capital-gains tax (a 1031 exchange can defer both). Figures are a year-1 estimate at your 24.0% rate — not tax advice; consult a CPA.
Schools (NCES district)
- District
- Baldwin County
- NCES district ID
- 0100270
- Math proficiency
- 33% ▼ -26.00%
- Reading proficiency
- 57% ▲ 1.00%
- Median HH income
- $50,677
- Composite
- 38.61/100
- National rank
- #4157
- State rank
- #18 of 129 in AL
Livability — Bay Minette
- Score
- 63/100
- State rank
- #179
- US rank
- #15153
Category grades
Schools grade is shown separately in the Schools card above.
Census & demographics
- Census place
- Bay Minette, AL
- Population (ZIP)
- 20,350
Population outlook (Baldwin County) Hauer SSP2
- Today (2025)
- 248,264 people
- By 2030
- 270,315 · +8.9%
- By 2040
- 312,967 · +26.1%
- By 2050
- 352,262 · +41.9%
- By 2075
- 438,841 · +76.8%
- By 2100
- 487,736 · +96.5%
Race, ethnicity, and origin ACS 2023
- Neighborhood character
- Predominantly White (71%)
- Race & ethnicity
- White 71% Black 23% Two or more races 4% Hispanic / Latino 2%
- Common ancestry
- Lithuanian 2% Serbian 2% Slovak 1%
- Foreign-born
- 1%
- Languages at home
- 98% English-only · Spanish 1%
Political lean MEDSL · Baldwin
- 2024 margin
- Solid R (+58.2) · D 20.5% · R 78.7%
- 2008→2024 swing
- -6.7pp toward R · 2008: -51.5pp · 2024: -58.2pp
- All cycles
- 2024: R+58.2 2020: R+53.8 2016: R+57.8 2012: R+55.8 2008: R+51.5
Not yet ingested
- Civics
- —
Market trends
- HPI YoY
- ▼ -25.62%
- Current HPI
- 329.316
- Rent YoY
- —
- Metro
- —
- State GDP YoY
- ▲ 2.94%
- F500 in state
- 4
Industry mix (Fortune 500 HQ in AL)
| Industry | F500 HQs | Revenue |
|---|---|---|
| Financial Services | 1 | $8B |
|
||
| Healthcare | 1 | $5B |
|
||
Price history
+70.8% since first listed11 events — show timeline
- 2026-06-02 Listed $239,000 BCAR
- 2025-06-06 Sold (Public Records) $160,000 Public Records
- 2025-06-04 Sold (MLS) $160,000 BCAR
- 2025-04-15 Pending — BCAR
- 2025-04-08 Relisted — BCAR
- 2025-03-31 Pending — BCAR
- 2025-03-25 Listed $170,000 BCAR
- 2011-10-24 Sold (Public Records) $70,225 Public Records
- 2011-10-20 Sold (MLS) $70,000 BCAR
- 2011-04-30 Listed $89,667 BCAR
- 2007-04-13 Sold (Public Records) $139,900 Public Records
Property tax history
+8.4%/yrLatest (2025): $871 · +25.5% YoY. Source: county tax records.
Cash-flow waterfall
monthlySold comps — $/sqft
last 12 mo · ≤1 miLoading sold comps…