 🏷️ Likely Rental
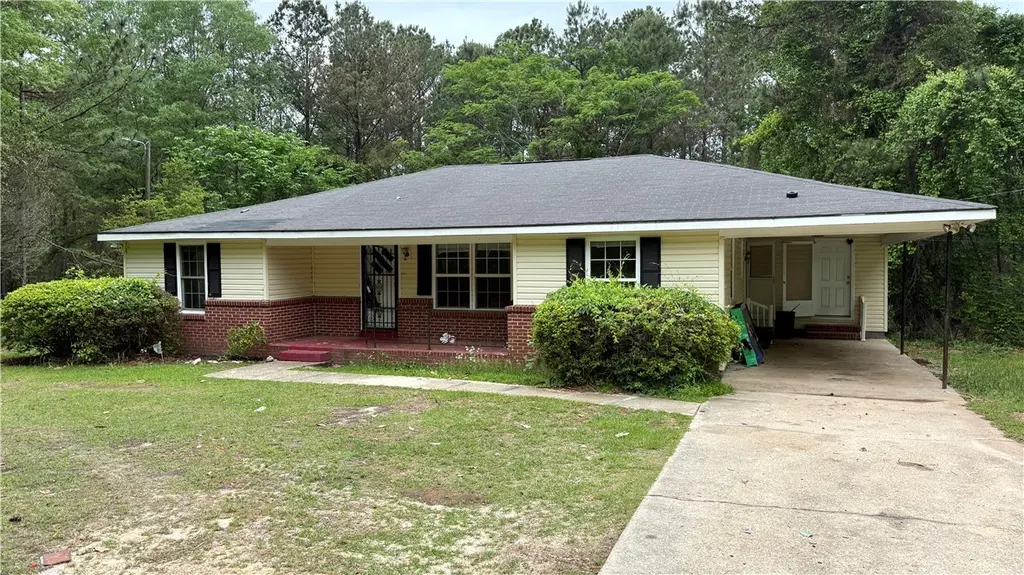
626 Lee Road 17 · Auburn, AL
Flood risk 1/10 · Minimal
- FEMA flood zone
- X (unshaded)
- Chance of flooding over 30 yrs
- 0.0%
- Est. flood insurance / yr
- $507 – $1,088
Fire risk 5/10 · Moderate
- Est. fire insurance / yr
- $916 – $1,700
Heat risk 6/10 · Moderate
- Hot days now (above 106°F)
- 7 days/yr
- Hot days in 30 yrs
- 19 days/yr
Wind risk 6/10 · Moderate
- Chance of severe wind over 30 yrs
- 65.0%
Air-quality risk 2/10 · Minimal
- Unhealthy air days now
- 1 days/yr
- Unhealthy air days in 30 yrs
- 1 days/yr
Risk factors via First Street. Map © Google.
Why this score? — see what drove the B+ grade
The composite is a weighted blend of 9 inputs, each scored 0–100. Each bar is that input's sub-score; the figure is the points it added to the 100-point composite (weight × sub-score).
- Cash flow +29.6/30.0
- ARV discount +15.0/15.0
- DSCR +10.0/10.0
- 1% rule +7.7/10.0
- Livability +4.0/5.0
- Rent growth +3.8/5.0
- Schools +3.0/10.0
- Condition / age +2.5/5.0
- Appreciation +0.0/10.0
$169,900
🖨 Deal sheet 📄 Offer letter ✓ Due diligence
Listing remarks
Investor Special – Cash Buyers Only Located at 626 Lee Road 17 in Auburn, this 4-bedroom, 2-bath home sits on approximately 1.43 acres at the end of a quiet dead-end street, offering a private wooded setting with strong potential for the right investor. The property is being sold strictly AS-IS and requires a full renovation. The home is not expected to qualify for traditional financing and is best suited for experienced investors, rehabbers, or cash buyers seeking a value-add opportunity. Extensive repairs and updates are needed throughout. Until May 1, the property had been continuously rented through Section 8 for approximately the past two decades at $1,600 per month, providing h
Key facts
- Attached carport
- Prime location
- 1.43 acre lot
Tags
Property features AI
Finance
- HOA & community: No association amenities
Exterior
- Parking: Attached carport (1 space)
- Utilities: Water available; Septic tank
- Home design: One-level residential home; Brick and vinyl siding construction
- Construction: Brick and vinyl siding exterior
- Exterior features: Chain link fencing; No pool
Interior
- Kitchen: Appliances: Other
- Bathrooms: Two full bathrooms (both on the main level)
- Heating & cooling: Central electric air conditioning; Ceiling fans; Forced air heating
- Interior features: Ceiling fan(s); Crawl space basement
- Laundry & utility: Washer hookup
Neighborhood map
What this means for you Summary
Snapshot
- This is a 4-bed/2.0-bath single-family listed at $170k.
Deal economics
- At list price, monthly cash flow is $615 ($7k/yr) — positive.
- The deal already cash-flows at list — no discount required.
- Meets the 1% rule at list price ($2k rent vs $170k).
- Recommended offer: $165k (3.0% below list) — sets the bar for market timing.
- Cap rate 10.6% vs local median 2.7% in Auburn — top-decile yield for the area; either an underpriced asset or a hidden risk that comps aren't pricing in. Stress-test before assuming the spread holds.
Location & tenants
- Location reads 80/100 on livability (#6 in AL, #1,842 nationally) — a professional / high-income tenant draw. Strengths: crime A+, amenities A+, health & safety A+; Watch: commute F.
- Lee County (rural): math 23% / reading 47% proficiency, ranked #40 of 129 in AL (top 31%) — families likely to look elsewhere, expect single-tenant / working-renter base with shorter leases.
- Zoned schools: Loachapoka Elementary School (math 12% / reading 27%, grade F, #467 of 627 statewide, top 76%, 334 students, 85% FRL) — zoned schools average 85% FRL vs 48% district-wide (37 pts higher); higher-poverty schools than district average — tighter screening recommended.
- Zoned-school proficiency averages 20% at this address vs 35% district-wide (-16 pts) — the specific schools serving this property underperform the Lee County average; the district grade overstates school quality for this exact location.
- Market conditions: Rents rising fast (+5.4%/yr); 899 active listings in the ZIP; 1,858 units permitted in Lee County in 2024 (113 in 5+ unit buildings).
- This rent runs 37% of the median local income ($70k/yr) — at the standard rent-burdened threshold; future hikes will face affordability resistance.
Forward outlook
- Local home prices are declining (-3.0%/yr); year-one equity from $1k of loan paydown is wiped out by about $5k of value loss. Plan a longer hold.
- Lee County population projected at +54% by 2050 — long-run rental-demand tailwind backs the buy-and-hold thesis.
- At projected returns (-3.0% appreciation + 5.4% rent growth), your $48k cash investment doubles in ~7 years — after that, you're playing with house money.
Negotiation context
- It's been on market 35 days — a 3% lower offer ($165k) is reasonable based on typical stale-listing flexibility.
- 2 sale attempts with the ask held roughly flat each time — persistent listings suggest the price (not the market) is what's stuck; bring a comps-based counter.
Risks & watch-outs
- Climate carrying-cost: major wind risk, 65% chance of damaging wind over 30y; moderate wildfire risk; extreme-heat days projected 7→19/yr by 2055 (HVAC capex compounding) — expect insurance premiums to compound above CPI over the hold.
Questions for the listing agent
- It's been on market 35 days. Have you received any prior offers? Is the seller open to a 3% concession, seller financing, or rate buy-down credit?
- Built in 1970 — when were the roof, HVAC, electrical panel, plumbing, and water heater last replaced?
- Is there a deadline driving the sale (1031 exchange, divorce, estate, relocation)? That informs how much negotiation room exists.
- Schools are A-rated — typically a magnet for longer-tenancy family renters. What's the average tenant stay here, and is there a school-zone premium baked into asking?
- What's the average days-on-market for RENTAL listings here right now (not sales)? A rising rental-DOM trend means longer vacancies and softer asking-rent achievability than the comps imply.
- What's the recent tenant-quality profile in this submarket — average credit score on applications, eviction rate, late-payment / NSF rate, and stable-employment percentage? A property-management company in the area should have these aggregated.
- How much new for-sale + rental construction is in the pipeline within 1–3 miles? Heavy new supply typically softens prices + rents 12–24 months out; constrained supply supports both.
Investment metrics
- 1% rule
- 1.27% ✓
- Cap rate
- 10.63%
- Cash-on-cash
- 15.50%
- DSCR
- 1.69
- GRM
- 6.5
CMA / ARV
- ARV (median comp)
- $278,413
- List price
- $169,900
- Delta
- -38.98%
- Verdict
- UNDERPRICED
- Comps
- 20 within 2.0 mi
Projected returns pro-forma
-3.0% appreciation · 5.36% rent growth · sell at horizon
- IRR
- 8.8%
- Equity multiple
- 1.35×
- Total profit
- $16,858
- Equity at exit
- $25,333
- IRR
- 19.8%
- Equity multiple
- 2.84×
- Total profit
- $87,668
- Equity at exit
- $14,690
Cash invested: $47,572 (down + closing). Projections, not guarantees.
Landlord ↔ Tenant lean methodology
- Overall (STATE)
- 90 Strongly Landlord-Friendly
- State Alabama
- 90 Strongly Landlord-Friendly · R+15
- County
- — inherits STATE
- City
- — inherits STATE
ZIP-level market 36830
- Rents YoY
- 5.4%
- Active inventory
- 899
- Price-to-rent
- 6.5×
Monthly cashflow live
- Estimated rent
- $2,164 medium interval (Pro) →
- Mortgage (P&I)
- −$891
- Tax from tax record
- −$133 /mo · $1,593/yr
- Insurance
- −$71
- HOA
- −$0
- Vacancy / Maint / Mgmt
- −$454
- Net cashflow
- $615
Break-even live
UW: 25.0% down · 7.5% · 30yr · 1.5% tax · 5.0% vac · 8.0% maint · 8.0% mgmt
Financing live
Cash to close
- Down payment
- $42,475
- Closing costs
- $5,097
- Reserves months
- —
- Total cash needed
- —
Loan-product check · same deal, 3 products live
Conventional
25% down · 7.5% · 30yr
- Down + closing
- —
- Monthly P&I
- —
- Monthly cashflow
- —
- DSCR
- —
- Eligible?
- —
Personal DTI + credit; lowest rate.
DSCR
20% down · 8.5% · 30yr
- Down + closing
- —
- Monthly P&I
- —
- Monthly cashflow
- —
- DSCR
- —
- Eligible?
- —
No personal income docs; deal must DSCR.
Hard money
10% down · 12.0% · 12mo
- Down + closing
- —
- Monthly P&I
- —
- Monthly cashflow
- —
- DSCR
- —
- Eligible?
- —
Short-term bridge; refi at stabilization.
Listing history 19 events
-
2026-06-19days on market $169,900 Active 35 DOM
-
2026-06-18days on market $169,900 Active 34 DOM
-
2026-06-17days on market $169,900 Active 33 DOM
-
2026-06-16days on market $169,900 Active 32 DOM
-
2026-06-15days on market $169,900 Active 31 DOM
-
2026-06-14days on market $169,900 Active 29 DOM
-
2026-06-13days on market $169,900 Active 28 DOM
-
2026-06-10days on market $169,900 Active 26 DOM
-
2026-06-09days on market $169,900 Active 25 DOM
-
2026-06-08days on market $169,900 Active 24 DOM
-
2026-06-07days on market $169,900 Active 23 DOM
-
2026-06-05days on market $169,900 Active 20 DOM
-
2026-06-03days on market $169,900 Active 19 DOM
-
2026-06-02days on market $169,900 Active 18 DOM
-
2026-06-01days on market $169,900 Active 17 DOM
-
2026-05-31days on market $169,900 Active 16 DOM
-
2026-05-30days on market $169,900 Active 15 DOM
-
2026-05-10status Pending 859-char remark
-
2026-05-04$169,900 Active 859-char remark
ⓘ Source: listings_history table (triggers on properties + properties_extension) + one-shot
backfill from property_details.listing_events for pre-trigger history.
Tax reassessment forecast AL · Resets to sale price
- Current annual tax
- $1,593 · $133/mo
- Projected year-2 tax
- $1,593 · $133/mo
- Expected delta
- $0/yr ($0/mo · -0.0%)
ⓘ Screening estimate from a state-policy table — verify with the county assessor before closing.
Climate risk First Street
- Flood 1/10 Low FEMA zone X (unshaded) · 0% chance over 30 yrs
- Wildfire 5/10 Major
- Heat 6/10 Major 7 d/yr ≥106°F today · 19 d/yr by 30 yrs out
- Wind 6/10 Major 65% chance of damaging wind over 30 yrs
- Air quality 2/10 Low 1 unhealthy d/yr today · 1 by 30 yrs out
Nearby sold comps map
Loading sold comps map…
Walkable amenities ~0.75 mi
Loading nearby amenities…
Taxation est. · year 1
- Rental income
- $25,962
- − Mortgage interest
- −$9,517
- − Property taxes
- −$1,593
- − Insurance
- −$850
- − Repairs & maintenance
- −$2,077
- − Management
- −$2,077
- − Depreciation
- −$4,943
- Taxable income
- $4,906
- Est. tax owed @ 24.0%
- −$1,177
- After-tax cash flow
- $6,198/yr
For passive investors: Depreciation is non-cash, so a rental often shows a tax loss while cash-flowing — sheltering income. Rental losses are passive: they offset passive income freely, and up to $25,000/yr can offset ordinary (W-2) income if you actively participate and your MAGI is under $100k (phasing out to $0 by $150k); unused losses carry forward. On sale, claimed depreciation is recaptured at up to 25%, and gains may owe capital-gains tax (a 1031 exchange can defer both). Figures are a year-1 estimate at your 24.0% rate — not tax advice; consult a CPA.
Schools (NCES district)
- District
- Lee County
- NCES district ID
- 0102070
- Math proficiency
- 23% ▼ -27.00%
- Reading proficiency
- 47% ▬ 0.00%
- Median HH income
- $47,786
- Composite
- 30.04/100
- National rank
- #6355
- State rank
- #40 of 129 in AL
Livability — Auburn
- Score
- 80/100
- State rank
- #6
- US rank
- #1842
Category grades
Schools grade is shown separately in the Schools card above.
Census & demographics
- County
- Lee County · 144,175 people
- City population
- 80,251
- Metro
- Auburn-Opelika, AL
- Population (ZIP)
- 49,292
- Household income
- $70,188
- Rent vs Own
- Severe rent burden
- 2961.0
Population outlook (Lee County) Hauer SSP2
- Today (2025)
- 196,440 people
- By 2030
- 217,417 · +10.7%
- By 2040
- 259,467 · +32.1%
- By 2050
- 301,557 · +53.5%
- By 2075
- 402,186 · +104.7%
- By 2100
- 474,503 · +141.6%
Race, ethnicity, and origin ACS 2023
- Neighborhood character
- Predominantly White (70%)
- Race & ethnicity
- White 70% Black 14% Asian 10% Hispanic / Latino 4% Two or more races 3%
- Common ancestry
- Slovak 4% Italian 3% Serbian 2%
- Foreign-born
- 11% · South Korea, Canada, China
- Languages at home
- 87% English-only · Korean 4% Spanish 3% Chinese 2%
Political lean MEDSL · Lee
- 2024 margin
- Strong R (+27.8) · D 35.5% · R 63.3% · Other 1.2%
- 2008→2024 swing
- -8.1pp toward R · 2008: -19.8pp · 2024: -27.8pp
- All cycles
- 2024: R+27.8 2020: R+20.1 2016: R+23.1 2012: R+19.9 2008: R+19.8
Not yet ingested
- Civics
- —
Market trends
- HPI YoY
- ▼ -156.53%
- Current HPI
- 270.6646
- Rent YoY
- ▲ 5.36%
- Metro
- Auburn-Opelika, AL
- State GDP YoY
- ▲ 2.94%
- F500 in state
- 4
Industry mix (Fortune 500 HQ in AL)
| Industry | F500 HQs | Revenue |
|---|---|---|
| Financial Services | 1 | $8B |
|
||
| Healthcare | 1 | $5B |
|
||
Price history
3 events — show timeline
- 2026-05-21 Relisted — LCMLS
- 2026-05-10 Pending — LCMLS
- 2026-05-04 Listed $169,900 LCMLS
Property tax history
+4.2%/yrLatest (2025): $1,593 · +6.8% YoY. Source: county tax records.
Cash-flow waterfall
monthlySold comps — $/sqft
last 12 mo · ≤1 miLoading sold comps…