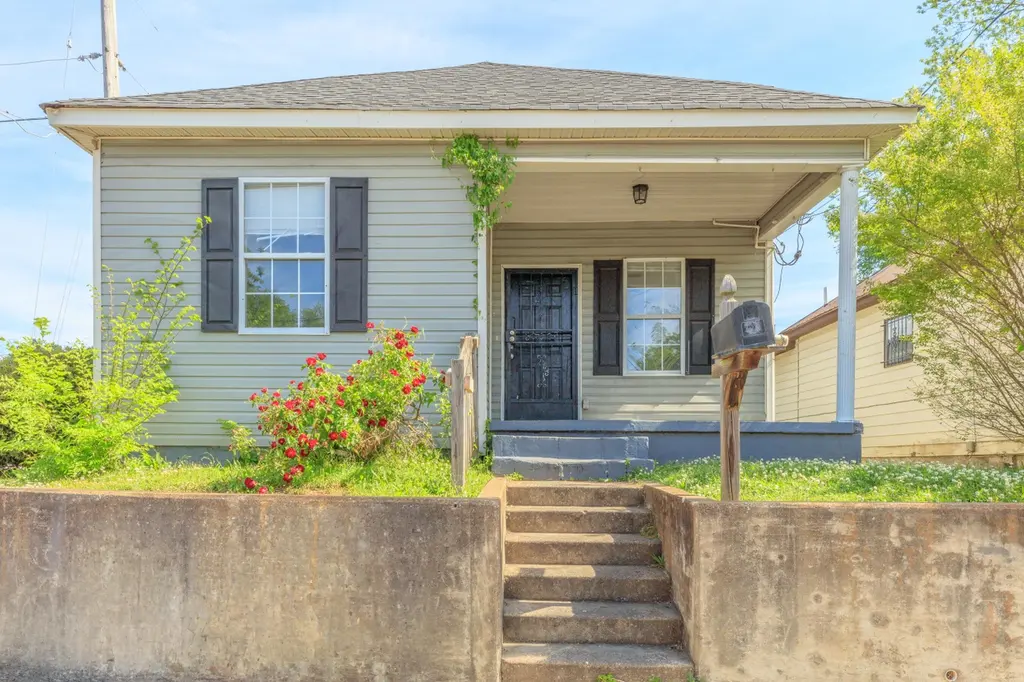
1701 Citico Ave · Chattanooga, TN
Flood risk 10/10 · Severe
- FEMA flood zone
- X (shaded)
- Chance of flooding over 30 yrs
- 0.99%
- Est. flood insurance / yr
- $507 – $1,088
Fire risk 1/10 · Minimal
- Est. fire insurance / yr
- $949 – $1,763
Heat risk 6/10 · Moderate
- Hot days now (above 104°F)
- 7 days/yr
- Hot days in 30 yrs
- 19 days/yr
Wind risk 4/10 · Minor
- Chance of severe wind over 30 yrs
- 11.0%
Air-quality risk 3/10 · Minor
- Unhealthy air days now
- 2 days/yr
- Unhealthy air days in 30 yrs
- 2 days/yr
Risk factors via First Street. Map © Google.
Why this score? — see what drove the B grade
The composite is a weighted blend of 9 inputs, each scored 0–100. Each bar is that input's sub-score; the figure is the points it added to the 100-point composite (weight × sub-score).
- Cash flow +30.0/30.0
- ARV discount +13.8/15.0
- DSCR +10.0/10.0
- 1% rule +7.7/10.0
- Livability +3.9/5.0
- Schools +2.7/10.0
- Rent growth +2.5/5.0
- Condition / age +2.5/5.0
- Appreciation +0.0/10.0
$109,900
🖨 Deal sheet (PDF) 📄 Offer letter ✓ Due diligence
Listing remarks
PROVEN INCOME PROPERTY. This income-producing asset is located near a major traffic artery with quick access to highways, UTC, hospitals, and downtown Chattanooga. Always a quick-to-lease rental. Most recent tenant paid $1,350 rent. PORTFOLIO SALE: Seller has several additional income properties for sale in Chattanooga and will offer a DISCOUNT in a package deal.
Key facts
- 2,953 sq ft lot
- Built 1950
- Listed 40 days
Tags
Property features AI
Exterior
- Parking: On-street parking
- Utilities: Public water; Public sewer; Cable available
- Home design: Single-family residence; Residential property
- Construction: Frame construction with vinyl siding; Brick and stone foundation; Shingle roof (see remarks)
- Exterior features: Corner lot; No additional exterior features listed
Interior
- Kitchen: Refrigerator; Electric range
- Bathrooms: 2 full bathrooms
- Heating & cooling: Central heating; Central air conditioning
- Interior features: Refrigerator; Electric range
- Laundry & utility: Washer hookup; Electric dryer hookup
Neighborhood map
What this means for you Summary
Snapshot
- This is a 3-bed/2.0-bath single-family listed at $110k.
Deal economics
- At list price, monthly cash flow is $394 ($5k/yr) — positive.
- The deal already cash-flows at list — no discount required.
- Meets the 1% rule at list price ($1k rent vs $110k).
- Recommended offer: $107k (3.0% below list) — sets the bar for market timing.
- Cap rate 11.3% vs local median 3.4% in Chattanooga — top-decile yield for the area; either an underpriced asset or a hidden risk that comps aren't pricing in. Stress-test before assuming the spread holds.
Location & tenants
- Location reads 78/100 on livability (#3 in TN, #2,582 nationally) — a middle-class / working-renter tenant base. Strengths: amenities A+, commute A+, cost of living A+; Watch: employment D+, crime F.
- Hamilton County (urban): math 31% / reading 31% proficiency, ranked #42 of 139 in TN (top 30%) — families likely to look elsewhere, expect single-tenant / working-renter base with shorter leases.
- Zoned schools: Orchard Knob Elementary (math 12% / reading 2%, grade F, #863 of 952 statewide, top 92%, 477 students, 0% FRL); Orchard Knob Middle (math 5% / reading 6%, grade F, #291 of 333 statewide, top 88%, 334 students, 0% FRL); Brainerd High School (math 2% / reading 12%, grade F, #294 of 332 statewide, top 91%, 635 students, 0% FRL) — zoned schools average 0% FRL vs 52% district-wide (52 pts lower); this property's tenant base skews higher-income than the district average.
- Zoned-school proficiency averages 7% at this address vs 31% district-wide (-24 pts) — the specific schools serving this property underperform the Hamilton County average; the district grade overstates school quality for this exact location.
- Market conditions: Rents flat; 167 active listings in the ZIP; 32 comparable units currently listed for rent nearby; rentals at typical pace (median 24d on market — plan ~3-4 weeks tenant-placement turnaround); 2,133 units permitted in Hamilton County in 2024 (405 in 5+ unit buildings).
Forward outlook
- Local home prices are declining (-3.0%/yr); year-one equity from $760 of loan paydown is wiped out by about $3k of value loss. Plan a longer hold.
- Hamilton County population projected at +23% by 2050 — long-run rental-demand tailwind backs the buy-and-hold thesis.
Negotiation context
- It's been on market 40 days — a 3% lower offer ($107k) is reasonable based on typical stale-listing flexibility.
- 4 sale attempts since 26y ago; this cycle's ask has dropped $30k (21%) from the opening price — seller is motivated, your offer sets the floor, not the list.
Risks & watch-outs
- Watch-outs: flood insurance adds $66/mo; built in 1950 — expect roof / HVAC / electrical / plumbing capex.
- Climate carrying-cost: severe flood risk; extreme-heat days projected 7→19/yr by 2055 (HVAC capex compounding) — expect insurance premiums to compound above CPI over the hold.
Questions for the listing agent
- It's been on market 40 days. Have you received any prior offers? Is the seller open to a 3% concession, seller financing, or rate buy-down credit?
- Built in 1950 — when were the roof, HVAC, electrical panel, plumbing, and water heater last replaced?
- What's the actual annual flood-insurance premium (NFIP or private), and is the property in a SFHA with mandatory coverage?
- Is there a deadline driving the sale (1031 exchange, divorce, estate, relocation)? That informs how much negotiation room exists.
- Schools are F-rated, which usually means shorter tenancies and higher turnover. Who's the typical renter profile here, and what's been the actual vacancy rate?
- Crime grade is F in this area — have there been break-ins, vandalism, or insurance claims at this property in the last 3 years? What carrier currently insures it and at what premium?
- What's the average days-on-market for RENTAL listings here right now (not sales)? A rising rental-DOM trend means longer vacancies and softer asking-rent achievability than the comps imply.
- What's the recent tenant-quality profile in this submarket — average credit score on applications, eviction rate, late-payment / NSF rate, and stable-employment percentage? A property-management company in the area should have these aggregated.
- How much new for-sale + rental construction is in the pipeline within 1–3 miles? Heavy new supply typically softens prices + rents 12–24 months out; constrained supply supports both.
Investment metrics
- 1% rule
- 1.27% ✓
- Cap rate
- 11.32%
- Cash-on-cash
- 17.94%
- DSCR
- 1.80
- GRM
- 6.5
CMA / ARV
- ARV (on-the-fly)
- $127,680
- Comps found
- 12
Show comp detail 12 sales within ~0.75 mi
| Address | Dist | Beds/Ba | Sqft | Sold | Price | $/sf | Match |
|---|---|---|---|---|---|---|---|
| 1714 Citico Ave | 0.08mi | 3/2.0 | 972 (+7%) | 11mo | $195,000 | $201 | 76 |
| 1101 N Orchard Knob Ave | 0.40mi | 2/1.0 (-1) | 900 (-1%) | 20mo | $203,000 | $226 | 54 |
| 1815 Carson Ave | 0.17mi | 3/1.0 | 1,042 (+14%) | 13mo | $46,500 | $45 | 53 |
| 904 Arlington Ave | 0.59mi | 2/1.0 (-1) | 951 (+4%) | 4mo | $32,000 | $34 | 53 |
| 2011 Cooley St | 0.48mi | 2/1.0 (-1) | 884 (-3%) | 15mo | $80,000 | $90 | 51 |
| 1710 Portland St | 0.26mi | 3/1.5 | 1,026 (+12%) | 17mo | $140,000 | $136 | 51 |
| 1814 Wilcox Blvd | 0.61mi | 2/1.0 (-1) | 893 (-2%) | 16mo | $125,000 | $140 | 45 |
| 1906 Garfield St | 0.40mi | 3/2.0 | 1,035 (+14%) | 18mo | $254,000 | $245 | 43 |
| 2104 Blackford St | 0.48mi | 2/1.0 (-1) | 1,044 (+14%) | 15mo | $175,000 | $168 | 32 |
| 1301 Arlington Ave | 0.72mi | 2/1.0 (-1) | 825 (-10%) | 11mo | $53,500 | $65 | 32 |
| 41 Maude St | 0.74mi | 2/1.0 (-1) | 825 (-10%) | 16mo | $252,500 | $306 | 27 |
| 1500 Bradt St | 0.75mi | 2/1.0 (-1) | 780 (-14%) | 11mo | $89,400 | $115 | 23 |
Match score weights: distance 35% · size 25% · config 20% · recency 20%. Top-matched comps best support the ARV.
Projected returns pro-forma
-3.0% appreciation · 0.03% rent growth · sell at horizon
- IRR
- 2.8%
- Equity multiple
- 1.10×
- Total profit
- $3,187
- Equity at exit
- $16,386
- IRR
- 9.4%
- Equity multiple
- 1.63×
- Total profit
- $19,311
- Equity at exit
- $9,502
Cash invested: $30,772 (down + closing). Projections, not guarantees.
Landlord ↔ Tenant lean methodology
- Overall (STATE)
- 87 Strongly Landlord-Friendly
- State Tennessee
- 87 Strongly Landlord-Friendly · R+13
- County
- — inherits STATE
- City
- — inherits STATE
ZIP-level market 37404
- Home prices YoY
- -30.6%
- Rents YoY
- 0.0%
- Active inventory
- 167
- Price-to-rent
- 6.5×
Monthly cashflow live
- Estimated rent
- $1,400 high interval (Pro) →
- Mortgage (P&I)
- −$576
- Tax from tax record
- −$24 /mo · $282/yr
- Insurance
- −$46
- Flood insurance flood zone
- −$66 /mo · $798/yr
- HOA
- −$0
- Vacancy / Maint / Mgmt
- −$294
- Net cashflow
- $394
Break-even live
Sensitivity live
| Price | -10% $456 | -5% $425 | +0% $394 | +5% $362 | +10% $331 |
|---|---|---|---|---|---|
| Rent | -10% $283 | -5% $338 | +0% $394 | +5% $449 | +10% $504 |
| Rate | -1.0pp $449 | -0.5pp $421 | base $394 | +0.5pp $365 | +1.0pp $336 |
UW: 25.0% down · 7.5% · 30yr · 1.5% tax · 5.0% vac · 8.0% maint · 8.0% mgmt
Financing live
Cash to close
- Down payment
- $27,475
- Closing costs
- $3,297
- Reserves months
- —
- Total cash needed
- —
Loan-product check · same deal, 3 products live
Conventional
25% down · 7.5% · 30yr
- Down + closing
- —
- Monthly P&I
- —
- Monthly cashflow
- —
- DSCR
- —
- Eligible?
- —
Personal DTI + credit; lowest rate.
DSCR
20% down · 8.5% · 30yr
- Down + closing
- —
- Monthly P&I
- —
- Monthly cashflow
- —
- DSCR
- —
- Eligible?
- —
No personal income docs; deal must DSCR.
Hard money
10% down · 12.0% · 12mo
- Down + closing
- —
- Monthly P&I
- —
- Monthly cashflow
- —
- DSCR
- —
- Eligible?
- —
Short-term bridge; refi at stabilization.
Rent comps 32 comps
| Address | Beds | Baths | Sqft | Rent | $/sqft | DOM | Units | Dist |
|---|---|---|---|---|---|---|---|---|
| 1800 Carson Ave Chattanooga, TN | 2.0 | 1.0 | 700 | $950 | $1.36 | 14d | 1 | 0.12mi |
| 709 N Holly St Chattanooga, TN | 3.0 | 2.0 | 1092 | $1,850 | $1.69 | 14d | 1 | 0.19mi |
| 1714 Portland St Unit C Chattanooga, TN | 2.0 | 1.0 | 700 | $1,125 | $1.61 | 24d | 1 | 0.26mi |
| 1001 N Hickory St Unit 2 Chattanooga, TN | 2.0 | 1.0 | 776 | $875 | $1.13 | 24d | 1 | 0.28mi |
| 521 N Hawthorne St Unit A Chattanooga, TN | 2.0 | 1.0 | 725 | $850 | $1.17 | 24d | 1 | 0.29mi |
| 1296 Preston St Chattanooga, TN | 2.0 | 1.0 | 850 | $950 | $1.12 | 24d | 1 | 0.30mi |
| 2006 Milne St Chattanooga, TN | 2.0 | 1.0 | 672 | $995 | $1.48 | 24d | 1 | 0.32mi |
| 2011 Milne St Unit b Chattanooga, TN | 3.0 | 1.0 | 976 | $1,345 | $1.38 | 14d | 1 | 0.35mi |
| 2105 Rawlings St Chattanooga, TN | 3.0 | 1.0 | 1064 | $1,300 | $1.22 | 14d | 1 | 0.39mi |
| 2004 Garfield St Unit 102 Chattanooga, TN | 2.0 | 1.0 | 700 | $1,400 | $2.00 | 24d | 1 | 0.44mi |
| 1226 Sholar Ave Chattanooga, TN | 2.0 | 1.0 | 799 | $1,099 | $1.38 | 14d | 1 | 0.45mi |
| 1228 Sholar Ave Chattanooga, TN | 2.0 | 1.0 | 799 | $1,199 | $1.50 | 24d | 1 | 0.46mi |
| 1301 N Orchard Knob Ave Chattanooga, TN | 2.0 | 1.0 | 864 | $1,095 | $1.27 | 24d | 1 | 0.53mi |
| 2305 Citico Ave Unit A Chattanooga, TN | 2.0 | 1.0 | 748 | $1,095 | $1.46 | 14d | 1 | 0.56mi |
| 1310 Roanoke Ave Chattanooga, TN | 2.0 | 1.0 | 792 | $1,350 | $1.70 | 24d | 1 | 0.60mi |
| 1409 Bradt St Chattanooga, TN | 3.0 | 1.0 | 960 | $1,275 | $1.33 | 24d | 1 | 0.73mi |
| 950 Riverside Dr Chattanooga, TN | 2.0 | 1.0–2.0 | 908 | $2,309 | $2.54 | 14d | 22 | 0.73mi |
| 1237 Wheeler Ave Unit B Chattanooga, TN | 2.0 | 1.0 | 845 | $1,125 | $1.33 | 24d | 1 | 0.76mi |
| 2111 Oak St Chattanooga, TN | 2.0 | 2.0 | 1100 | $1,595 | $1.45 | 14d | 1 | 0.80mi |
| 2009 McCallie Ave Chattanooga, TN | 2.0 | 2.0 | 1000 | $1,430 | $1.43 | 14d | 1 | 0.80mi |
| 1754 Ocoee St Chattanooga, TN | 3.0 | 1.5 | 1050 | $1,250 | $1.19 | 14d | 1 | 0.83mi |
| 1322 District Ln Chattanooga, TN | 2.0 | 1.0–2.0 | 913 | $2,324 | $2.55 | 14d | 25 | 0.84mi |
| 2113 Ocoee St Unit 2113 Chattanooga, TN | 2.0 | 1.0 | 780 | $950 | $1.22 | 24d | 1 | 0.93mi |
| 508 S Highland Park Ave Unit 104 Chattanooga, TN | 2.0 | 1.0 | 750 | $1,050 | $1.40 | 24d | 1 | 0.94mi |
| 2003 Bailey Ave Unit 2009 304 Chattanooga, TN | 2.0 | 1.0 | 750 | $1,500 | $2.00 | 24d | 1 | 0.97mi |
| 2709 Citico Ave Chattanooga, TN | 2.0–3.0 | 1.0 | 1038 | $1,400 | $1.35 | 24d | 1 | 0.98mi |
| 949 Fortwood St Chattanooga, TN | 1.0–2.0 | 1.0 | 700 | $1,700 | $2.43 | 14d | 7 | 1.00mi |
| 1707 Arlington Ave Unit B Chattanooga, TN | 2.0 | 1.0 | 760 | $1,000 | $1.32 | 24d | 1 | 1.01mi |
| 513 Central Ave Chattanooga, TN | 3.0 | 2.0 | 1000 | $1,800 | $1.80 | 24d | 1 | 1.01mi |
| 955 E 5th St Chattanooga, TN | 2.0 | 1.0 | 776 | $1,250 | $1.61 | 24d | 1 | 1.12mi |
| 912 Oak St Apt 1 Chattanooga, TN | 2.0 | 2.0 | 1000 | $1,400 | $1.40 | 24d | 1 | 1.15mi |
| 1812 E 13th St Unit B Chattanooga, TN | 2.0 | 1.0 | 800 | $1,065 | $1.33 | 24d | 1 | 1.41mi |
Listing history 19 events
-
2026-05-06status Pending
-
2026-05-01price $109,900
-
2026-04-16price $129,900
-
2026-03-27$139,900 Active
-
2025-10-02price $139,900
-
2025-08-21price $148,900
-
2025-07-28price $149,000
-
2025-05-28price $159,000
-
2025-05-16price $162,000
-
2025-04-25soldstatus $1,520,000
-
2024-05-23historical $1,350
-
2024-05-08$1,350
-
2022-03-16price $975
-
2017-06-15soldstatus $30,000
-
2007-03-06soldstatus $60,000
-
2001-09-21$65,000
-
2001-04-09soldstatus $15,000
-
2001-04-07soldstatus $15,000
-
2000-05-23$19,000
ⓘ Source: listings_history table (triggers on properties + properties_extension) + one-shot
backfill from property_details.listing_events for pre-trigger history.
Tax reassessment forecast TN · Resets to sale price
- Current annual tax
- $282 · $24/mo
- Projected year-2 tax
- $780 · $65/mo
- Expected delta
- +$498/yr (+$41/mo · 176.4%)
ⓘ Screening estimate from a state-policy table — verify with the county assessor before closing.
Climate risk First Street
- Flood 10/10 Extreme FEMA zone X (shaded) · 99% chance over 30 yrs
- Wildfire 1/10 Low
- Heat 6/10 Major 7 d/yr ≥104°F today · 19 d/yr by 30 yrs out
- Wind 4/10 Moderate 11% chance of damaging wind over 30 yrs
- Air quality 3/10 Moderate 2 unhealthy d/yr today · 2 by 30 yrs out
Nearby sold comps map
Loading sold comps map…
Walkable amenities ~0.75 mi
Loading nearby amenities…
Taxation est. · year 1
- Rental income
- $16,795
- − Mortgage interest
- −$6,156
- − Property taxes
- −$282
- − Insurance
- −$1,347
- − Repairs & maintenance
- −$1,344
- − Management
- −$1,344
- − Depreciation
- −$3,197
- Taxable income
- $3,125
- Est. tax owed @ 24.0%
- −$750
- After-tax cash flow
- $3,973/yr
For passive investors: Depreciation is non-cash, so a rental often shows a tax loss while cash-flowing — sheltering income. Rental losses are passive: they offset passive income freely, and up to $25,000/yr can offset ordinary (W-2) income if you actively participate and your MAGI is under $100k (phasing out to $0 by $150k); unused losses carry forward. On sale, claimed depreciation is recaptured at up to 25%, and gains may owe capital-gains tax (a 1031 exchange can defer both). Figures are a year-1 estimate at your 24.0% rate — not tax advice; consult a CPA.
Schools (NCES district)
- District
- Hamilton County
- NCES district ID
- 4701590
- Math proficiency
- 31% ▼ -10.00%
- Reading proficiency
- 31% ▼ -3.00%
- Median HH income
- $47,456
- Composite
- 26.8/100
- National rank
- #7122
- State rank
- #42 of 139 in TN
Livability — Chattanooga
- Score
- 78/100
- State rank
- #3
- US rank
- #2582
Category grades
Schools grade is shown separately in the Schools card above.
Census & demographics
- Census place
- Chattanooga, TN
- County
- Hamilton County · 312,777 people
- City population
- 131,999
- Metro
- Chattanooga, TN-GA
- Population (ZIP)
- 14,737
- Household income
- $56,637
- Rent vs Own
- Severe rent burden
- 486.0
Population outlook (Hamilton County) Hauer SSP2
- Today (2025)
- 393,784 people
- By 2030
- 412,983 · +4.9%
- By 2040
- 449,502 · +14.1%
- By 2050
- 484,341 · +23.0%
- By 2075
- 565,746 · +43.7%
- By 2100
- 618,394 · +57.0%
Race, ethnicity, and origin ACS 2023
- Neighborhood character
- Diverse neighborhood (Simpson 0.67)
- Race & ethnicity
- Black 38% White 38% Hispanic / Latino 21% Two or more races 11%
- Hispanic origin (detail)
- Mexican 3%
- Common ancestry
- Slovak 3% Romanian 1% Lithuanian 1%
- Foreign-born
- 11% · Canada
- Languages at home
- 81% English-only · Spanish 18%
Political lean MEDSL · Hamilton
- 2024 margin
- R (+13.1) · D 42.7% · R 55.7% · Other 1.6%
- 2008→2024 swing
- -1.2pp toward R · 2008: -11.8pp · 2024: -13.1pp
- All cycles
- 2024: R+13.1 2020: R+9.7 2016: R+16.6 2012: R+14.8 2008: R+11.8
Not yet ingested
- Civics
- —
Market trends
- HPI YoY
- ▼ -139.43%
- Current HPI
- 315.8539
- Rent YoY
- ▬ 0.03%
- Metro
- Chattanooga, TN-GA
- State GDP YoY
- ▲ 2.78%
- F500 in state
- 22
Industry mix (Fortune 500 HQ in TN)
| Industry | F500 HQs | Revenue |
|---|---|---|
| Healthcare | 3 | $91B |
|
||
| Retail | 3 | $72B |
|
||
| Transportation / Logistics | 1 | $88B |
|
||
| Paper / Packaging | 1 | $19B |
|
||
| Insurance | 1 | $13B |
|
||
| Energy | 1 | $12B |
|
||
Price history
+478.4% since first listed19 events — show timeline
- 2026-05-06 Pending — GCAR
- 2026-05-01 Price Changed $109,900 GCAR
- 2026-04-16 Price Changed $129,900 GCAR
- 2026-03-27 Listed $139,900 GCAR
- 2025-10-02 Price Changed $139,900 GCAR
- 2025-08-21 Price Changed $148,900 GCAR
- 2025-07-28 Price Changed $149,000 GCAR
- 2025-05-28 Price Changed $159,000 GCAR
- 2025-05-16 Price Changed $162,000 GCAR
- 2025-04-25 Sold (Public Records) $1,520,000 Public Records
- 2024-05-23 Rental Removed $1,350 APPFOLIO
- 2024-05-08 Listed for Rent $1,350 APPFOLIO
- 2022-03-16 Price Changed $975 RENT.
- 2017-06-15 Sold (MLS) $30,000 GCAR
- 2007-03-06 Sold (Public Records) $60,000 Public Records
- 2001-09-21 Listed $65,000 RCAOR
- 2001-04-09 Sold (MLS) $15,000 GCAR
- 2001-04-07 Sold (Public Records) $15,000 Public Records
- 2000-05-23 Listed $19,000 GCAR
Property tax history
+0.6%/yrLatest (2025): $282 · +36.8% YoY. Source: county tax records.
Cash-flow waterfall
monthlySold comps — $/sqft
last 12 mo · ≤1 miLoading sold comps…