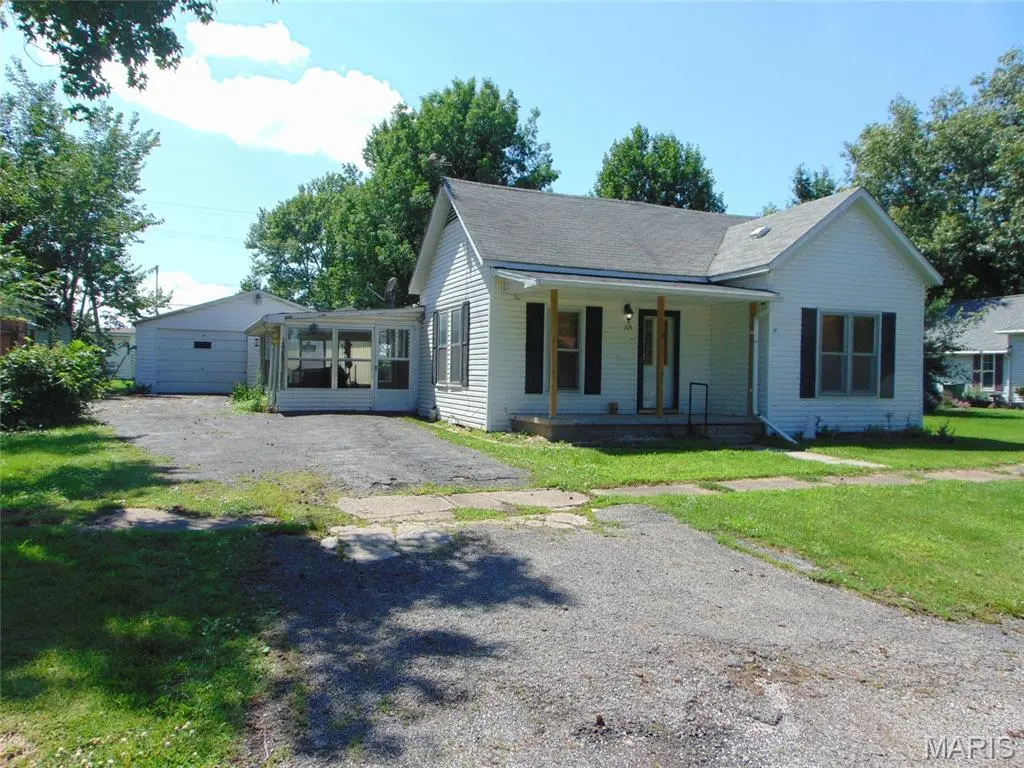
105 N 6th St · Elkville, IL
Flood risk 1/10 · Minimal
- FEMA flood zone
- X (unshaded)
- Chance of flooding over 30 yrs
- 0.0%
- Est. flood insurance / yr
- $507 – $1,088
Fire risk 1/10 · Minimal
- Est. fire insurance / yr
- $804 – $1,492
Heat risk 5/10 · Moderate
- Hot days now (above 107°F)
- 7 days/yr
- Hot days in 30 yrs
- 21 days/yr
Wind risk 2/10 · Minimal
- Chance of severe wind over 30 yrs
- 3.0%
Air-quality risk 1/10 · Minimal
- Unhealthy air days now
- 0 days/yr
- Unhealthy air days in 30 yrs
- 0 days/yr
Risk factors via First Street. Map © Google.
Why this score? — see what drove the B- grade
The composite is a weighted blend of 9 inputs, each scored 0–100. Each bar is that input's sub-score; the figure is the points it added to the 100-point composite (weight × sub-score).
- Cash flow +28.4/30.0
- DSCR +10.0/10.0
- ARV discount +7.5/15.0
- 1% rule +6.7/10.0
- Appreciation +5.3/10.0
- Schools +3.2/10.0
- Livability +2.9/5.0
- Rent growth +2.5/5.0
- Condition / age +2.5/5.0
$85,000
🖨 Deal sheet 📄 Offer letter ✓ Due diligence
Listing remarks
This is a nicely kept two bedroom home with an updated bathroom. The kitchen and dining room have an open floor with a separate laundry area and there is also a large living room for you to relax. The driveway is asphalt to the garage door and there is additional car storage with the detached carport for your car or camper in the backyard with alley access. Don't forget you can enjoy the afternoons and evenings in the enclosed porch too.
Key facts
- Asphalt driveway
- Detached carport
- Large living room
Tags
Property features AI
Finance
- Financial info: Lease not considered
Exterior
- Parking: Total parking for 3 vehicles; 1-car garage (24 x 24); 2-space carport; Asphalt driveway; Carport(s) listed as additional structure
- Security: Smoke detector(s)
- Utilities: Public water; Public sewer; Single-phase electric; Cable available; Electricity connected; Natural gas available and connected; Sewer connected; Water connected
- Home design: Single-family residence; One story; Private ownership; House structure
- Construction: Frame construction with vinyl siding; Asbestos shingle roof
- Exterior features: Covered, enclosed front porch; Exterior storage; Interior lot; Chip-and-seal road frontage; City street access; Sidewalks and street lights in the community; No pool; Storm door(s)
Interior
- Kitchen: Dishwasher; Range; Refrigerator
- Bedrooms: 2 bedrooms on the main level
- Flooring: Carpet; Vinyl
- Bathrooms: 1 full bathroom (main level)
- Heating & cooling: Forced air heating (natural gas); Central air conditioning
- Interior features: Kitchen/Dining room combo; Main-level laundry; No basement; Smoke detectors installed
- Laundry & utility: Main-level laundry room
Neighborhood map
What this means for you Summary
Snapshot
- This is a 2-bed/1.0-bath single-family listed at $85k.
Deal economics
- At list price, monthly cash flow is $275 ($3k/yr) — positive.
- The deal already cash-flows at list — no discount required.
- Meets the 1% rule at list price ($995 rent vs $85k).
- Recommended offer: $84k (1.5% below list) — sets the bar for market timing.
Location & tenants
- Location reads 58/100 on livability (#1,123 in IL) — a working-class tenant base; expect higher turnover. Strengths: cost of living A+, housing A+; Watch: employment D, crime D-, amenities F.
- Elverado CUSD 196 (rural): math 25% / reading 45% proficiency, ranked #418 of 919 in IL (top 46%) — families likely to look elsewhere, expect single-tenant / working-renter base with shorter leases.
- Zoned schools: Elverado High School (math 10% / reading 10%, grade F, #528 of 693 statewide, top 82%, 112 students, 0% FRL) — zoned schools average 0% FRL vs 54% district-wide (54 pts lower); this property's tenant base skews higher-income than the district average.
- Zoned-school proficiency averages 10% at this address vs 35% district-wide (-25 pts) — the specific schools serving this property underperform the Elverado CUSD 196 average; the district grade overstates school quality for this exact location.
- Market conditions: 12 active listings in the ZIP; 5 units permitted in Jackson County in 2024 (0 in 5+ unit buildings).
Forward outlook
- In year one you build about $1k of equity ($588 loan paydown + $446 appreciation (0.5% local appreciation)).
- At projected returns (0.5% appreciation + 3.0% rent growth), your $24k cash investment doubles in ~5 years — after that, you're playing with house money.
Negotiation context
- It's been on market 16 days — a 2% lower offer ($84k) is reasonable based on typical stale-listing flexibility.
Risks & watch-outs
- Watch-outs: built in 1937 — expect roof / HVAC / electrical / plumbing capex.
- Climate carrying-cost: extreme-heat days projected 7→21/yr by 2055 (HVAC capex compounding) — expect insurance premiums to compound above CPI over the hold.
Questions for the listing agent
- Built in 1937 — when were the roof, HVAC, electrical panel, plumbing, and water heater last replaced?
- Is there a deadline driving the sale (1031 exchange, divorce, estate, relocation)? That informs how much negotiation room exists.
- Schools are F-rated, which usually means shorter tenancies and higher turnover. Who's the typical renter profile here, and what's been the actual vacancy rate?
- Crime grade is D in this area — have there been break-ins, vandalism, or insurance claims at this property in the last 3 years? What carrier currently insures it and at what premium?
- What's the average days-on-market for RENTAL listings here right now (not sales)? A rising rental-DOM trend means longer vacancies and softer asking-rent achievability than the comps imply.
- What's the recent tenant-quality profile in this submarket — average credit score on applications, eviction rate, late-payment / NSF rate, and stable-employment percentage? A property-management company in the area should have these aggregated.
- How much new for-sale + rental construction is in the pipeline within 1–3 miles? Heavy new supply typically softens prices + rents 12–24 months out; constrained supply supports both.
Investment metrics
- 1% rule
- 1.17% ✓
- Cap rate
- 10.18%
- Cash-on-cash
- 13.87%
- DSCR
- 1.62
- GRM
- 7.1
CMA / ARV
- ARV (on-the-fly)
- $38,049
- Comps found
- 6
Show comp detail 6 sales within ~0.75 mi
| Address | Dist | Beds/Ba | Sqft | Sold | Price | $/sf | Match |
|---|---|---|---|---|---|---|---|
| 503 S 6th St | 0.42mi | 2/1.0 | 1,126 (-2%) | 1mo | $88,000 | $78 | 76 |
| 106 S 1st St | 0.28mi | 3/1.0 (+1) | 1,200 (+4%) | 3mo | $10,000 | $8 | 72 |
| 107 W Main St | 0.25mi | 2/1.0 | 1,051 (-9%) | 2mo | $73,160 | $70 | 72 |
| 205 N 5th St | 0.12mi | 3/2.0 (+1) | 1,200 (+4%) | 13mo | $19,800 | $17 | 68 |
| 310 N 4th St | 0.24mi | 3/1.0 (+1) | 1,056 (-8%) | 5mo | $35,000 | $33 | 66 |
| 308 N West St | 0.39mi | 3/2.0 (+1) | 1,216 (+6%) | 18mo | $27,500 | $23 | 49 |
Match score weights: distance 35% · size 25% · config 20% · recency 20%. Top-matched comps best support the ARV.
Projected returns pro-forma
0.53% appreciation · 3.0% rent growth · sell at horizon
- IRR
- 14.5%
- Equity multiple
- 1.72×
- Total profit
- $17,121
- Equity at exit
- $26,937
- IRR
- 18.5%
- Equity multiple
- 3.14×
- Total profit
- $50,940
- Equity at exit
- $34,239
Cash invested: $23,800 (down + closing). Projections, not guarantees.
Landlord ↔ Tenant lean methodology
- Overall (STATE)
- 43 Moderately Tenant-Leaning
- State Illinois
- 43 Moderately Tenant-Leaning · D+7
- County
- — inherits STATE
- City
- — inherits STATE
ZIP-level market 62932
- Home prices YoY
- 0.6%
- Active inventory
- 12
- Price-to-rent
- 7.1×
Monthly cashflow live
- Estimated rent
- $995 medium interval (Pro) →
- Mortgage (P&I)
- −$446
- Tax from tax record
- −$30 /mo · $361/yr
- Insurance
- −$35
- HOA
- −$0
- Vacancy / Maint / Mgmt
- −$209
- Net cashflow
- $275
Break-even live
UW: 25.0% down · 7.5% · 30yr · 1.5% tax · 5.0% vac · 8.0% maint · 8.0% mgmt
Financing live
Cash to close
- Down payment
- $21,250
- Closing costs
- $2,550
- Reserves months
- —
- Total cash needed
- —
Loan-product check · same deal, 3 products live
Conventional
25% down · 7.5% · 30yr
- Down + closing
- —
- Monthly P&I
- —
- Monthly cashflow
- —
- DSCR
- —
- Eligible?
- —
Personal DTI + credit; lowest rate.
DSCR
20% down · 8.5% · 30yr
- Down + closing
- —
- Monthly P&I
- —
- Monthly cashflow
- —
- DSCR
- —
- Eligible?
- —
No personal income docs; deal must DSCR.
Hard money
10% down · 12.0% · 12mo
- Down + closing
- —
- Monthly P&I
- —
- Monthly cashflow
- —
- DSCR
- —
- Eligible?
- —
Short-term bridge; refi at stabilization.
Listing history 12 events
-
2026-06-18days on market $85,000 Active 16 DOM
-
2026-06-17days on market $85,000 Active 15 DOM
-
2026-06-16days on market $85,000 Active 14 DOM
-
2026-06-15days on market $85,000 Active 13 DOM
-
2026-06-13days on market $85,000 Active 11 DOM
-
2026-06-12days on market $85,000 Active 10 DOM
-
2026-06-09days on market $85,000 Active 7 DOM
-
2026-06-08days on market $85,000 Active 6 DOM
-
2026-06-07days on market $85,000 Active 5 DOM
-
2026-06-05days on market $85,000 Active 3 DOM
-
2026-06-03remarks 442-char remark
-
2026-06-03$85,000 Active 1 DOM
ⓘ Source: listings_history table (triggers on properties + properties_extension) + one-shot
backfill from property_details.listing_events for pre-trigger history.
Tax reassessment forecast IL · Partial reset (capped growth)
- Current annual tax
- $361 · $30/mo
- Projected year-2 tax
- $1,145 · $95/mo
- Expected delta
- +$784/yr (+$65/mo · 217.4%)
ⓘ Screening estimate from a state-policy table — verify with the county assessor before closing.
Climate risk First Street
- Flood 1/10 Low FEMA zone X (unshaded) · 0% chance over 30 yrs
- Wildfire 1/10 Low
- Heat 5/10 Major 7 d/yr ≥107°F today · 21 d/yr by 30 yrs out
- Wind 2/10 Low 3% chance of damaging wind over 30 yrs
- Air quality 1/10 Low 0 unhealthy d/yr today · 0 by 30 yrs out
Nearby sold comps map
Loading sold comps map…
Walkable amenities ~0.75 mi
Loading nearby amenities…
Taxation est. · year 1
- Rental income
- $11,944
- − Mortgage interest
- −$4,761
- − Property taxes
- −$361
- − Insurance
- −$425
- − Repairs & maintenance
- −$956
- − Management
- −$956
- − Depreciation
- −$2,473
- Taxable income
- $2,013
- Est. tax owed @ 24.0%
- −$483
- After-tax cash flow
- $2,818/yr
For passive investors: Depreciation is non-cash, so a rental often shows a tax loss while cash-flowing — sheltering income. Rental losses are passive: they offset passive income freely, and up to $25,000/yr can offset ordinary (W-2) income if you actively participate and your MAGI is under $100k (phasing out to $0 by $150k); unused losses carry forward. On sale, claimed depreciation is recaptured at up to 25%, and gains may owe capital-gains tax (a 1031 exchange can defer both). Figures are a year-1 estimate at your 24.0% rate — not tax advice; consult a CPA.
Schools (NCES district)
- District
- Elverado CUSD 196
- NCES district ID
- 1713860
- Math proficiency
- 25% ▲ 3.00%
- Reading proficiency
- 45% ▲ 8.00%
- Median HH income
- $42,241
- Composite
- 32.2/100
- National rank
- #10962
- State rank
- #418 of 919 in IL
Livability — Elkville
- Score
- 58/100
- State rank
- #1123
- US rank
- #21198
Category grades
Schools grade is shown separately in the Schools card above.
Census & demographics
- Census place
- Elkville, IL
- Population (ZIP)
- 1,178
Population outlook (Jackson County) Hauer SSP2
- Today (2025)
- 59,093 people
- By 2030
- 59,628 · +0.9%
- By 2040
- 59,495 · +0.7%
- By 2050
- 58,811 · -0.5%
- By 2075
- 57,683 · -2.4%
- By 2100
- 55,337 · -6.4%
Race, ethnicity, and origin ACS 2023
- Neighborhood character
- Predominantly White (85%)
- Race & ethnicity
- White 85% Hispanic / Latino 8% Two or more races 6%
- Hispanic origin (detail)
- Mexican 7%
- Common ancestry
- Italian 3% Lithuanian 2% Romanian 2%
- Foreign-born
- 3% · Canada
- Languages at home
- 92% English-only · Spanish 7% German/W. Germanic 1% Other Indo-European 1%
Political lean MEDSL · Jackson
- 2024 margin
- Toss-up / Even · D 51.0% · R 47.5% · Other 1.4%
- 2008→2024 swing
- -18.3pp toward R · 2008: 21.8pp · 2024: 3.5pp
- All cycles
- 2024: D+3.5 2020: D+1.3 2016: D+3.0 2012: D+10.3 2008: D+21.8
Not yet ingested
- Civics
- —
Market trends
- HPI YoY
- ▲ 0.53%
- Current HPI
- 96.1674
- Rent YoY
- —
- Metro
- —
- State GDP YoY
- ▲ 1.59%
- F500 in state
- 60
Industry mix (Fortune 500 HQ in IL)
| Industry | F500 HQs | Revenue |
|---|---|---|
| Insurance | 4 | $201B |
|
||
| Consumer Goods | 4 | $87B |
|
||
| Industrial Machinery | 3 | $64B |
|
||
| Healthcare | 2 | $55B |
|
||
| Retail / Pharmacy | 1 | $148B |
|
||
| Agriculture / Food | 1 | $86B |
|
||
Price history
1 event — show timeline
- 2026-06-02 Listed $85,000 MARIS as Distributed by MLS Grid
Property tax history
+18.7%/yrLatest (2023): $361 · +15.9% YoY. Source: county tax records.
Cash-flow waterfall
monthlySold comps — $/sqft
last 12 mo · ≤1 miLoading sold comps…