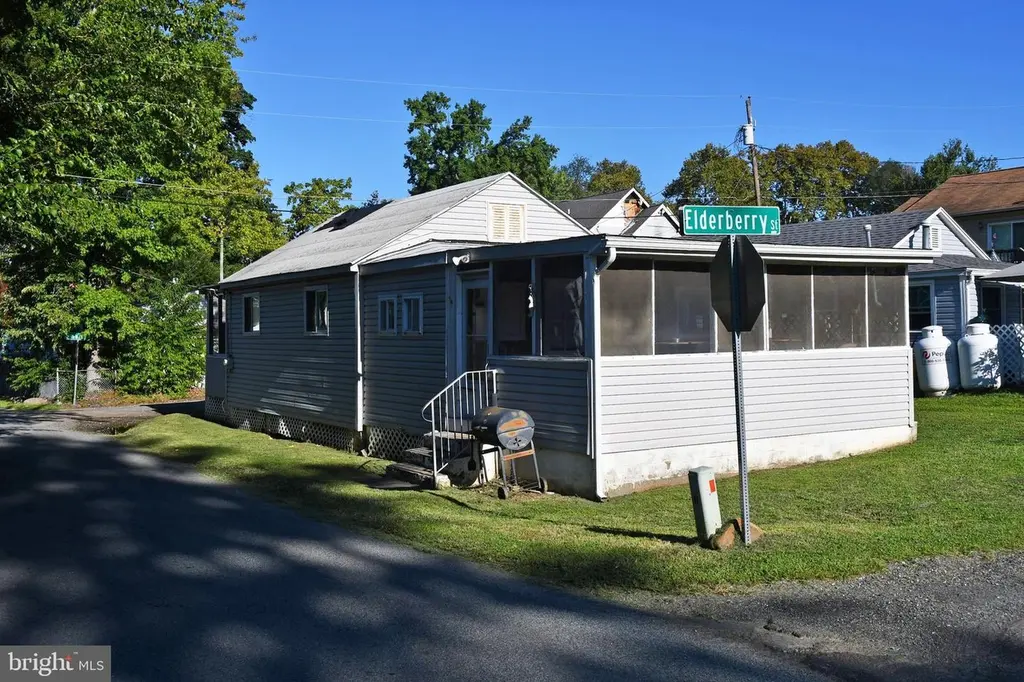
2 Glenwood St · Cecilton, MD
Flood risk 9/10 · Severe
- FEMA flood zone
- X (unshaded)
- Chance of flooding over 30 yrs
- 0.99%
- Est. flood insurance / yr
- $507 – $1,088
Fire risk 1/10 · Minimal
- Est. fire insurance / yr
- $755 – $1,403
Heat risk 8/10 · Major
- Hot days now (above 104°F)
- 7 days/yr
- Hot days in 30 yrs
- 15 days/yr
Wind risk 6/10 · Moderate
- Chance of severe wind over 30 yrs
- 27.0%
Air-quality risk 3/10 · Minor
- Unhealthy air days now
- 2 days/yr
- Unhealthy air days in 30 yrs
- 3 days/yr
Risk factors via First Street. Map © Google.
Why this score? — see what drove the B+ grade
The composite is a weighted blend of 9 inputs, each scored 0–100. Each bar is that input's sub-score; the figure is the points it added to the 100-point composite (weight × sub-score).
- Cash flow +30.0/30.0
- ARV discount +15.0/15.0
- 1% rule +10.0/10.0
- DSCR +10.0/10.0
- Livability +3.2/5.0
- Rent growth +2.5/5.0
- Condition / age +2.5/5.0
- Schools +2.2/10.0
- Appreciation +0.0/10.0
$85,000
🖨 Deal sheet 📄 Offer letter ✓ Due diligence
Listing remarks MLS
Affordable beach cottage in Crystal Beach Manor. If you are willing to put the work in, you will have a very cozy property at the beach for making memories. There is a heat pump for central heat and air. The property is on a holding tank which the current owners have pumped once a year. Limited water views from the property will increase as the leaves fall. Screened porches front and rear for enjoying the summer breezes.
Key facts
- Limited water views
- Heat pump
- Screened porches
Tags
Neighborhood map
What this means for you Summary
Snapshot
- This is a 1-bed/1.0-bath single-family listed at $85k.
Deal economics
- At list price, monthly cash flow is $780 ($9k/yr) — positive.
- The deal already cash-flows at list — no discount required.
- Meets the 1% rule at list price ($2k rent vs $85k).
- Recommended offer: $75k (12.0% below list) — sets the bar for market timing.
Location & tenants
- Location reads 64/100 on livability (#283 in MD) — a middle-class / working-renter tenant base. Strengths: cost of living A+, housing A+, health & safety B; Watch: schools D-, crime F, amenities F.
- Cecil County Public Schools (rural): math 15% / reading 30% proficiency, ranked #15 of 24 in MD (top 62%) — low school quality limits family demand, transient renter base, plan for 1-2y turnover.
- Market conditions: 62 active listings in the ZIP; 563 units permitted in Cecil County in 2024 (330 in 5+ unit buildings).
Forward outlook
- Local home prices are declining (-3.0%/yr); year-one equity from $588 of loan paydown is wiped out by about $3k of value loss. Plan a longer hold.
- At projected returns (-3.0% appreciation + 3.0% rent growth), your $24k cash investment doubles in ~3 years — after that, you're playing with house money.
Negotiation context
- It's been on market 296 days — a 12% lower offer ($75k) is reasonable based on typical stale-listing flexibility.
- Current owner paid $7k; list at $85k implies a 1114% gain — meaningful room to come down on a strong offer.
Risks & watch-outs
- Watch-outs: flood insurance adds $66/mo; built in 1950 — expect roof / HVAC / electrical / plumbing capex.
- Climate carrying-cost: severe flood risk; major wind risk, 27% chance of damaging wind over 30y; extreme-heat days projected 7→15/yr by 2055 (HVAC capex compounding) — expect insurance premiums to compound above CPI over the hold.
Questions for the listing agent
- It's been on market 296 days. Have you received any prior offers? Is the seller open to a 12% concession, seller financing, or rate buy-down credit?
- Built in 1950 — when were the roof, HVAC, electrical panel, plumbing, and water heater last replaced?
- What's the actual annual flood-insurance premium (NFIP or private), and is the property in a SFHA with mandatory coverage?
- Why hasn't it sold? Are there any deal-killer items the seller is aware of (foundation, flood, title, zoning, code violations)?
- Is there a deadline driving the sale (1031 exchange, divorce, estate, relocation)? That informs how much negotiation room exists.
- Schools are D-rated, which usually means shorter tenancies and higher turnover. Who's the typical renter profile here, and what's been the actual vacancy rate?
- Crime grade is F in this area — have there been break-ins, vandalism, or insurance claims at this property in the last 3 years? What carrier currently insures it and at what premium?
- What's the average days-on-market for RENTAL listings here right now (not sales)? A rising rental-DOM trend means longer vacancies and softer asking-rent achievability than the comps imply.
- What's the recent tenant-quality profile in this submarket — average credit score on applications, eviction rate, late-payment / NSF rate, and stable-employment percentage? A property-management company in the area should have these aggregated.
- How much new for-sale + rental construction is in the pipeline within 1–3 miles? Heavy new supply typically softens prices + rents 12–24 months out; constrained supply supports both.
Investment metrics
- 1% rule
- 2.08% ✓
- Cap rate
- 18.25%
- Cash-on-cash
- 42.70%
- DSCR
- 2.90
- GRM
- 4.0
CMA / ARV
- ARV (median comp)
- $167,044
- List price
- $85,000
- Delta
- -49.12%
- Verdict
- UNDERPRICED
- Comps
- 12 within 1.0 mi
Show comp detail 5 sales within ~0.75 mi
| Address | Dist | Beds/Ba | Sqft | Sold | Price | $/sf | Match |
|---|---|---|---|---|---|---|---|
| 64 No Name St | 0.08mi | 1/1.0 | 700 (-1%) | 12mo | $260,000 | $371 | 84 |
| 76 Park Dr | 0.14mi | 2/1.0 (+1) | 752 (+6%) | 1mo | $170,000 | $226 | 77 |
| 37 Holly St | 0.07mi | 2/1.0 (+1) | 708 (-0%) | 24mo | $160,000 | $226 | 71 |
| 18 Roberts St | 0.11mi | 2/2.0 (+1) | 784 (+10%) | 10mo | $172,000 | $219 | 60 |
| 17 Summit Rd | 0.16mi | 1/1.0 | 624 (-12%) | 22mo | $55,000 | $88 | 54 |
Match score weights: distance 35% · size 25% · config 20% · recency 20%. Top-matched comps best support the ARV.
Projected returns pro-forma
-3.0% appreciation · 3.0% rent growth · sell at horizon
- IRR
- 35.6%
- Equity multiple
- 2.51×
- Total profit
- $35,973
- Equity at exit
- $12,674
- IRR
- 42.4%
- Equity multiple
- 5.01×
- Total profit
- $95,507
- Equity at exit
- $7,349
Cash invested: $23,800 (down + closing). Projections, not guarantees.
Landlord ↔ Tenant lean methodology
- Overall (STATE)
- 27 Tenant-Leaning
- State Maryland
- 27 Tenant-Leaning · D+14
- County
- — inherits STATE
- City
- — inherits STATE
ZIP-level market 21919
- Home prices YoY
- -21.2%
- Active inventory
- 62
- Price-to-rent
- 4.0×
Monthly cashflow live
- Estimated rent
- $1,770 medium interval (Pro) →
- Mortgage (P&I)
- −$446
- Tax from tax record
- −$70 /mo · $841/yr
- Insurance
- −$35
- Flood insurance flood zone
- −$66 /mo · $798/yr
- HOA
- −$0
- Vacancy / Maint / Mgmt
- −$372
- Net cashflow
- $780
Break-even live
UW: 25.0% down · 7.5% · 30yr · 1.5% tax · 5.0% vac · 8.0% maint · 8.0% mgmt
Financing live
Cash to close
- Down payment
- $21,250
- Closing costs
- $2,550
- Reserves months
- —
- Total cash needed
- —
Loan-product check · same deal, 3 products live
Conventional
25% down · 7.5% · 30yr
- Down + closing
- —
- Monthly P&I
- —
- Monthly cashflow
- —
- DSCR
- —
- Eligible?
- —
Personal DTI + credit; lowest rate.
DSCR
20% down · 8.5% · 30yr
- Down + closing
- —
- Monthly P&I
- —
- Monthly cashflow
- —
- DSCR
- —
- Eligible?
- —
No personal income docs; deal must DSCR.
Hard money
10% down · 12.0% · 12mo
- Down + closing
- —
- Monthly P&I
- —
- Monthly cashflow
- —
- DSCR
- —
- Eligible?
- —
Short-term bridge; refi at stabilization.
Listing history 16 events
-
2026-06-18days on market $85,000 Active 296 DOM
-
2026-06-17days on market $85,000 Active 295 DOM
-
2026-06-16days on market $85,000 Active 294 DOM
-
2026-06-15days on market $85,000 Active 293 DOM
-
2026-06-13pricedays on market $85,000 Active 291 DOM
-
2026-06-09days on market $105,000 Active 287 DOM
-
2026-06-08days on market $105,000 Active 286 DOM
-
2026-06-07days on market $105,000 Active 285 DOM
-
2026-06-04days on market $105,000 Active 282 DOM
-
2026-06-03days on market $105,000 Active 281 DOM
-
2026-06-02days on market $105,000 Active 280 DOM
-
2026-06-01days on market $105,000 Active 279 DOM
-
2026-05-31days on market $105,000 Active 278 DOM
-
2025-12-30price $105,000 424-char remark
Show marketing remark (424 chars)
Affordable beach cottage in Crystal Beach Manor. If you are willing to put the work in, you will have a very cozy property at the beach for making memories. There is a heat pump for central heat and air. The property is on a holding tank which the current owners have pumped once a year. Limited water views from the property will increase as the leaves fall. Screened porches front and rear for enjoying the summer breezes.
-
2025-08-26$125,000 Active 424-char remark
Show marketing remark (424 chars)
Affordable beach cottage in Crystal Beach Manor. If you are willing to put the work in, you will have a very cozy property at the beach for making memories. There is a heat pump for central heat and air. The property is on a holding tank which the current owners have pumped once a year. Limited water views from the property will increase as the leaves fall. Screened porches front and rear for enjoying the summer breezes.
-
1983-06-16soldstatus $7,000
ⓘ Source: listings_history table (triggers on properties + properties_extension) + one-shot
backfill from property_details.listing_events for pre-trigger history.
Tax reassessment forecast MD · Partial reset (capped growth)
- Current annual tax
- $841 · $70/mo
- Projected year-2 tax
- $884 · $74/mo
- Expected delta
- +$43/yr (+$4/mo · 5.1%)
ⓘ Screening estimate from a state-policy table — verify with the county assessor before closing.
Climate risk First Street
- Flood 9/10 Extreme FEMA zone X (unshaded) · 99% chance over 30 yrs
- Wildfire 1/10 Low
- Heat 8/10 Severe 7 d/yr ≥104°F today · 15 d/yr by 30 yrs out
- Wind 6/10 Major 27% chance of damaging wind over 30 yrs
- Air quality 3/10 Moderate 2 unhealthy d/yr today · 3 by 30 yrs out
Nearby sold comps map
Loading sold comps map…
Walkable amenities ~0.75 mi
Loading nearby amenities…
Taxation est. · year 1
- Rental income
- $21,236
- − Mortgage interest
- −$4,761
- − Property taxes
- −$841
- − Insurance
- −$1,222
- − Repairs & maintenance
- −$1,699
- − Management
- −$1,699
- − Depreciation
- −$2,473
- Taxable income
- $8,541
- Est. tax owed @ 24.0%
- −$2,050
- After-tax cash flow
- $7,314/yr
For passive investors: Depreciation is non-cash, so a rental often shows a tax loss while cash-flowing — sheltering income. Rental losses are passive: they offset passive income freely, and up to $25,000/yr can offset ordinary (W-2) income if you actively participate and your MAGI is under $100k (phasing out to $0 by $150k); unused losses carry forward. On sale, claimed depreciation is recaptured at up to 25%, and gains may owe capital-gains tax (a 1031 exchange can defer both). Figures are a year-1 estimate at your 24.0% rate — not tax advice; consult a CPA.
Schools (NCES district)
- District
- Cecil County Public Schools
- NCES district ID
- 2400240
- Math proficiency
- 15% ▼ -21.00%
- Reading proficiency
- 30% ▼ -15.00%
- Median HH income
- $66,544
- Composite
- 21.51/100
- National rank
- #8322
- State rank
- #15 of 24 in MD
Livability — Cecilton
- Score
- 64/100
- State rank
- #283
- US rank
- #14571
Category grades
Schools grade is shown separately in the Schools card above.
Census & demographics
- Population (ZIP)
- 3,644
Population outlook (Cecil County) Hauer SSP2
- Today (2025)
- 105,877 people
- By 2030
- 106,905 · +1.0%
- By 2040
- 107,156 · +1.2%
- By 2050
- 104,170 · -1.6%
- By 2075
- 95,771 · -9.5%
- By 2100
- 82,381 · -22.2%
Race, ethnicity, and origin ACS 2023
- Neighborhood character
- Predominantly White (96%)
- Race & ethnicity
- White 96% Two or more races 2% Black 1%
- Common ancestry
- Subsaharan African 7% Italian 5% Slovak 3%
- Foreign-born
- 4% · China
- Languages at home
- 93% English-only · Spanish 4% Russian/Polish/Slavic 1%
Political lean MEDSL · Cecil
- 2024 margin
- Solid R (+30.9) · D 33.5% · R 64.4% · Other 2.1%
- 2008→2024 swing
- -16.3pp toward R · 2008: -14.6pp · 2024: -30.9pp
- All cycles
- 2024: R+30.9 2020: R+26.6 2016: R+35.3 2012: R+20.4 2008: R+14.6
Not yet ingested
- Civics
- —
Market trends
- HPI YoY
- ▼ -61.49%
- Current HPI
- 227.9396
- Rent YoY
- —
- Metro
- —
- State GDP YoY
- ▲ 2.97%
- F500 in state
- 12
Industry mix (Fortune 500 HQ in MD)
| Industry | F500 HQs | Revenue |
|---|---|---|
| Aerospace / Defense | 1 | $71B |
|
||
| Utilities | 1 | $25B |
|
||
| Hotels | 1 | $24B |
|
||
| Consumer Goods | 1 | $7B |
|
||
| Real Estate | 1 | $6B |
|
||
| Chemicals | 1 | $2B |
|
||
Price history
+1400.0% since first listed3 events — show timeline
- 2025-12-30 Price Changed $105,000 BRIGHT MLS
- 2025-08-26 Listed $125,000 BRIGHT MLS
- 1983-06-16 Sold (Public Records) $7,000 Public Records
Property tax history
+1.9%/yrLatest (2025): $841 · +5.7% YoY. Source: county tax records.
Cash-flow waterfall
monthlySold comps — $/sqft
last 12 mo · ≤1 miLoading sold comps…