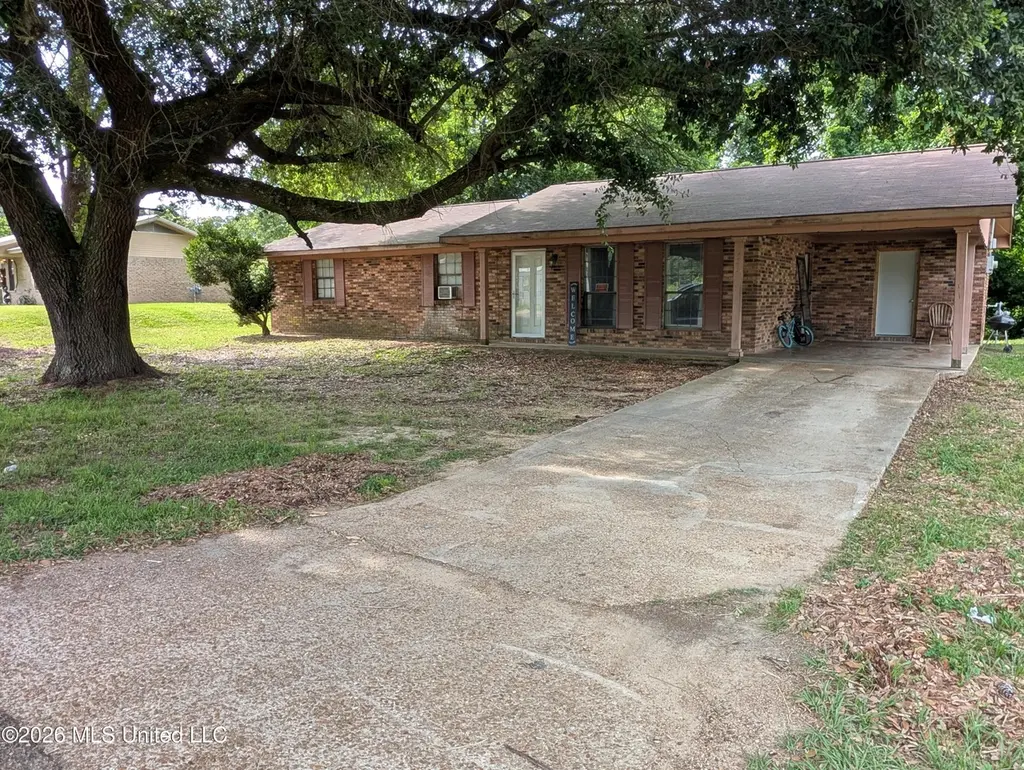
224 Greenfield Rd · Natchez, MS
Flood risk 1/10 · Minimal
- FEMA flood zone
- X (unshaded)
- Chance of flooding over 30 yrs
- 0.0%
- Est. flood insurance / yr
- $507 – $1,088
Fire risk 4/10 · Minor
- Est. fire insurance / yr
- $1,241 – $2,305
Heat risk 7/10 · Major
- Hot days now (above 107°F)
- 7 days/yr
- Hot days in 30 yrs
- 19 days/yr
Wind risk 8/10 · Major
- Chance of severe wind over 30 yrs
- 91.0%
Air-quality risk 1/10 · Minimal
- Unhealthy air days now
- 0 days/yr
- Unhealthy air days in 30 yrs
- 0 days/yr
Risk factors via First Street. Map © Google.
Why this score? — see what drove the C+ grade
The composite is a weighted blend of 9 inputs, each scored 0–100. Each bar is that input's sub-score; the figure is the points it added to the 100-point composite (weight × sub-score).
- Cash flow +28.6/30.0
- DSCR +10.0/10.0
- 1% rule +7.6/10.0
- ARV discount +7.5/15.0
- Livability +3.2/5.0
- Rent growth +2.5/5.0
- Condition / age +2.5/5.0
- Schools +1.0/10.0
- Appreciation +0.0/10.0
$110,000
🖨 Deal sheet 📄 Offer letter ✓ Due diligence
Listing remarks
This brick home is in a neighborhood that has a country feel to it, yet is easily accessible to downtown Natchez. It has solid construction, offering comfort, charm, and endless potential! The roof was replaced just one year ago. It has a spacious kitchen and dining room combo, a family room, three bedrooms, one full bath and one half bath, central air and heat, and a concrete driveway with an attached covered carport. Call to schedule your appointment today!
Key facts
- Solid construction
- Spacious kitchen
- Brick home
Tags
Property features AI
Finance
- Other: Zoned General Residence District
Exterior
- Parking: Attached garage (1 car); Carport (1 car); Concrete parking surfaces
- Utilities: Public sewer; Community water
- Home design: Single-family house; One story; Move-in ready
- Construction: Brick construction; Shingle roof; Slab foundation; Built area approximately 1,358 (per assessor)
- Exterior features: Front yard; Rectangular lot
Interior
- Kitchen: Free-standing electric range; Microwave; Electric water heater
- Bathrooms: 1 full bathroom; 1 half bathroom (1.5 total)
- Heating & cooling: Central electric heating; Central air conditioning; Ceiling fan(s); Window unit(s)
- Interior features: Ceiling fan(s)
Neighborhood map
What this means for you Summary
Snapshot
- This is a 3-bed/1.0-bath single-family listed at $110k.
Deal economics
- At list price, monthly cash flow is $362 ($4k/yr) — positive.
- The deal already cash-flows at list — no discount required.
- Meets the 1% rule at list price ($1k rent vs $110k).
- Recommended offer: $108k (1.5% below list) — sets the bar for market timing.
- Cap rate 10.2% vs local median 4.4% in Natchez — top-decile yield for the area; either an underpriced asset or a hidden risk that comps aren't pricing in. Stress-test before assuming the spread holds.
Location & tenants
- Location reads 63/100 on livability (#156 in MS) — a middle-class / working-renter tenant base. Strengths: cost of living A+, crime B, housing B; Watch: health & safety C-, schools F, amenities F.
- Natchez-Adams School District (town): math 8% / reading 19% proficiency, ranked #114 of 130 in MS (top 88%) — low school quality limits family demand, transient renter base, plan for 1-2y turnover; 90% free/reduced lunch — lower-income household profile, screen leases tightly.
- Market conditions: 281 active listings in the ZIP; 6 units permitted in Adams County in 2024 (0 in 5+ unit buildings).
Forward outlook
- Local home prices are declining (-3.0%/yr); year-one equity from $761 of loan paydown is wiped out by about $3k of value loss. Plan a longer hold.
- Adams County population projected at -21% by 2050 — secular population decline; favor cash flow + early exit over multi-decade hold.
- At projected returns (-3.0% appreciation + 3.0% rent growth), your $31k cash investment doubles in ~9 years — after that, you're playing with house money.
Negotiation context
- It's been on market 29 days — a 2% lower offer ($108k) is reasonable based on typical stale-listing flexibility.
- 2 sale attempts with the ask held roughly flat each time — persistent listings suggest the price (not the market) is what's stuck; bring a comps-based counter.
Risks & watch-outs
- Climate carrying-cost: severe wind risk, 91% chance of damaging wind over 30y; extreme-heat days projected 7→19/yr by 2055 (HVAC capex compounding) — expect insurance premiums to compound above CPI over the hold.
Questions for the listing agent
- Is there a deadline driving the sale (1031 exchange, divorce, estate, relocation)? That informs how much negotiation room exists.
- Schools are F-rated, which usually means shorter tenancies and higher turnover. Who's the typical renter profile here, and what's been the actual vacancy rate?
- What's the average days-on-market for RENTAL listings here right now (not sales)? A rising rental-DOM trend means longer vacancies and softer asking-rent achievability than the comps imply.
- What's the recent tenant-quality profile in this submarket — average credit score on applications, eviction rate, late-payment / NSF rate, and stable-employment percentage? A property-management company in the area should have these aggregated.
- How much new for-sale + rental construction is in the pipeline within 1–3 miles? Heavy new supply typically softens prices + rents 12–24 months out; constrained supply supports both.
Investment metrics
- 1% rule
- 1.26% ✓
- Cap rate
- 10.24%
- Cash-on-cash
- 14.11%
- DSCR
- 1.63
- GRM
- 6.6
CMA / ARV
No comps found within radius.
Projected returns pro-forma
-3.0% appreciation · 3.0% rent growth · sell at horizon
- IRR
- 4.4%
- Equity multiple
- 1.17×
- Total profit
- $5,242
- Equity at exit
- $16,401
- IRR
- 13.9%
- Equity multiple
- 2.11×
- Total profit
- $34,280
- Equity at exit
- $9,511
Cash invested: $30,800 (down + closing). Projections, not guarantees.
Landlord ↔ Tenant lean methodology
- Overall (STATE)
- 90 Strongly Landlord-Friendly
- State Mississippi
- 90 Strongly Landlord-Friendly · R+11
- County
- — inherits STATE
- City
- — inherits STATE
ZIP-level market 39120
- Active inventory
- 281
- Price-to-rent
- 6.6×
Monthly cashflow live
- Estimated rent
- $1,387 medium interval (Pro) →
- Mortgage (P&I)
- −$577
- Tax from tax record
- −$111 /mo · $1,332/yr
- Insurance
- −$46
- HOA
- −$0
- Vacancy / Maint / Mgmt
- −$291
- Net cashflow
- $362
Break-even live
UW: 25.0% down · 7.5% · 30yr · 1.5% tax · 5.0% vac · 8.0% maint · 8.0% mgmt
Financing live
Cash to close
- Down payment
- $27,500
- Closing costs
- $3,300
- Reserves months
- —
- Total cash needed
- —
Loan-product check · same deal, 3 products live
Conventional
25% down · 7.5% · 30yr
- Down + closing
- —
- Monthly P&I
- —
- Monthly cashflow
- —
- DSCR
- —
- Eligible?
- —
Personal DTI + credit; lowest rate.
DSCR
20% down · 8.5% · 30yr
- Down + closing
- —
- Monthly P&I
- —
- Monthly cashflow
- —
- DSCR
- —
- Eligible?
- —
No personal income docs; deal must DSCR.
Hard money
10% down · 12.0% · 12mo
- Down + closing
- —
- Monthly P&I
- —
- Monthly cashflow
- —
- DSCR
- —
- Eligible?
- —
Short-term bridge; refi at stabilization.
Listing history 17 events
-
2026-06-18days on market $110,000 Active 29 DOM
-
2026-06-17days on market $110,000 Active 28 DOM
-
2026-06-16days on market $110,000 Active 27 DOM
-
2026-06-15days on market $110,000 Active 26 DOM
-
2026-06-13days on market $110,000 Active 24 DOM
-
2026-06-12days on market $110,000 Active 23 DOM
-
2026-06-09days on market $110,000 Active 20 DOM
-
2026-06-08days on market $110,000 Active 19 DOM
-
2026-06-07days on market $110,000 Active 18 DOM
-
2026-06-07days on market $110,000 Active 17 DOM
-
2026-06-04days on market $110,000 Active 14 DOM
-
2026-06-02days on market $110,000 Active 13 DOM
-
2026-06-01days on market $110,000 Active 12 DOM
-
2026-05-31days on market $110,000 Active 11 DOM
-
2026-05-20$110,000 Active
-
2026-03-13historical
-
2025-05-22$119,000 Active
ⓘ Source: listings_history table (triggers on properties + properties_extension) + one-shot
backfill from property_details.listing_events for pre-trigger history.
Tax reassessment forecast MS · Resets to sale price
- Current annual tax
- $1,332 · $111/mo
- Projected year-2 tax
- $1,332 · $111/mo
- Expected delta
- $0/yr ($0/mo · 0.0%)
ⓘ Screening estimate from a state-policy table — verify with the county assessor before closing.
Climate risk First Street
- Flood 1/10 Low FEMA zone X (unshaded) · 0% chance over 30 yrs
- Wildfire 4/10 Moderate
- Heat 7/10 Severe 7 d/yr ≥107°F today · 19 d/yr by 30 yrs out
- Wind 8/10 Severe 91% chance of damaging wind over 30 yrs
- Air quality 1/10 Low 0 unhealthy d/yr today · 0 by 30 yrs out
Nearby sold comps map
Loading sold comps map…
Walkable amenities ~0.75 mi
Loading nearby amenities…
Taxation est. · year 1
- Rental income
- $16,645
- − Mortgage interest
- −$6,162
- − Property taxes
- −$1,332
- − Insurance
- −$550
- − Repairs & maintenance
- −$1,332
- − Management
- −$1,332
- − Depreciation
- −$3,200
- Taxable income
- $2,738
- Est. tax owed @ 24.0%
- −$657
- After-tax cash flow
- $3,688/yr
For passive investors: Depreciation is non-cash, so a rental often shows a tax loss while cash-flowing — sheltering income. Rental losses are passive: they offset passive income freely, and up to $25,000/yr can offset ordinary (W-2) income if you actively participate and your MAGI is under $100k (phasing out to $0 by $150k); unused losses carry forward. On sale, claimed depreciation is recaptured at up to 25%, and gains may owe capital-gains tax (a 1031 exchange can defer both). Figures are a year-1 estimate at your 24.0% rate — not tax advice; consult a CPA.
Schools (NCES district)
- District
- Natchez-Adams School District
- NCES district ID
- 2803030
- Math proficiency
- 8% ▼ -16.00%
- Reading proficiency
- 19% ▼ -5.00%
- Median HH income
- $28,288
- Composite
- 10.41/100
- National rank
- #9785
- State rank
- #114 of 130 in MS
Livability — Natchez
- Score
- 63/100
- State rank
- #156
- US rank
- #15334
Category grades
Schools grade is shown separately in the Schools card above.
Census & demographics
- Population (ZIP)
- 29,212
Population outlook (Adams County) Hauer SSP2
- Today (2025)
- 28,614 people
- By 2030
- 27,405 · -4.2%
- By 2040
- 24,914 · -12.9%
- By 2050
- 22,554 · -21.2%
- By 2075
- 17,096 · -40.3%
- By 2100
- 12,156 · -57.5%
Race, ethnicity, and origin ACS 2023
- Neighborhood character
- Diverse neighborhood (Simpson 0.55)
- Race & ethnicity
- Black 56% White 37% Hispanic / Latino 4% Two or more races 2%
- Common ancestry
- Lithuanian 2% Slovak 1% Serbian 1%
- Foreign-born
- 5% · Canada
- Languages at home
- 94% English-only · Spanish 4% Other Asian/Pacific 1%
Political lean MEDSL · Adams
- 2024 margin
- D (+13.9) · D 56.5% · R 42.6%
- 2008→2024 swing
- -1.7pp toward R · 2008: 15.6pp · 2024: 13.9pp
- All cycles
- 2024: D+13.9 2020: D+16.1 2016: D+14.7 2012: D+18.0 2008: D+15.6
Not yet ingested
- Civics
- —
Market trends
- HPI YoY
- ▼ -93.67%
- Current HPI
- 112.2371
- Rent YoY
- —
- Metro
- —
- State GDP YoY
- —
- F500 in state
- 0
Price history
-7.6% since first listed3 events — show timeline
- 2026-05-20 Listed $110,000 MLSU
- 2026-03-13 Listing Removed — MLSU
- 2025-05-22 Listed $119,000 MLSU
Property tax history
+5.2%/yrLatest (2025): $1,332 · +20.4% YoY. Source: county tax records.
Cash-flow waterfall
monthlySold comps — $/sqft
last 12 mo · ≤1 miLoading sold comps…