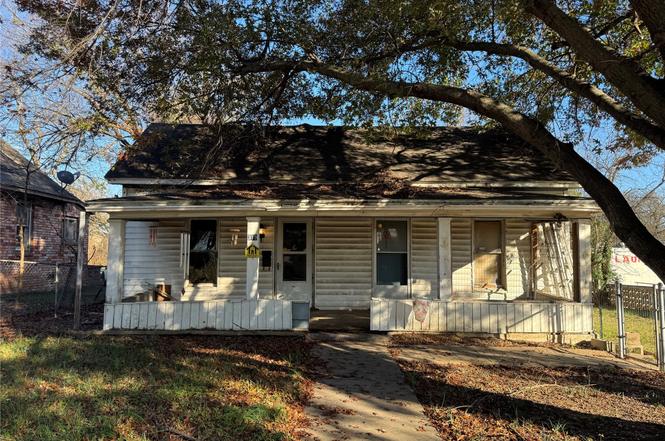
319 S Division St · Sapulpa, OK
Flood risk 1/10 · Minimal
- FEMA flood zone
- X (unshaded)
- Chance of flooding over 30 yrs
- 0.0%
- Est. flood insurance / yr
- $507 – $1,088
Fire risk 5/10 · Moderate
- Est. fire insurance / yr
- $2,463 – $4,575
Heat risk 6/10 · Moderate
- Hot days now (above 112°F)
- 7 days/yr
- Hot days in 30 yrs
- 18 days/yr
Wind risk 3/10 · Minor
- Chance of severe wind over 30 yrs
- 4.0%
Air-quality risk 2/10 · Minimal
- Unhealthy air days now
- 0 days/yr
- Unhealthy air days in 30 yrs
- 1 days/yr
Risk factors via First Street. Map © Google.
Why this score? — see what drove the B+ grade
The composite is a weighted blend of 9 inputs, each scored 0–100. Each bar is that input's sub-score; the figure is the points it added to the 100-point composite (weight × sub-score).
- Cash flow +30.0/30.0
- ARV discount +15.0/15.0
- 1% rule +10.0/10.0
- DSCR +10.0/10.0
- Livability +3.4/5.0
- Rent growth +2.5/5.0
- Condition / age +2.5/5.0
- Schools +2.0/10.0
- Appreciation +0.0/10.0
$85,000
🖨 Deal sheet 📄 Offer letter ✓ Due diligence
Listing remarks MLS
INVESTORS DELIGHT, TONS OF POTENTIAL, 3RD BDRM COULD BEE USED AS OFFICE, 'AS-IS', CASH OR CONV ONLY CALL AGENT FOR MORE INFO
Key facts
- Large bonus room
- Spacious lot
- 8,698 sq ft lot
Tags
Property features AI
Exterior
- Security: No safety shelter
- Utilities: Public water; Public sewer; Electricity available; Natural gas available; Cable available; Phone available
- Home design: Single-story; Faces west; Crawlspace foundation
- Construction: Wood siding; Wood frame construction; Asphalt/fiberglass roof; Year built source reported by owner
- Exterior features: Chain link fencing; No other exterior features listed
Interior
- Kitchen: Refrigerator
- Flooring: Laminate flooring
- Bathrooms: 1 full bathroom
- Heating & cooling: Central heating (electric); Central air conditioning
- Interior features: Storm windows; Laminate counters; No additional interior features listed
- Laundry & utility: Electric water heater; Gas water heater
Neighborhood map
What this means for you Summary
Snapshot
- This is a 3-bed/2.0-bath single-family listed at $85k.
Deal economics
- At list price, monthly cash flow is $529 ($6k/yr) — positive.
- The deal already cash-flows at list — no discount required.
- Meets the 1% rule at list price ($1k rent vs $85k).
- Recommended offer: $75k (12.0% below list) — sets the bar for market timing.
- Cap rate 13.8% vs local median 2.8% in Sapulpa — top-decile yield for the area; either an underpriced asset or a hidden risk that comps aren't pricing in. Stress-test before assuming the spread holds.
Location & tenants
- Location reads 67/100 on livability (#88 in OK) — a middle-class / working-renter tenant base. Strengths: cost of living A+, housing A+, crime B+; Watch: schools F, amenities F, commute F.
- Sapulpa (suburban): math 23% / reading 24% proficiency, ranked #129 of 270 in OK (top 48%) — low school quality limits family demand, transient renter base, plan for 1-2y turnover.
- Market conditions: 196 active listings in the ZIP; 8 comparable units currently listed for rent nearby; rentals leasing fast (median 11d on market — plan ~1-2 weeks tenant-placement turnaround); 193 units permitted in Creek County in 2024 (76 in 5+ unit buildings).
Forward outlook
- Local home prices are declining (-3.0%/yr); year-one equity from $588 of loan paydown is wiped out by about $3k of value loss. Plan a longer hold.
- At projected returns (-3.0% appreciation + 3.0% rent growth), your $24k cash investment doubles in ~5 years — after that, you're playing with house money.
Negotiation context
- It's been on market 168 days — a 12% lower offer ($75k) is reasonable based on typical stale-listing flexibility.
- 5 sale attempts since 27y ago; this cycle's ask has dropped $30k (26%) from the opening price — seller is motivated, your offer sets the floor, not the list.
- Current owner paid $46k; list at $85k implies a 83% gain — meaningful room to come down on a strong offer.
Risks & watch-outs
- Watch-outs: built in 1910 — expect roof / HVAC / electrical / plumbing capex.
- Climate carrying-cost: moderate wildfire risk; extreme-heat days projected 7→18/yr by 2055 (HVAC capex compounding) — expect insurance premiums to compound above CPI over the hold.
Questions for the listing agent
- It's been on market 168 days. Have you received any prior offers? Is the seller open to a 12% concession, seller financing, or rate buy-down credit?
- Built in 1910 — when were the roof, HVAC, electrical panel, plumbing, and water heater last replaced?
- Why hasn't it sold? Are there any deal-killer items the seller is aware of (foundation, flood, title, zoning, code violations)?
- Is there a deadline driving the sale (1031 exchange, divorce, estate, relocation)? That informs how much negotiation room exists.
- Schools are F-rated, which usually means shorter tenancies and higher turnover. Who's the typical renter profile here, and what's been the actual vacancy rate?
- What's the average days-on-market for RENTAL listings here right now (not sales)? A rising rental-DOM trend means longer vacancies and softer asking-rent achievability than the comps imply.
- What's the recent tenant-quality profile in this submarket — average credit score on applications, eviction rate, late-payment / NSF rate, and stable-employment percentage? A property-management company in the area should have these aggregated.
- How much new for-sale + rental construction is in the pipeline within 1–3 miles? Heavy new supply typically softens prices + rents 12–24 months out; constrained supply supports both.
Investment metrics
- 1% rule
- 1.61% ✓
- Cap rate
- 13.76%
- Cash-on-cash
- 26.67%
- DSCR
- 2.19
- GRM
- 5.2
CMA / ARV
- ARV (on-the-fly)
- $164,736
- Comps found
- 12
Show comp detail 12 sales within ~0.75 mi
| Address | Dist | Beds/Ba | Sqft | Sold | Price | $/sf | Match |
|---|---|---|---|---|---|---|---|
| 204 S Birch St | 0.19mi | 3/1.0 | 1,454 (+3%) | 2mo | $160,000 | $110 | 80 |
| 1002 E Thompson Ave | 0.11mi | 3/1.5 | 1,529 (+9%) | 1mo | $144,500 | $95 | 78 |
| 207 S Walnut St | 0.36mi | 3/1.5 | 1,376 (-2%) | 2mo | $188,000 | $137 | 76 |
| 1201 E Cleveland Ave | 0.31mi | 3/1.0 | 1,364 (-3%) | 3mo | $103,000 | $76 | 74 |
| 1024 E Lee Ave | 0.19mi | 2/2.0 (-1) | 1,540 (+9%) | 0mo | $233,000 | $151 | 70 |
| 217 E Bryan Ave | 0.55mi | 3/2.0 | 1,332 (-5%) | 0mo | $215,000 | $161 | 65 |
| 1002 E Line Ave | 0.54mi | 2/1.0 (-1) | 1,420 (+1%) | 1mo | $85,000 | $60 | 63 |
| 1009 E Thompson Ave | 0.15mi | 4/1.0 (+1) | 1,234 (-12%) | 1mo | $145,000 | $118 | 63 |
| 618 S Oak St | 0.51mi | 2/1.0 (-1) | 1,490 (+6%) | 2mo | $174,000 | $117 | 56 |
| 204 N Elm St | 0.74mi | 3/1.0 | 1,298 (-8%) | 0mo | $85,000 | $65 | 48 |
| 640 E Line Ave | 0.58mi | 4/2.5 (+1) | 1,577 (+12%) | 0mo | $265,000 | $168 | 46 |
| 409 N Ridgeway St | 0.65mi | 2/1.0 (-1) | 1,239 (-12%) | 0mo | $110,000 | $89 | 40 |
Match score weights: distance 35% · size 25% · config 20% · recency 20%. Top-matched comps best support the ARV.
Projected returns pro-forma
-3.0% appreciation · 3.0% rent growth · sell at horizon
- IRR
- 20.5%
- Equity multiple
- 1.84×
- Total profit
- $19,909
- Equity at exit
- $12,674
- IRR
- 28.7%
- Equity multiple
- 3.55×
- Total profit
- $60,704
- Equity at exit
- $7,349
Cash invested: $23,800 (down + closing). Projections, not guarantees.
Landlord ↔ Tenant lean methodology
- Overall (STATE)
- 83 Strongly Landlord-Friendly
- State Oklahoma
- 83 Strongly Landlord-Friendly · R+20
- County
- — inherits STATE
- City
- — inherits STATE
ZIP-level market 74066
- Home prices YoY
- -26.3%
- Active inventory
- 196
- Price-to-rent
- 5.2×
Monthly cashflow live
- Estimated rent
- $1,368 high interval (Pro) →
- Mortgage (P&I)
- −$446
- Tax from tax record
- −$71 /mo · $848/yr
- Insurance
- −$35
- HOA
- −$0
- Vacancy / Maint / Mgmt
- −$287
- Net cashflow
- $529
Break-even live
UW: 25.0% down · 7.5% · 30yr · 1.5% tax · 5.0% vac · 8.0% maint · 8.0% mgmt
Financing live
Cash to close
- Down payment
- $21,250
- Closing costs
- $2,550
- Reserves months
- —
- Total cash needed
- —
Loan-product check · same deal, 3 products live
Conventional
25% down · 7.5% · 30yr
- Down + closing
- —
- Monthly P&I
- —
- Monthly cashflow
- —
- DSCR
- —
- Eligible?
- —
Personal DTI + credit; lowest rate.
DSCR
20% down · 8.5% · 30yr
- Down + closing
- —
- Monthly P&I
- —
- Monthly cashflow
- —
- DSCR
- —
- Eligible?
- —
No personal income docs; deal must DSCR.
Hard money
10% down · 12.0% · 12mo
- Down + closing
- —
- Monthly P&I
- —
- Monthly cashflow
- —
- DSCR
- —
- Eligible?
- —
Short-term bridge; refi at stabilization.
Rent comps 8 comps
| Address | Beds | Baths | Sqft | Rent | $/sqft | DOM | Units | Dist |
|---|---|---|---|---|---|---|---|---|
| 925 E Thompson Ave Sapulpa, OK | 3.0 | 1.0 | 1416 | $1,450 | $1.02 | 10d | 1 | 0.14mi |
| 925 E Thompson Ave Sapulpa, OK | 3.0 | 1.0 | 1416 | $1,450 | $1.02 | 2d | 1 | 0.14mi |
| 405 S Maple St Unit F Sapulpa, OK | 2.0 | 1.0 | 1280 | $955 | $0.75 | 2d | 1 | 0.26mi |
| 405 S Maple St Unit F Sapulpa, OK | 2.0 | 1.0 | 1280 | $955 | $0.75 | 16d | 1 | 0.26mi |
| 726 S Apple St Sapulpa, OK | 4.0 | 2.0 | 1693 | $1,750 | $1.03 | 19d | 1 | 0.50mi |
| 919 S Mission St Sapulpa, OK | 2.0–3.0 | 1.0–2.0 | 950 | $1,125 | $1.18 | 2d | 2 | 0.54mi |
| 310 N Division St Sapulpa, OK | 3.0 | 2.0 | 1237 | $1,300 | $1.05 | 16d | 1 | 0.59mi |
| 418 S Water St Sapulpa, OK | 3.0 | 1.0 | 1166 | $1,300 | $1.11 | 10d | 1 | 0.67mi |
Listing history 25 events
-
2026-05-08status Pending
-
2026-04-17price $85,000
-
2026-03-12price $90,000
-
2026-01-07price $95,000
-
2025-12-12price $105,000
-
2025-11-22$115,000 Active
-
2025-06-26historical
-
2025-05-06status Active
-
2025-04-28status Pending
-
2025-04-15price $105,000
-
2025-03-12price $110,000
-
2025-02-15price $115,000
-
2025-01-02status Active
-
2025-01-02price $125,000
-
2024-12-23status Pending
-
2024-12-02price $114,900
-
2024-10-17price $115,000
-
2024-08-16price $120,000
-
2024-06-27$125,000 Active
-
2001-03-20soldstatus $46,500
-
1999-08-18soldstatus $29,900 124-char remark
Show marketing remark (124 chars)
INVESTORS DELIGHT, TONS OF POTENTIAL, 3RD BDRM COULD BEE USED AS OFFICE, 'AS-IS', CASH OR CONV ONLY CALL AGENT FOR MORE INFO
-
1999-08-18soldstatus $30,000
Show marketing remark (124 chars)
INVESTORS DELIGHT, TONS OF POTENTIAL, 3RD BDRM COULD BEE USED AS OFFICE, 'AS-IS', CASH OR CONV ONLY CALL AGENT FOR MORE INFO
-
1999-07-25historical 124-char remark
Show marketing remark (124 chars)
INVESTORS DELIGHT, TONS OF POTENTIAL, 3RD BDRM COULD BEE USED AS OFFICE, 'AS-IS', CASH OR CONV ONLY CALL AGENT FOR MORE INFO
-
1999-07-08$33,500 124-char remark
Show marketing remark (124 chars)
INVESTORS DELIGHT, TONS OF POTENTIAL, 3RD BDRM COULD BEE USED AS OFFICE, 'AS-IS', CASH OR CONV ONLY CALL AGENT FOR MORE INFO
-
1993-07-26soldstatus $23,000
ⓘ Source: listings_history table (triggers on properties + properties_extension) + one-shot
backfill from property_details.listing_events for pre-trigger history.
Tax reassessment forecast OK · Resets to sale price
- Current annual tax
- $848 · $71/mo
- Projected year-2 tax
- $848 · $71/mo
- Expected delta
- $0/yr ($0/mo · 0.0%)
ⓘ Screening estimate from a state-policy table — verify with the county assessor before closing.
Climate risk First Street
- Flood 1/10 Low FEMA zone X (unshaded) · 0% chance over 30 yrs
- Wildfire 5/10 Major
- Heat 6/10 Major 7 d/yr ≥112°F today · 18 d/yr by 30 yrs out
- Wind 3/10 Moderate 4% chance of damaging wind over 30 yrs
- Air quality 2/10 Low 0 unhealthy d/yr today · 1 by 30 yrs out
Nearby sold comps map
Loading sold comps map…
Walkable amenities ~0.75 mi
Loading nearby amenities…
Taxation est. · year 1
- Rental income
- $16,416
- − Mortgage interest
- −$4,761
- − Property taxes
- −$848
- − Insurance
- −$425
- − Repairs & maintenance
- −$1,313
- − Management
- −$1,313
- − Depreciation
- −$2,473
- Taxable income
- $5,282
- Est. tax owed @ 24.0%
- −$1,268
- After-tax cash flow
- $5,079/yr
For passive investors: Depreciation is non-cash, so a rental often shows a tax loss while cash-flowing — sheltering income. Rental losses are passive: they offset passive income freely, and up to $25,000/yr can offset ordinary (W-2) income if you actively participate and your MAGI is under $100k (phasing out to $0 by $150k); unused losses carry forward. On sale, claimed depreciation is recaptured at up to 25%, and gains may owe capital-gains tax (a 1031 exchange can defer both). Figures are a year-1 estimate at your 24.0% rate — not tax advice; consult a CPA.
Schools (NCES district)
- District
- Sapulpa
- NCES district ID
- 4026910
- Math proficiency
- 23% ▼ -12.00%
- Reading proficiency
- 24% ▼ -12.00%
- Median HH income
- $44,536
- Composite
- 20.29/100
- National rank
- #8616
- State rank
- #129 of 270 in OK
Livability — Sapulpa
- Score
- 67/100
- State rank
- #88
- US rank
- #10676
Category grades
Schools grade is shown separately in the Schools card above.
Census & demographics
- Census place
- Sapulpa, OK
- County
- Creek County · 32,292 people
- City population
- 32,292
- Metro
- Tulsa, OK
- Population (ZIP)
- 32,292
- Household income
- $64,698
- Rent vs Own
- Severe rent burden
- 716.0
Population outlook (Creek County) Hauer SSP2
- Today (2025)
- 72,706 people
- By 2030
- 73,032 · +0.4%
- By 2040
- 72,788 · +0.1%
- By 2050
- 71,558 · -1.6%
- By 2075
- 69,248 · -4.8%
- By 2100
- 62,722 · -13.7%
Race, ethnicity, and origin ACS 2023
- Neighborhood character
- Predominantly White (71%)
- Race & ethnicity
- White 71% Native American 12% Two or more races 9% Hispanic / Latino 6% Black 3%
- Hispanic origin (detail)
- Mexican 4%
- Common ancestry
- Slovak 2% Lithuanian 2% Italian 2%
- Foreign-born
- 2% · Canada
- Languages at home
- 96% English-only · Spanish 3%
Political lean MEDSL · Creek
- 2024 margin
- Solid R (+55.7) · D 21.2% · R 77.0% · Other 1.8%
- 2008→2024 swing
- -14.1pp toward R · 2008: -41.6pp · 2024: -55.7pp
- All cycles
- 2024: R+55.7 2020: R+54.8 2016: R+54.5 2012: R+45.4 2008: R+41.6
Not yet ingested
- Civics
- —
Market trends
- HPI YoY
- ▼ -89.18%
- Current HPI
- 250.2859
- Rent YoY
- —
- Metro
- Tulsa, OK
- State GDP YoY
- ▲ 1.55%
- F500 in state
- 6
Industry mix (Fortune 500 HQ in OK)
| Industry | F500 HQs | Revenue |
|---|---|---|
| Energy | 3 | $48B |
|
||
Price history
+269.6% since first listed25 events — show timeline
- 2026-05-08 Pending — MLS Technology, Inc.
- 2026-04-17 Price Changed $85,000 MLS Technology, Inc.
- 2026-03-12 Price Changed $90,000 MLS Technology, Inc.
- 2026-01-07 Price Changed $95,000 MLS Technology, Inc.
- 2025-12-12 Price Changed $105,000 MLS Technology, Inc.
- 2025-11-22 Listed $115,000 MLS Technology, Inc.
- 2025-06-26 Listing Removed — MLS Technology, Inc.
- 2025-05-06 Relisted — MLS Technology, Inc.
- 2025-04-28 Pending — MLS Technology, Inc.
- 2025-04-15 Price Changed $105,000 MLS Technology, Inc.
- 2025-03-12 Price Changed $110,000 MLS Technology, Inc.
- 2025-02-15 Price Changed $115,000 MLS Technology, Inc.
- 2025-01-02 Relisted — MLS Technology, Inc.
- 2025-01-02 Price Changed $125,000 MLS Technology, Inc.
- 2024-12-23 Pending — MLS Technology, Inc.
- 2024-12-02 Price Changed $114,900 MLS Technology, Inc.
- 2024-10-17 Price Changed $115,000 MLS Technology, Inc.
- 2024-08-16 Price Changed $120,000 MLS Technology, Inc.
- 2024-06-27 Listed $125,000 MLS Technology, Inc.
- 2001-03-20 Sold (Public Records) $46,500 Public Records
- 1999-08-18 Sold (Public Records) $30,000 Public Records
- 1999-08-18 Sold (MLS) $29,900 MLS Technology, Inc.
- 1999-07-25 Listing Removed — MLS Technology, Inc.
- 1999-07-08 Listed $33,500 MLS Technology, Inc.
- 1993-07-26 Sold (Public Records) $23,000 Public Records
Property tax history
+1.3%/yrLatest (2025): $848 · +1.3% YoY. Source: county tax records.
Cash-flow waterfall
monthlySold comps — $/sqft
last 12 mo · ≤1 miLoading sold comps…