571 Academy St Unit 3B · New York, NY
Flood risk 4/10 · Minor
- FEMA flood zone
- X (shaded)
- Chance of flooding over 30 yrs
- 0.23%
- Est. flood insurance / yr
- $507 – $1,088
Fire risk 1/10 · Minimal
- Est. fire insurance / yr
- $691 – $1,283
Heat risk 6/10 · Moderate
- Hot days now (above 99°F)
- 7 days/yr
- Hot days in 30 yrs
- 15 days/yr
Wind risk 6/10 · Moderate
- Chance of severe wind over 30 yrs
- 27.0%
Air-quality risk 3/10 · Minor
- Unhealthy air days now
- 3 days/yr
- Unhealthy air days in 30 yrs
- 4 days/yr
Risk factors via First Street. Map © Google.
Why this score? — see what drove the D grade
The composite is a weighted blend of 9 inputs, each scored 0–100. Each bar is that input's sub-score; the figure is the points it added to the 100-point composite (weight × sub-score).
- Cash flow +8.0/30.0
- ARV discount +7.5/15.0
- Rent growth +5.0/5.0
- Schools +5.0/10.0
- Appreciation +4.6/10.0
- Livability +3.8/5.0
- 1% rule +3.7/10.0
- Condition / age +2.5/5.0
- DSCR +2.1/10.0
$375,000
🖨 Deal sheet 📄 Offer letter ✓ Due diligence
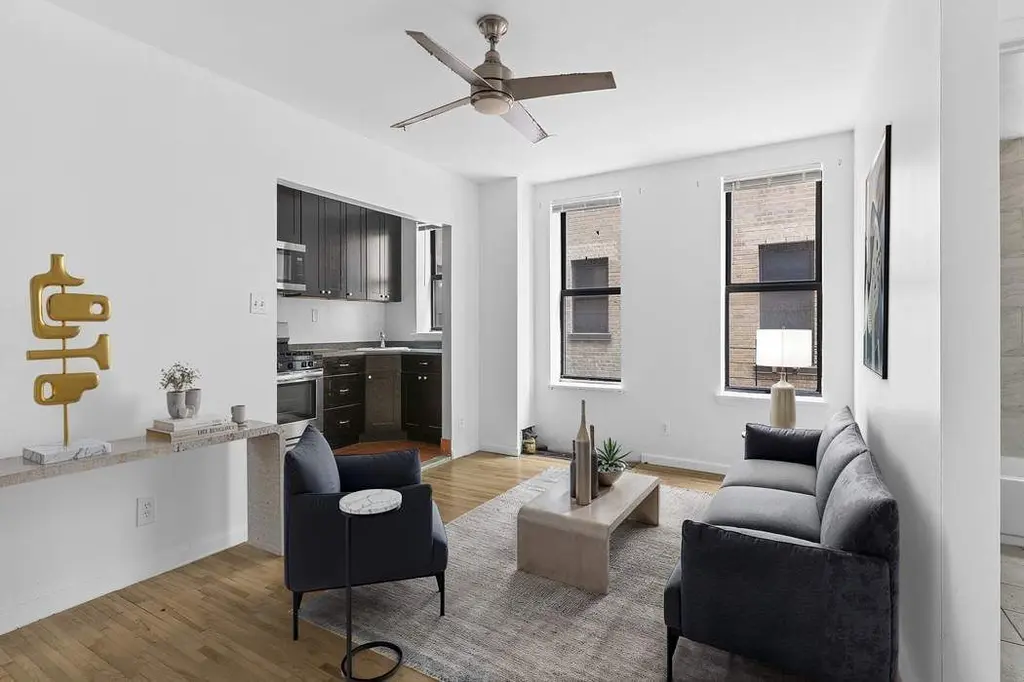
Listing remarks
Welcome to 3B at 571 Academy Street — your entry point into ownership, and one of Inwood's most compelling values. This bright, well-proportioned condominium delivers the features that matter most: abundant closet space, a windowed kitchen and bathroom, and a bedroom that comfortably fits a king-sized bed. The open-concept kitchen — outfitted with stainless steel appliances and generous storage — flows into a living area spacious enough for both a seating arrangement and a dining setup, or a thoughtfully configured work-from-home space. Light is a genuine asset here. The bedroom offers a full wall of closets and the kind of natural light that makes a home feel twice its s
Key facts
- Open concept kitchen
- Windowed kitchen
- Laundry on site
Tags
Property features AI
Finance
- Other: Building contains 89 units
- Financial info: Pets allowed in building
- HOA & community: Monthly association fee of $537
Exterior
- Home design: Condominium (Academy Twins Condominium); 5-story building; Entry on level 3
- Construction: Elevator-served building
- Exterior features: East exposure
Interior
- Flooring: Hardwood
- Bathrooms: 1 full bathroom
- Interior features: Unfurnished; Hardwood floors
- Laundry & utility: Common on-floor laundry; Common area laundry room
Neighborhood map
What this means for you Summary
Snapshot
- This is a 1-bed/1.0-bath condo listed at $375k.
Deal economics
- At list price, monthly cash flow is $-382 ($-5k/yr) — negative.
- To cash-flow at today's rent, offer at most $308k (18.0% below list).
- To meet the 1% rule (rent ≥ 1% of price), the offer needs to be $326k (13.2% below list).
- Recommended offer: $308k (18.0% below list) — sets the bar for cash-flow.
- Cap rate 5.1% vs local median 2.6% in New York — top-decile yield for the area; either an underpriced asset or a hidden risk that comps aren't pricing in. Stress-test before assuming the spread holds.
Location & tenants
- Location reads 75/100 on livability (#268 in NY, #4,188 nationally) — a middle-class / working-renter tenant base. Strengths: amenities A+, commute A+, health & safety A; Watch: crime F, cost of living F.
- Market conditions: Rents rising fast (+9.9%/yr); 32 active listings in the ZIP; 1 comparable units currently listed for rent nearby; 4,467 units permitted in New York County in 2024 (4,463 in 5+ unit buildings).
- At $3,256/mo this rent would consume 58% of the median local household income ($68k/yr) (locally 3612% of renters already pay >50% of income on rent) — very limited rent-growth headroom before tenants either downsize or default.
Forward outlook
- Local home prices are declining (-0.8%/yr); year-one equity from $3k of loan paydown is wiped out by about $3k of value loss. Plan a longer hold.
- New York County population projected at +21% by 2050 — long-run rental-demand tailwind backs the buy-and-hold thesis.
Negotiation context
- It's been on market 57 days — a 3% lower offer ($364k) is reasonable based on typical stale-listing flexibility.
- 3 sale attempts since 4y ago with the ask held roughly flat each time — persistent listings suggest the price (not the market) is what's stuck; bring a comps-based counter.
Risks & watch-outs
- Watch-outs: built in 1941 — expect roof / HVAC / electrical / plumbing capex.
- Climate carrying-cost: major wind risk, 27% chance of damaging wind over 30y; extreme-heat days projected 7→15/yr by 2055 (HVAC capex compounding) — expect insurance premiums to compound above CPI over the hold.
Questions for the listing agent
- What do current leases actually rent for vs. the listed asking? Can we see a recent rent roll and the last 12 months of T-12 income?
- It's been on market 57 days. Have you received any prior offers? Is the seller open to a 18% concession, seller financing, or rate buy-down credit?
- Built in 1941 — when were the roof, HVAC, electrical panel, plumbing, and water heater last replaced?
- What does the HOA fee cover, when was the last increase, and are there any pending special assessments or reserve-fund shortfalls?
- Any open or pending special assessments — roof, HVAC, plumbing, elevator, façade? What's the per-unit balance and payoff schedule, and is the seller paying it off at close or rolling it to the buyer?
- Is there a deadline driving the sale (1031 exchange, divorce, estate, relocation)? That informs how much negotiation room exists.
- Schools are B-rated — typically a magnet for longer-tenancy family renters. What's the average tenant stay here, and is there a school-zone premium baked into asking?
- Crime grade is F in this area — have there been break-ins, vandalism, or insurance claims at this property in the last 3 years? What carrier currently insures it and at what premium?
- The area grade is low — what's the realistic commute time and amenity access for the typical tenant pool here? Any planned neighborhood developments (good or bad) we should know about?
- What's the average days-on-market for RENTAL listings here right now (not sales)? A rising rental-DOM trend means longer vacancies and softer asking-rent achievability than the comps imply.
- What's the recent tenant-quality profile in this submarket — average credit score on applications, eviction rate, late-payment / NSF rate, and stable-employment percentage? A property-management company in the area should have these aggregated.
- How much new apartment / multifamily construction is in the pipeline within 1–3 miles? Heavy new supply (>2% of stock underway) typically softens rents 12–24 months out; light construction supports rent growth.
Investment metrics
- 1% rule
- 0.87% ✗
- Cap rate
- 5.07%
- Cash-on-cash
- -4.36%
- DSCR
- 0.81
- GRM
- 9.6
CMA / ARV
No comps found within radius.
Projected returns pro-forma
-0.81% appreciation · 8.0% rent growth · sell at horizon
- IRR
- -6.6%
- Equity multiple
- 0.70×
- Total profit
- $-31,907
- Equity at exit
- $93,891
- IRR
- 4.5%
- Equity multiple
- 1.52×
- Total profit
- $54,159
- Equity at exit
- $101,493
Cash invested: $105,000 (down + closing). Projections, not guarantees.
Landlord ↔ Tenant lean methodology
- Overall (CITY)
- 0 Strongly Tenant-Friendly
- State New York
- 15 Strongly Tenant-Friendly · D+10
- County
- — inherits STATE
- City New York
- 0 Strongly Tenant-Friendly · D+34
ZIP-level market 10034
- Home prices YoY
- -0.7%
- Rents YoY
- 9.9%
- Active inventory
- 32
- Price-to-rent
- 9.6×
Monthly cashflow live
- Estimated rent
- $3,256 medium interval (Pro) →
- Mortgage (P&I)
- −$1,967
- Tax from tax record
- −$294 /mo · $3,528/yr
- Insurance
- −$156
- HOA
- −$537
- Vacancy / Maint / Mgmt
- −$684
- Net cashflow
- $-382
Break-even live
UW: 25.0% down · 7.5% · 30yr · 1.5% tax · 5.0% vac · 8.0% maint · 8.0% mgmt
Financing live
Cash to close
- Down payment
- $93,750
- Closing costs
- $11,250
- Reserves months
- —
- Total cash needed
- —
Loan-product check · same deal, 3 products live
Conventional
25% down · 7.5% · 30yr
- Down + closing
- —
- Monthly P&I
- —
- Monthly cashflow
- —
- DSCR
- —
- Eligible?
- —
Personal DTI + credit; lowest rate.
DSCR
20% down · 8.5% · 30yr
- Down + closing
- —
- Monthly P&I
- —
- Monthly cashflow
- —
- DSCR
- —
- Eligible?
- —
No personal income docs; deal must DSCR.
Hard money
10% down · 12.0% · 12mo
- Down + closing
- —
- Monthly P&I
- —
- Monthly cashflow
- —
- DSCR
- —
- Eligible?
- —
Short-term bridge; refi at stabilization.
Rent comps 1 comps
| Address | Beds | Baths | Sqft | Rent | $/sqft | DOM | Units | Dist |
|---|---|---|---|---|---|---|---|---|
| 2600 Netherland Ave Bronx, NY | 1.0–3.0 | 1.0–2.5 | 1132 | $2,775 | $2.45 | 22d | 3 | 1.11mi |
HOA detail condo
- Monthly dues
- $537 · $6,444/yr
- Assessments
- None detected in remarks — confirm with the listing agent.
Listing history 21 events
-
2026-06-18days on market $375,000 Active 57 DOM
-
2026-06-17days on market $375,000 Active 56 DOM
-
2026-06-16days on market $375,000 Active 55 DOM
-
2026-06-15days on market $375,000 Active 54 DOM
-
2026-06-13days on market $375,000 Active 52 DOM
-
2026-06-10days on market $375,000 Active 48 DOM
-
2026-06-08days on market $375,000 Active 47 DOM
-
2026-06-08days on market $375,000 Active 46 DOM
-
2026-06-04days on market $375,000 Active 43 DOM
-
2026-06-03days on market $375,000 Active 42 DOM
-
2026-06-01days on market $375,000 Active 40 DOM
-
2026-05-31days on market $375,000 Active 39 DOM
-
2026-04-22$375,000 Active
-
2023-04-20price $375,000
-
2023-04-19soldstatus $375,000
-
2023-01-31historical
-
2022-10-19$385,000 Active
-
2022-10-19$385,000 Active
-
2017-11-17soldstatus $411,000
-
2006-05-31soldstatus $265,000
-
1990-07-18soldstatus $98,500
ⓘ Source: listings_history table (triggers on properties + properties_extension) + one-shot
backfill from property_details.listing_events for pre-trigger history.
Tax reassessment forecast NY · Partial reset (capped growth)
- Current annual tax
- $3,528 · $294/mo
- Projected year-2 tax
- $4,933 · $411/mo
- Expected delta
- +$1,405/yr (+$117/mo · 39.8%)
ⓘ Screening estimate from a state-policy table — verify with the county assessor before closing.
Climate risk First Street
- Flood 4/10 Moderate FEMA zone X (shaded) · 23% chance over 30 yrs
- Wildfire 1/10 Low
- Heat 6/10 Major 7 d/yr ≥99°F today · 15 d/yr by 30 yrs out
- Wind 6/10 Major 27% chance of damaging wind over 30 yrs
- Air quality 3/10 Moderate 3 unhealthy d/yr today · 4 by 30 yrs out
Nearby sold comps map
Loading sold comps map…
Walkable amenities ~0.75 mi
Loading nearby amenities…
Taxation est. · year 1
- Rental income
- $39,069
- − Mortgage interest
- −$21,006
- − Property taxes
- −$3,528
- − Insurance
- −$1,875
- − Repairs & maintenance
- −$3,126
- − Management
- −$3,126
- − HOA
- −$6,444
- − Depreciation
- −$10,909
- Taxable loss
- −$10,945
- Est. tax savings @ 24.0%
- +$2,627
- After-tax cash flow
- $-1,955/yr
For passive investors: Depreciation is non-cash, so a rental often shows a tax loss while cash-flowing — sheltering income. Rental losses are passive: they offset passive income freely, and up to $25,000/yr can offset ordinary (W-2) income if you actively participate and your MAGI is under $100k (phasing out to $0 by $150k); unused losses carry forward. On sale, claimed depreciation is recaptured at up to 25%, and gains may owe capital-gains tax (a 1031 exchange can defer both). Figures are a year-1 estimate at your 24.0% rate — not tax advice; consult a CPA.
Schools (NCES district)
No district data.
Livability — New York
- Score
- 75/100
- State rank
- #268
- US rank
- #4188
Category grades
Schools grade is shown separately in the Schools card above.
Census & demographics
- Census place
- New York, NY
- County
- New York County · 1,599,927 people
- City population
- 7,731,280
- Metro
- New York-Newark-Jersey City, NY-NJ-PA
- Population (ZIP)
- 37,758
- Household income
- $67,754
- Rent vs Own
- Severe rent burden
- 3612.0
Population outlook (New York County) Hauer SSP2
- Today (2025)
- 1,825,725 people
- By 2030
- 1,904,611 · +4.3%
- By 2040
- 2,052,719 · +12.4%
- By 2050
- 2,206,601 · +20.9%
- By 2075
- 2,509,427 · +37.4%
- By 2100
- 2,702,933 · +48.0%
Race, ethnicity, and origin ACS 2023
- Neighborhood character
- Predominantly Hispanic (67%)
- Race & ethnicity
- Hispanic / Latino 67% Two or more races 21% White 19% Black 7% Asian 3% Native American 2%
- Hispanic origin (detail)
- Mexican 4% Puerto Rican 4% Cuban 1% Dominican 50%
- Common ancestry
- Romanian 1% Italian 1% Lithuanian 1%
- Foreign-born
- 41% · Canada, China, South Korea
- Languages at home
- 34% English-only · Spanish 60% Other Indo-European 2% French/Haitian/Cajun 1%
Political lean MEDSL · New York
- 2024 margin
- Solid D (+64.8) · D 82.4% · R 17.6%
- 2008→2024 swing
- -7.4pp toward R · 2008: 72.2pp · 2024: 64.8pp
- All cycles
- 2024: D+64.8 2020: D+74.5 2016: D+77.2 2012: D+69.6 2008: D+72.2
Not yet ingested
- Civics
- —
Market trends
- HPI YoY
- ▼ -0.81%
- Current HPI
- 119.12
- Rent YoY
- ▲ 9.92%
- Metro
- New York-Newark-Jersey City, NY-NJ-PA
- State GDP YoY
- ▲ 2.60%
- F500 in state
- 92
Industry mix (Fortune 500 HQ in NY)
| Industry | F500 HQs | Revenue |
|---|---|---|
| Financial Services | 10 | $950B |
|
||
| Consumer Goods | 9 | $162B |
|
||
| Insurance | 4 | $225B |
|
||
| Telecommunications | 2 | $144B |
|
||
| Pharmaceuticals | 2 | $112B |
|
||
| Media / Entertainment | 2 | $69B |
|
||
Price history
+280.7% since first listed9 events — show timeline
- 2026-04-22 Listed $375,000 RLS at REBNY
- 2023-04-20 Price Changed $375,000 RLS at REBNY
- 2023-04-19 Sold (Public Records) $375,000 Public Records
- 2023-01-31 Listing Removed — OneKey® MLS as Distributed by MLS Grid
- 2022-10-19 Listed $385,000 RLS at REBNY
- 2022-10-19 Listed $385,000 OneKey® MLS as Distributed by MLS Grid
- 2017-11-17 Sold (Public Records) $411,000 Public Records
- 2006-05-31 Sold (Public Records) $265,000 Public Records
- 1990-07-18 Sold (Public Records) $98,500 Public Records
Property tax history
+7.5%/yrLatest (2025): $3,528 · -2.3% YoY. Source: county tax records.
Cash-flow waterfall
monthlySold comps — $/sqft
last 12 mo · ≤1 miLoading sold comps…