23 C Oakview Ct · Atco, NJ
Flood risk No data
- FEMA flood zone
- —
- Chance of flooding over 30 yrs
- —
- Est. flood insurance / yr
- —
Fire risk No data
- Est. fire insurance / yr
- —
Heat risk No data
- Hot days now (above threshold)
- —
- Hot days in 30 yrs
- —
Wind risk No data
- Chance of severe wind over 30 yrs
- —
Air-quality risk No data
- Unhealthy air days now
- —
- Unhealthy air days in 30 yrs
- —
Risk factors via First Street. Map © Google.
Why this score? — see what drove the B- grade
The composite is a weighted blend of 9 inputs, each scored 0–100. Each bar is that input's sub-score; the figure is the points it added to the 100-point composite (weight × sub-score).
- Cash flow +30.0/30.0
- 1% rule +10.0/10.0
- DSCR +10.0/10.0
- ARV discount +7.5/15.0
- Schools +4.5/10.0
- Rent growth +2.5/5.0
- Livability +2.5/5.0
- Condition / age +2.2/5.0
- Appreciation +0.0/10.0
$69,900
🖨 Deal sheet (PDF) 📄 Offer letter ✓ Due diligence
Listing remarks
Charming 2-bedroom, 1-bath mobile home featuring several valuable upgrades and plenty of outdoor space. The home was converted to an efficient natural gas heating system approximately 12 years ago and includes central A/C for year-round comfort. Inside, you’ll find beautiful 3/4" Oak Tavern hardwood flooring, an electric stove, and a cozy wood-burning stove that adds warmth and character. Must be approved for tenancy by park management. The property also features a pitched shingle roof and sits on a large perimeter lot (lot rented), offering added privacy and outdoor potential. Conveniently located approximately 1 hour from Philadelphia and about 1.5 hours from the Jersey Shore,
Key facts
- Hardwood flooring
- Pitched shingle roof
- Wood-burning stove
Tags
Neighborhood map
What this means for you Summary
Snapshot
- This is a 2-bed/1.0-bath single-family listed at $70k. Condition is rated fair.
Deal economics
- At list price, monthly cash flow is $1k ($14k/yr) — positive.
- The deal already cash-flows at list — no discount required.
- Meets the 1% rule at list price ($2k rent vs $70k).
- Recommended offer: $68k (3.0% below list) — sets the bar for market timing.
- Cap rate 26.4% vs local median 4.0% in Atco — top-decile yield for the area; either an underpriced asset or a hidden risk that comps aren't pricing in. Stress-test before assuming the spread holds.
Location & tenants
- Location reads: area grade B — affects rentability + tenant quality, not the cash-flow math above.
- Lenape Regional High School District (suburban): math 34% / reading 60% proficiency, ranked #136 of 472 in NJ (top 29%) — families likely to look elsewhere, expect single-tenant / working-renter base with shorter leases.
- Zoned schools: Indian Mills Elementary School (math 32% / reading 47%, grade F, #471 of 1,303 statewide, top 39%, 368 students, 8% FRL); Indian Mills Memorial School (math 31% / reading 50%, grade F, #193 of 431 statewide, top 45%, 322 students, 10% FRL); Seneca High School (math 34% / reading 57%, grade D-, #138 of 399 statewide, top 36%, 1,018 students, 12% FRL).
- Market conditions: 161 active listings in the ZIP; 2,161 units permitted in Burlington County in 2024 (988 in 5+ unit buildings).
Forward outlook
- Local home prices are declining (-3.0%/yr); year-one equity from $483 of loan paydown is wiped out by about $2k of value loss. Plan a longer hold.
- Burlington County population projected to shrink 5% by 2050 — rents likely to lag national; underwrite the cash flow, not the appreciation.
- At projected returns (-3.0% appreciation + 3.0% rent growth), your $20k cash investment doubles in ~2 years — after that, you're playing with house money.
Negotiation context
- It's been on market 42 days — a 3% lower offer ($68k) is reasonable based on typical stale-listing flexibility.
Questions for the listing agent
- It's been on market 42 days. Have you received any prior offers? Is the seller open to a 3% concession, seller financing, or rate buy-down credit?
- Have any recent inspections been done? Can we get a copy of the seller's disclosures and any deferred-maintenance estimates?
- Built in 1979 — when were the roof, HVAC, electrical panel, plumbing, and water heater last replaced?
- Is there a deadline driving the sale (1031 exchange, divorce, estate, relocation)? That informs how much negotiation room exists.
- What's the average days-on-market for RENTAL listings here right now (not sales)? A rising rental-DOM trend means longer vacancies and softer asking-rent achievability than the comps imply.
- What's the recent tenant-quality profile in this submarket — average credit score on applications, eviction rate, late-payment / NSF rate, and stable-employment percentage? A property-management company in the area should have these aggregated.
- How much new for-sale + rental construction is in the pipeline within 1–3 miles? Heavy new supply typically softens prices + rents 12–24 months out; constrained supply supports both.
Investment metrics
- 1% rule
- 3.00% ✓
- Cap rate
- 26.42%
- Cash-on-cash
- 71.90%
- DSCR
- 4.20
- GRM
- 2.8
CMA / ARV
- ARV (on-the-fly)
- $37,312
- Comps found
- 1
Show comp detail 1 sale within ~0.75 mi
| Address | Dist | Beds/Ba | Sqft | Sold | Price | $/sf | Match |
|---|---|---|---|---|---|---|---|
| 4A Oakview Dr | 0.18mi | 2/1.5 | 800 (-6%) | 21mo | $35,000 | $44 | 62 |
Match score weights: distance 35% · size 25% · config 20% · recency 20%. Top-matched comps best support the ARV.
Projected returns pro-forma
-3.0% appreciation · 3.0% rent growth · sell at horizon
- IRR
- 71.6%
- Equity multiple
- 4.24×
- Total profit
- $63,392
- Equity at exit
- $10,422
- IRR
- 75.5%
- Equity multiple
- 8.74×
- Total profit
- $151,500
- Equity at exit
- $6,044
Cash invested: $19,572 (down + closing). Projections, not guarantees.
Landlord ↔ Tenant lean methodology
- Overall (STATE)
- 21 Tenant-Leaning
- State New Jersey
- 21 Tenant-Leaning · D+6
- County
- — inherits STATE
- City
- — inherits STATE
ZIP-level market 08088
- Active inventory
- 161
- Price-to-rent
- 2.8×
Monthly cashflow live
- Estimated rent
- $2,096 medium interval (Pro) →
- Mortgage (P&I)
- −$367
- Tax est. 1.5%
- −$87 /mo · $1,048/yr
- Insurance
- −$29
- HOA
- −$0
- Vacancy / Maint / Mgmt
- −$440
- Net cashflow
- $1,173
Break-even live
Sensitivity live
| Price | -10% $1,221 | -5% $1,197 | +0% $1,173 | +5% $1,148 | +10% $1,124 |
|---|---|---|---|---|---|
| Rent | -10% $1,007 | -5% $1,090 | +0% $1,173 | +5% $1,255 | +10% $1,338 |
| Rate | -1.0pp $1,208 | -0.5pp $1,190 | base $1,173 | +0.5pp $1,155 | +1.0pp $1,136 |
UW: 25.0% down · 7.5% · 30yr · 1.5% tax · 5.0% vac · 8.0% maint · 8.0% mgmt
Financing live
Cash to close
- Down payment
- $17,475
- Closing costs
- $2,097
- Reserves months
- —
- Total cash needed
- —
Loan-product check · same deal, 3 products live
Conventional
25% down · 7.5% · 30yr
- Down + closing
- —
- Monthly P&I
- —
- Monthly cashflow
- —
- DSCR
- —
- Eligible?
- —
Personal DTI + credit; lowest rate.
DSCR
20% down · 8.5% · 30yr
- Down + closing
- —
- Monthly P&I
- —
- Monthly cashflow
- —
- DSCR
- —
- Eligible?
- —
No personal income docs; deal must DSCR.
Hard money
10% down · 12.0% · 12mo
- Down + closing
- —
- Monthly P&I
- —
- Monthly cashflow
- —
- DSCR
- —
- Eligible?
- —
Short-term bridge; refi at stabilization.
Listing history 19 events
-
2026-06-21days on market $69,900 Active 42 DOM
-
2026-06-19days on market $69,900 Active 40 DOM
-
2026-06-18days on market $69,900 Active 39 DOM
-
2026-06-17days on market $69,900 Active 38 DOM
-
2026-06-16days on market $69,900 Active 37 DOM
-
2026-06-15days on market $69,900 Active 36 DOM
-
2026-06-13days on market $69,900 Active 34 DOM
-
2026-06-13days on market $69,900 Active 33 DOM
-
2026-06-10days on market $69,900 Active 31 DOM
-
2026-06-09days on market $69,900 Active 30 DOM
-
2026-06-08days on market $69,900 Active 29 DOM
-
2026-06-07days on market $69,900 Active 28 DOM
-
2026-06-04days on market $69,900 Active 25 DOM
-
2026-06-03days on market $69,900 Active 24 DOM
-
2026-06-02days on market $69,900 Active 23 DOM
-
2026-06-01days on market $69,900 Active 22 DOM
-
2026-05-31remarks 688-char remark
-
2026-05-31pricedays on market $69,900 Active 21 DOM
-
2026-05-26$62,700 Active
ⓘ Source: listings_history table (triggers on properties + properties_extension) + one-shot
backfill from property_details.listing_events for pre-trigger history.
Nearby sold comps map
Loading sold comps map…
Walkable amenities ~0.75 mi
Loading nearby amenities…
Taxation est. · year 1
- Rental income
- $25,150
- − Mortgage interest
- −$3,915
- − Property taxes
- −$1,048
- − Insurance
- −$350
- − Repairs & maintenance
- −$2,012
- − Management
- −$2,012
- − Depreciation
- −$2,033
- Taxable income
- $13,779
- Est. tax owed @ 24.0%
- −$3,307
- After-tax cash flow
- $10,765/yr
For passive investors: Depreciation is non-cash, so a rental often shows a tax loss while cash-flowing — sheltering income. Rental losses are passive: they offset passive income freely, and up to $25,000/yr can offset ordinary (W-2) income if you actively participate and your MAGI is under $100k (phasing out to $0 by $150k); unused losses carry forward. On sale, claimed depreciation is recaptured at up to 25%, and gains may owe capital-gains tax (a 1031 exchange can defer both). Figures are a year-1 estimate at your 24.0% rate — not tax advice; consult a CPA.
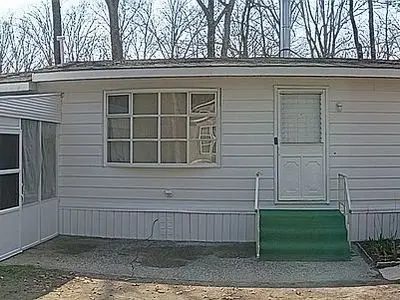
Condition & rehab AI · 2 photos
The home has fair exterior condition with peeling paint and weathered siding. Repainting and repairing the siding would significantly improve its appearance and value.
Repairs flagged
- Major siding — The siding is weathered and the paint is peeling.
- Major paint — The paint is peeling and the siding is weathered, indicating a need for repainting and possibly replacing the siding.
Value-add opportunities
- Both paint and siding repair — Repainting and repairing the siding will improve the home's curb appeal and increase its value for both resale and rental.
- Both landscaping — Landscaping can enhance the curb appeal and add value to the property, making it more attractive to potential buyers or renters.
Renovation cost estimate screening
| Repair item | Severity | Est. cost |
|---|---|---|
| siding · The siding is weathered and the paint is peeling. | Major | $15,000–50,000 |
| paint · The paint is peeling and the siding is weathered, indicating a need for repainting and possibly replacing the siding. | Major | $15,000–50,000 |
| Total estimated repair cost · 2 items | $30,000–100,000 |
Value-add ROI direction
- Both paint and siding repair — Repainting and repairing the siding will improve the home's curb appeal and increase its value for both resale and rental. ↑
- Both landscaping — Landscaping can enhance the curb appeal and add value to the property, making it more attractive to potential buyers or renters. ↑
ⓘ Cost ranges are severity-bucket heuristics (US national rule-of-thumb). Get contractor quotes + a written scope before underwriting a rehab budget.
Schools (NCES district)
- District
- Lenape Regional High School District
- NCES district ID
- 3408490
- Math proficiency
- 34% ▼ -2.00%
- Reading proficiency
- 60% ▼ -5.00%
- Median HH income
- $98,739
- Composite
- 44.86/100
- National rank
- #2724
- State rank
- #136 of 472 in NJ
Livability — Atco
No livability data for this city. (Only ~50 U.S. cities are tracked.)
Census & demographics
- City population
- 10,946
- Population (ZIP)
- 24,153
Population outlook (Burlington County) Hauer SSP2
- Today (2025)
- 453,425 people
- By 2030
- 452,359 · -0.2%
- By 2040
- 445,033 · -1.9%
- By 2050
- 431,760 · -4.8%
- By 2075
- 406,277 · -10.4%
- By 2100
- 364,732 · -19.6%
Race, ethnicity, and origin ACS 2023
- Neighborhood character
- Predominantly White (90%)
- Race & ethnicity
- White 90% Hispanic / Latino 4% Two or more races 4% Asian 2% Black 1%
- Common ancestry
- Romanian 8% Slovak 2% Iranian 2%
- Foreign-born
- 4% · Canada, China
- Languages at home
- 94% English-only · Spanish 3% Chinese 1%
Political lean MEDSL · Burlington
- 2024 margin
- D (+16.6) · D 57.6% · R 41.0% · Other 1.3%
- 2008→2024 swing
- -2.0pp toward R · 2008: 18.6pp · 2024: 16.6pp
- All cycles
- 2024: D+16.6 2020: D+19.5 2016: D+14.8 2012: D+18.7 2008: D+18.6
Not yet ingested
- Civics
- —
Market trends
- HPI YoY
- ▼ -214.45%
- Current HPI
- 302.9094
- Rent YoY
- —
- Metro
- —
- State GDP YoY
- ▲ 2.05%
- F500 in state
- 34
Industry mix (Fortune 500 HQ in NJ)
| Industry | F500 HQs | Revenue |
|---|---|---|
| Consumer Goods | 3 | $31B |
|
||
| Pharmaceuticals | 2 | $153B |
|
||
| Technology | 2 | $21B |
|
||
| Insurance | 2 | $20B |
|
||
| Healthcare | 2 | $19B |
|
||
| Financial Services | 1 | $70B |
|
||
Price history
1 event — show timeline
- 2026-05-26 Listed $62,700 FSBO.com
Cash-flow waterfall
monthlySold comps — $/sqft
last 12 mo · ≤1 miLoading sold comps…