13201 5th Ave · Middle Branch, MI
Flood risk 1/10 · Minimal
- FEMA flood zone
- —
- Chance of flooding over 30 yrs
- 0.0%
- Est. flood insurance / yr
- —
Fire risk 4/10 · Minor
- Est. fire insurance / yr
- $784 – $1,456
Heat risk 1/10 · Minimal
- Hot days now (above 94°F)
- 7 days/yr
- Hot days in 30 yrs
- 14 days/yr
Wind risk 1/10 · Minimal
- Chance of severe wind over 30 yrs
- —
Air-quality risk 2/10 · Minimal
- Unhealthy air days now
- 1 days/yr
- Unhealthy air days in 30 yrs
- 2 days/yr
Risk factors via First Street. Map © Google.
Why this score? — see what drove the C grade
The composite is a weighted blend of 9 inputs, each scored 0–100. Each bar is that input's sub-score; the figure is the points it added to the 100-point composite (weight × sub-score).
- Cash flow +19.2/30.0
- Appreciation +10.0/10.0
- ARV discount +7.5/15.0
- DSCR +6.1/10.0
- 1% rule +5.1/10.0
- Schools +3.8/10.0
- Rent growth +2.5/5.0
- Livability +2.5/5.0
- Condition / age +2.5/5.0
$86,900
🖨 Deal sheet 📄 Offer letter ✓ Due diligence
Listing remarks MLS
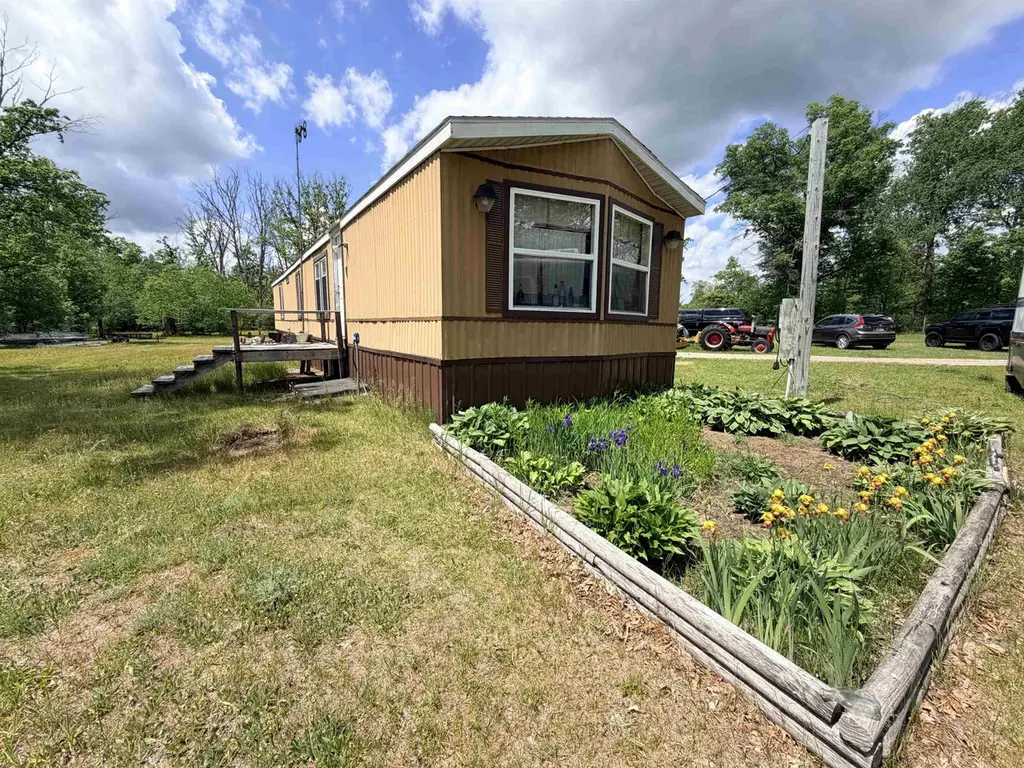
Enjoy country living and endless outdoor recreation with this property situated on 3.6 fully fenced acres. Located just one mile from the Muskegon River and surrounded by nearby state land, this is an ideal location for hunting, fishing, trail riding, and enjoying all that Northern Michigan has to offer. The property also offers a 24' x 24' detached pole barn/garage provides ample space for vehicles, equipment, and outdoor toys. Two 40-foot shipping containers are also available and negotiable with the sale, offering additional storage options. Whether you're looking for a year-round residence, hunting retreat, or recreational getaway, this property is ready for your next adventure.
Key facts
- Fully fenced acres
- Ideal location
- Detached pole barn
Tags
Property features AI
Exterior
- Parking: Detached 2-car garage
- Utilities: Private well water; Septic tank
- Home design: Single-family residence; Residential property
- Construction: Aluminum siding; Approximately 980 above-grade finished square feet
- Exterior features: Fenced property
Interior
- Bathrooms: 1 full bathroom; 1 half bathroom
- Heating & cooling: Forced air heating (propane); Ceiling fans; Exhaust fan; Window air conditioning units
- Interior features: 5 total rooms; Fenced yard
Neighborhood map
What this means for you Summary
Snapshot
- This is a 2-bed/1.5-bath single-family listed at $87k.
Deal economics
- At list price, monthly cash flow is $94 ($1k/yr) — positive.
- The deal already cash-flows at list — no discount required.
- Meets the 1% rule at list price ($879 rent vs $87k).
Location & tenants
- Location reads: area grade C — affects rentability + tenant quality, not the cash-flow math above.
- Marion Public Schools (rural): math 33% / reading 53% proficiency, ranked #328 of 760 in MI (top 43%) — families likely to look elsewhere, expect single-tenant / working-renter base with shorter leases.
- Market conditions: 33 active listings in the ZIP; 5 units permitted in Osceola County in 2024 (0 in 5+ unit buildings).
Forward outlook
- In year one you build about $9k of equity ($601 loan paydown + $9k appreciation (10.0% local appreciation)).
- Osceola County population projected at -24% by 2050 — secular population decline; favor cash flow + early exit over multi-decade hold.
- At projected returns (10.0% appreciation + 3.0% rent growth), your $24k cash investment doubles in ~3 years — after that, you're playing with house money.
- By year 4, paydown + projected appreciation supports a ~$33k cash-out refi (75% LTV) — recoverable capital for the next deal without selling this one.
Negotiation context
- Only 7 days on market — expect competitive offers; lowballing is unlikely to land.
- 2 sale attempts with the ask held roughly flat each time — persistent listings suggest the price (not the market) is what's stuck; bring a comps-based counter.
- Current owner paid $70k; 24% above their basis — modest negotiation headroom, anchor on the comps not their cost.
Questions for the listing agent
- Is there a deadline driving the sale (1031 exchange, divorce, estate, relocation)? That informs how much negotiation room exists.
- What's the average days-on-market for RENTAL listings here right now (not sales)? A rising rental-DOM trend means longer vacancies and softer asking-rent achievability than the comps imply.
- What's the recent tenant-quality profile in this submarket — average credit score on applications, eviction rate, late-payment / NSF rate, and stable-employment percentage? A property-management company in the area should have these aggregated.
- How much new for-sale + rental construction is in the pipeline within 1–3 miles? Heavy new supply typically softens prices + rents 12–24 months out; constrained supply supports both.
Investment metrics
- 1% rule
- 1.01% ✓
- Cap rate
- 7.59%
- Cash-on-cash
- 4.64%
- DSCR
- 1.21
- GRM
- 8.2
CMA / ARV
- ARV (on-the-fly)
- $177,380
- Comps found
- 3
Show comp detail 3 sales within ~0.75 mi
| Address | Dist | Beds/Ba | Sqft | Sold | Price | $/sf | Match |
|---|---|---|---|---|---|---|---|
| 13105 N 5th Ave | 0.12mi | 3/1.0 (+1) | 1,080 (+10%) | 20mo | $195,000 | $181 | 54 |
| 12620 M 115 Hwy | 0.62mi | 1/1.0 (-1) | 1,060 (+8%) | 6mo | $199,900 | $189 | 45 |
| 307 13 Mile Rd | 0.41mi | 2/1.0 | 1,122 (+14%) | 15mo | $74,000 | $66 | 43 |
Match score weights: distance 35% · size 25% · config 20% · recency 20%. Top-matched comps best support the ARV.
Projected returns pro-forma
10.0% appreciation · 3.0% rent growth · sell at horizon
- IRR
- 27.6%
- Equity multiple
- 3.19×
- Total profit
- $53,330
- Equity at exit
- $78,286
- IRR
- 24.1%
- Equity multiple
- 7.26×
- Total profit
- $152,364
- Equity at exit
- $168,828
Cash invested: $24,332 (down + closing). Projections, not guarantees.
Landlord ↔ Tenant lean methodology
- Overall (STATE)
- 62 Landlord-Friendly
- State Michigan
- 62 Landlord-Friendly · EVEN
- County
- — inherits STATE
- City
- — inherits STATE
ZIP-level market 49665
- Home prices YoY
- 11.3%
- Active inventory
- 33
- Price-to-rent
- 8.2×
Monthly cashflow live
- Estimated rent
- $879 medium interval (Pro) →
- Mortgage (P&I)
- −$456
- Tax est. 1.5%
- −$109 /mo · $1,304/yr
- Insurance
- −$36
- HOA
- −$0
- Vacancy / Maint / Mgmt
- −$185
- Net cashflow
- $94
Break-even live
UW: 25.0% down · 7.5% · 30yr · 1.5% tax · 5.0% vac · 8.0% maint · 8.0% mgmt
Financing live
Cash to close
- Down payment
- $21,725
- Closing costs
- $2,607
- Reserves months
- —
- Total cash needed
- —
Loan-product check · same deal, 3 products live
Conventional
25% down · 7.5% · 30yr
- Down + closing
- —
- Monthly P&I
- —
- Monthly cashflow
- —
- DSCR
- —
- Eligible?
- —
Personal DTI + credit; lowest rate.
DSCR
20% down · 8.5% · 30yr
- Down + closing
- —
- Monthly P&I
- —
- Monthly cashflow
- —
- DSCR
- —
- Eligible?
- —
No personal income docs; deal must DSCR.
Hard money
10% down · 12.0% · 12mo
- Down + closing
- —
- Monthly P&I
- —
- Monthly cashflow
- —
- DSCR
- —
- Eligible?
- —
Short-term bridge; refi at stabilization.
Listing history 7 events
-
2026-06-18days on market $86,900 Active 7 DOM
-
2026-06-17days on market $86,900 Active 6 DOM
-
2026-06-16days on market $86,900 Active 5 DOM
-
2026-06-15days on market $86,900 Active 4 DOM
-
2026-06-13days on market $86,900 Active 2 DOM
-
2026-06-12remarks 691-char remark
-
2026-06-12$86,900 Active 1 DOM
ⓘ Source: listings_history table (triggers on properties + properties_extension) + one-shot
backfill from property_details.listing_events for pre-trigger history.
Climate risk First Street
- Flood 1/10 Low 0% chance over 30 yrs
- Wildfire 4/10 Moderate
- Heat 1/10 Low 7 d/yr ≥94°F today · 14 d/yr by 30 yrs out
- Wind 1/10 Low
- Air quality 2/10 Low 1 unhealthy d/yr today · 2 by 30 yrs out
Nearby sold comps map
Loading sold comps map…
Walkable amenities ~0.75 mi
Loading nearby amenities…
Taxation est. · year 1
- Rental income
- $10,550
- − Mortgage interest
- −$4,868
- − Property taxes
- −$1,304
- − Insurance
- −$434
- − Repairs & maintenance
- −$844
- − Management
- −$844
- − Depreciation
- −$2,528
- Taxable loss
- −$271
- Est. tax savings @ 24.0%
- +$65
- After-tax cash flow
- $1,193/yr
For passive investors: Depreciation is non-cash, so a rental often shows a tax loss while cash-flowing — sheltering income. Rental losses are passive: they offset passive income freely, and up to $25,000/yr can offset ordinary (W-2) income if you actively participate and your MAGI is under $100k (phasing out to $0 by $150k); unused losses carry forward. On sale, claimed depreciation is recaptured at up to 25%, and gains may owe capital-gains tax (a 1031 exchange can defer both). Figures are a year-1 estimate at your 24.0% rate — not tax advice; consult a CPA.
Schools (NCES district)
- District
- Marion Public Schools
- NCES district ID
- 2622800
- Math proficiency
- 33% ▲ 16.00%
- Reading proficiency
- 53% ▲ 31.00%
- Median HH income
- $35,461
- Composite
- 37.86/100
- National rank
- #8710
- State rank
- #328 of 760 in MI
Livability — Middle Branch
No livability data for this city. (Only ~50 U.S. cities are tracked.)
Census & demographics
- Population (ZIP)
- 4,022
Population outlook (Osceola County) Hauer SSP2
- Today (2025)
- 21,724 people
- By 2030
- 20,769 · -4.4%
- By 2040
- 18,720 · -13.8%
- By 2050
- 16,611 · -23.5%
- By 2075
- 11,942 · -45.0%
- By 2100
- 7,546 · -65.3%
Race, ethnicity, and origin ACS 2023
- Neighborhood character
- Predominantly White (94%)
- Race & ethnicity
- White 94% Hispanic / Latino 3% Two or more races 3%
- Common ancestry
- Iranian 11% Romanian 3% Lithuanian 2%
- Foreign-born
- 0%
- Languages at home
- 94% English-only · German/W. Germanic 5% Spanish 1%
Political lean MEDSL · Osceola
- 2024 margin
- Solid R (+47.9) · D 25.2% · R 73.1% · Other 1.7%
- 2008→2024 swing
- -37.7pp toward R · 2008: -10.1pp · 2024: -47.9pp
- All cycles
- 2024: R+47.9 2020: R+46.3 2016: R+43.7 2012: R+21.0 2008: R+10.1
Not yet ingested
- Civics
- —
Market trends
- HPI YoY
- ▲ 26.88%
- Current HPI
- 264.0932
- Rent YoY
- —
- Metro
- —
- State GDP YoY
- ▲ 1.37%
- F500 in state
- 28
Industry mix (Fortune 500 HQ in MI)
| Industry | F500 HQs | Revenue |
|---|---|---|
| Automotive Parts | 3 | $48B |
|
||
| Automotive | 2 | $372B |
|
||
| Chemicals | 1 | $45B |
|
||
| Automotive Retail | 1 | $29B |
|
||
| Healthcare / Medical Devices | 1 | $23B |
|
||
| Automotive Technology | 1 | $20B |
|
||
Price history
+24.1% since first listed3 events — show timeline
- 2026-06-11 Listed $86,900 REALCOMP
- 2026-06-11 Listed $86,900 MiRealSource-MiMLS
- 2005-09-23 Sold (Public Records) $70,000 Public Records
Cash-flow waterfall
monthlySold comps — $/sqft
last 12 mo · ≤1 miLoading sold comps…