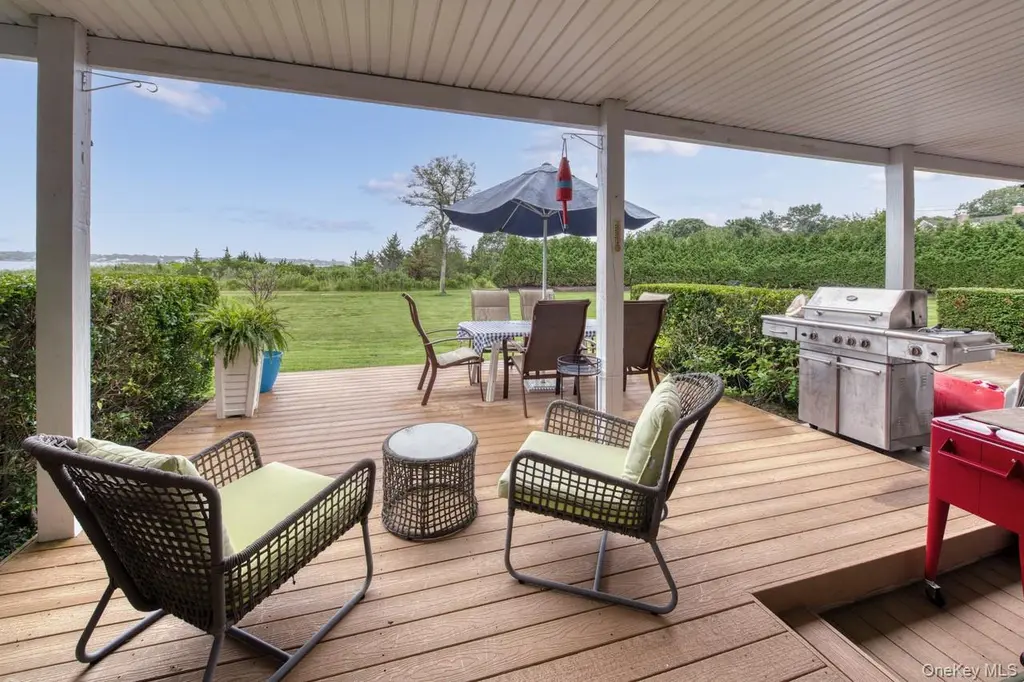
61 W Tiana Rd #6 · Hampton Bays, NY
Flood risk No data
- FEMA flood zone
- —
- Chance of flooding over 30 yrs
- —
- Est. flood insurance / yr
- —
Fire risk No data
- Est. fire insurance / yr
- —
Heat risk No data
- Hot days now (above threshold)
- —
- Hot days in 30 yrs
- —
Wind risk No data
- Chance of severe wind over 30 yrs
- —
Air-quality risk No data
- Unhealthy air days now
- —
- Unhealthy air days in 30 yrs
- —
Risk factors via First Street. Map © Google.
Why this score? — see what drove the B grade
The composite is a weighted blend of 9 inputs, each scored 0–100. Each bar is that input's sub-score; the figure is the points it added to the 100-point composite (weight × sub-score).
- Cash flow +28.7/30.0
- DSCR +10.0/10.0
- 1% rule +9.6/10.0
- ARV discount +7.5/15.0
- Rent growth +5.0/5.0
- Schools +4.0/10.0
- Livability +3.4/5.0
- Condition / age +2.5/5.0
- Appreciation +0.0/10.0
$575,000
🖨 Deal sheet 📄 Offer letter ✓ Due diligence
Listing remarks MLS
This sun-drenched 2-bedroom, 1-bath waterfront co-op is one floor living and unit is on the first floor! It perfectly positioned with direct access to the beach and your own private dock slip for boats and water is perfectly positioned with direct access to the beach and your own private dock slip. Nestled in a coveted community, this light-filled residence offers open-concept living and dining areas, a sleek kitchen, and serene water views from nearly every room. Step outside onto your private back patio and enjoy resort-style amenities including a heated swimming pool, tennis courts, and a stylish clubhouse ideal for entertaining or relaxing after a day on the water. Whether you're lounging on the private beach, setting out for a sunset sail, or hosting guests in the clubhouse, this home offers an unparalleled lifestyle just minutes from village shops, dining, and everything the Hamptons has to offer.
Key facts
- Waterfront co-op
- Private dock slip
- Tennis courts
Tags
Neighborhood map
What this means for you Summary
Snapshot
- This is a 2-bed/1.0-bath condo listed at $575k.
Deal economics
- At list price, monthly cash flow is $2k ($23k/yr) — positive.
- The deal already cash-flows at list — no discount required.
- Meets the 1% rule at list price ($8k rent vs $575k).
- Recommended offer: $540k (6.0% below list) — sets the bar for market timing.
- Cap rate 10.3% vs local median 6.4% in Hampton Bays — top-decile yield for the area; either an underpriced asset or a hidden risk that comps aren't pricing in. Stress-test before assuming the spread holds.
Location & tenants
- Location reads 68/100 on livability (#551 in NY) — a middle-class / working-renter tenant base. Strengths: crime A+, employment A+, health & safety B+; Watch: amenities F, commute F, cost of living F.
- Hampton Bays Union Free School District (suburban): math 45% / reading 44% proficiency, ranked #434 of 590 in NY (top 74%) — families likely to look elsewhere, expect single-tenant / working-renter base with shorter leases.
- Market conditions: Rents rising fast (+16.1%/yr); 172 active listings in the ZIP; high-income renter base; 1,366 units permitted in Suffolk County in 2024 (216 in 5+ unit buildings).
- At $8,418/mo this rent would consume 75% of the median local household income ($134k/yr) (locally 199% of renters already pay >50% of income on rent) — very limited rent-growth headroom before tenants either downsize or default.
Forward outlook
- Local home prices are declining (-3.0%/yr); year-one equity from $4k of loan paydown is wiped out by about $17k of value loss. Plan a longer hold.
- Suffolk County population projected to shrink 5% by 2050 — rents likely to lag national; underwrite the cash flow, not the appreciation.
- At projected returns (-3.0% appreciation + 8.0% rent growth), your $161k cash investment doubles in ~6 years — after that, you're playing with house money.
Negotiation context
- It's been on market 81 days — a 6% lower offer ($540k) is reasonable based on typical stale-listing flexibility.
- 5 sale attempts since 14y ago with the ask held roughly flat each time — persistent listings suggest the price (not the market) is what's stuck; bring a comps-based counter.
- Current owner paid $215k; list at $575k implies a 167% gain — meaningful room to come down on a strong offer.
Questions for the listing agent
- It's been on market 81 days. Have you received any prior offers? Is the seller open to a 6% concession, seller financing, or rate buy-down credit?
- What does the HOA fee cover, when was the last increase, and are there any pending special assessments or reserve-fund shortfalls?
- Any open or pending special assessments — roof, HVAC, plumbing, elevator, façade? What's the per-unit balance and payoff schedule, and is the seller paying it off at close or rolling it to the buyer?
- Why hasn't it sold? Are there any deal-killer items the seller is aware of (foundation, flood, title, zoning, code violations)?
- Is there a deadline driving the sale (1031 exchange, divorce, estate, relocation)? That informs how much negotiation room exists.
- Schools are B-rated — typically a magnet for longer-tenancy family renters. What's the average tenant stay here, and is there a school-zone premium baked into asking?
- What's the average days-on-market for RENTAL listings here right now (not sales)? A rising rental-DOM trend means longer vacancies and softer asking-rent achievability than the comps imply.
- What's the recent tenant-quality profile in this submarket — average credit score on applications, eviction rate, late-payment / NSF rate, and stable-employment percentage? A property-management company in the area should have these aggregated.
- How much new apartment / multifamily construction is in the pipeline within 1–3 miles? Heavy new supply (>2% of stock underway) typically softens rents 12–24 months out; light construction supports rent growth.
Investment metrics
- 1% rule
- 1.46% ✓
- Cap rate
- 10.29%
- Cash-on-cash
- 14.26%
- DSCR
- 1.63
- GRM
- 5.7
CMA / ARV
No comps found within radius.
Projected returns pro-forma
-3.0% appreciation · 8.0% rent growth · sell at horizon
- IRR
- 10.9%
- Equity multiple
- 1.46×
- Total profit
- $73,757
- Equity at exit
- $85,734
- IRR
- 24.0%
- Equity multiple
- 3.65×
- Total profit
- $426,018
- Equity at exit
- $49,715
Cash invested: $161,000 (down + closing). Projections, not guarantees.
Landlord ↔ Tenant lean methodology
- Overall (STATE)
- 15 Strongly Tenant-Friendly
- State New York
- 15 Strongly Tenant-Friendly · D+10
- County
- — inherits STATE
- City
- — inherits STATE
ZIP-level market 11946
- Home prices YoY
- -20.3%
- Rents YoY
- 16.1%
- Active inventory
- 172
- Price-to-rent
- 5.7×
Monthly cashflow live
- Estimated rent
- $8,418 medium interval (Pro) →
- Mortgage (P&I)
- −$3,015
- Tax est. 1.5%
- −$719 /mo · $8,625/yr
- Insurance
- −$240
- HOA
- −$763
- Vacancy / Maint / Mgmt
- −$1,768
- Net cashflow
- $1,913
Break-even live
UW: 25.0% down · 7.5% · 30yr · 1.5% tax · 5.0% vac · 8.0% maint · 8.0% mgmt
Financing live
Cash to close
- Down payment
- $143,750
- Closing costs
- $17,250
- Reserves months
- —
- Total cash needed
- —
Loan-product check · same deal, 3 products live
Conventional
25% down · 7.5% · 30yr
- Down + closing
- —
- Monthly P&I
- —
- Monthly cashflow
- —
- DSCR
- —
- Eligible?
- —
Personal DTI + credit; lowest rate.
DSCR
20% down · 8.5% · 30yr
- Down + closing
- —
- Monthly P&I
- —
- Monthly cashflow
- —
- DSCR
- —
- Eligible?
- —
No personal income docs; deal must DSCR.
Hard money
10% down · 12.0% · 12mo
- Down + closing
- —
- Monthly P&I
- —
- Monthly cashflow
- —
- DSCR
- —
- Eligible?
- —
Short-term bridge; refi at stabilization.
HOA detail condo
- Monthly dues
- $763 · $9,156/yr
- Likely covers
- waterpool
- Assessments
- None detected in remarks — confirm with the listing agent.
Listing history 16 events
-
2026-06-04days on market $575,000 Active 81 DOM
-
2026-06-03days on market $575,000 Active 80 DOM
-
2026-06-02days on market $575,000 Active 79 DOM
-
2026-06-01days on market $575,000 Active 78 DOM
-
2026-05-31days on market $575,000 Active 77 DOM
-
2026-03-13$575,000 Active 917-char remark
Show marketing remark (917 chars)
This sun-drenched 2-bedroom, 1-bath waterfront co-op is one floor living and unit is on the first floor! It perfectly positioned with direct access to the beach and your own private dock slip for boats and water is perfectly positioned with direct access to the beach and your own private dock slip. Nestled in a coveted community, this light-filled residence offers open-concept living and dining areas, a sleek kitchen, and serene water views from nearly every room. Step outside onto your private back patio and enjoy resort-style amenities including a heated swimming pool, tennis courts, and a stylish clubhouse ideal for entertaining or relaxing after a day on the water. Whether you're lounging on the private beach, setting out for a sunset sail, or hosting guests in the clubhouse, this home offers an unparalleled lifestyle just minutes from village shops, dining, and everything the Hamptons has to offer.
-
2026-01-24historical
-
2025-10-22price $599,000
-
2025-10-09price $625,000
-
2025-07-23$649,000 Active
-
2013-11-08soldstatus $215,000 Closed
-
2013-11-08soldstatus $215,000
-
2013-01-16$239,000 New
-
2013-01-16$239,000
-
2012-07-04historical
-
2012-04-04$219,000
ⓘ Source: listings_history table (triggers on properties + properties_extension) + one-shot
backfill from property_details.listing_events for pre-trigger history.
Nearby sold comps map
Loading sold comps map…
Walkable amenities ~0.75 mi
Loading nearby amenities…
Taxation est. · year 1
- Rental income
- $101,011
- − Mortgage interest
- −$32,209
- − Property taxes
- −$8,625
- − Insurance
- −$2,875
- − Repairs & maintenance
- −$8,081
- − Management
- −$8,081
- − HOA
- −$9,156
- − Depreciation
- −$16,727
- Taxable income
- $15,257
- Est. tax owed @ 24.0%
- −$3,662
- After-tax cash flow
- $19,296/yr
For passive investors: Depreciation is non-cash, so a rental often shows a tax loss while cash-flowing — sheltering income. Rental losses are passive: they offset passive income freely, and up to $25,000/yr can offset ordinary (W-2) income if you actively participate and your MAGI is under $100k (phasing out to $0 by $150k); unused losses carry forward. On sale, claimed depreciation is recaptured at up to 25%, and gains may owe capital-gains tax (a 1031 exchange can defer both). Figures are a year-1 estimate at your 24.0% rate — not tax advice; consult a CPA.
Schools (NCES district)
- District
- Hampton Bays Union Free School District
- NCES district ID
- 3613530
- Math proficiency
- 45% ▼ -8.00%
- Reading proficiency
- 44% ▼ -1.00%
- Median HH income
- $70,274
- Composite
- 40.18/100
- National rank
- #3788
- State rank
- #434 of 590 in NY
Livability — Hampton Bays
- Score
- 68/100
- State rank
- #551
- US rank
- #9894
Category grades
Schools grade is shown separately in the Schools card above.
Census & demographics
- Census place
- Hampton Bays, NY
- County
- Suffolk County · 679,920 people
- City population
- 15,819
- Metro
- New York-Newark-Jersey City, NY-NJ-PA
- Population (ZIP)
- 15,819
- Household income
- $133,918
- Rent vs Own
- Severe rent burden
- 199.0
Population outlook (Suffolk County) Hauer SSP2
- Today (2025)
- 1,505,262 people
- By 2030
- 1,498,318 · -0.5%
- By 2040
- 1,471,101 · -2.3%
- By 2050
- 1,424,848 · -5.3%
- By 2075
- 1,337,157 · -11.2%
- By 2100
- 1,217,720 · -19.1%
Race, ethnicity, and origin ACS 2023
- Neighborhood character
- Majority White (62%)
- Race & ethnicity
- White 62% Hispanic / Latino 32% Two or more races 13% Asian 3% Black 2%
- Hispanic origin (detail)
- Mexican 6%
- Common ancestry
- Romanian 4% Slovak 2% Portuguese 2%
- Foreign-born
- 26% · Canada, Jamaica, Guatemala
- Languages at home
- 64% English-only · Spanish 29% Other Indo-European 2% French/Haitian/Cajun 2%
Political lean MEDSL · Suffolk
- 2024 margin
- Lean R (+10.0) · D 45.0% · R 55.0%
- 2008→2024 swing
- -16.0pp toward R · 2008: 6.0pp · 2024: -10.0pp
- All cycles
- 2024: R+10.0 2020: R+0.0 2016: R+8.2 2012: D+2.9 2008: D+6.0
Not yet ingested
- Civics
- —
Market trends
- HPI YoY
- ▼ -118.82%
- Current HPI
- 467.2466
- Rent YoY
- ▲ 16.07%
- Metro
- New York-Newark-Jersey City, NY-NJ-PA
- State GDP YoY
- ▲ 2.60%
- F500 in state
- 92
Industry mix (Fortune 500 HQ in NY)
| Industry | F500 HQs | Revenue |
|---|---|---|
| Financial Services | 10 | $950B |
|
||
| Consumer Goods | 9 | $162B |
|
||
| Insurance | 4 | $225B |
|
||
| Telecommunications | 2 | $144B |
|
||
| Pharmaceuticals | 2 | $112B |
|
||
| Media / Entertainment | 2 | $69B |
|
||
Price history
+162.6% since first listed11 events — show timeline
- 2026-03-13 Listed $575,000 OneKey® MLS as Distributed by MLS Grid
- 2026-01-24 Listing Removed — OneKey® MLS as Distributed by MLS Grid
- 2025-10-22 Price Changed $599,000 OneKey® MLS as Distributed by MLS Grid
- 2025-10-09 Price Changed $625,000 OneKey® MLS as Distributed by MLS Grid
- 2025-07-23 Listed $649,000 OneKey® MLS as Distributed by MLS Grid
- 2013-11-08 Sold (MLS) $215,000 OneKey® MLS as Distributed by MLS Grid
- 2013-11-08 Sold (MLS) $215,000 MLSLI
- 2013-01-16 Listed $239,000 MLSLI
- 2013-01-16 Listed $239,000 OneKey® MLS as Distributed by MLS Grid
- 2012-07-04 Listing Removed — OneKey® MLS as Distributed by MLS Grid
- 2012-04-04 Listed $219,000 OneKey® MLS as Distributed by MLS Grid
Cash-flow waterfall
monthlySold comps — $/sqft
last 12 mo · ≤1 miLoading sold comps…