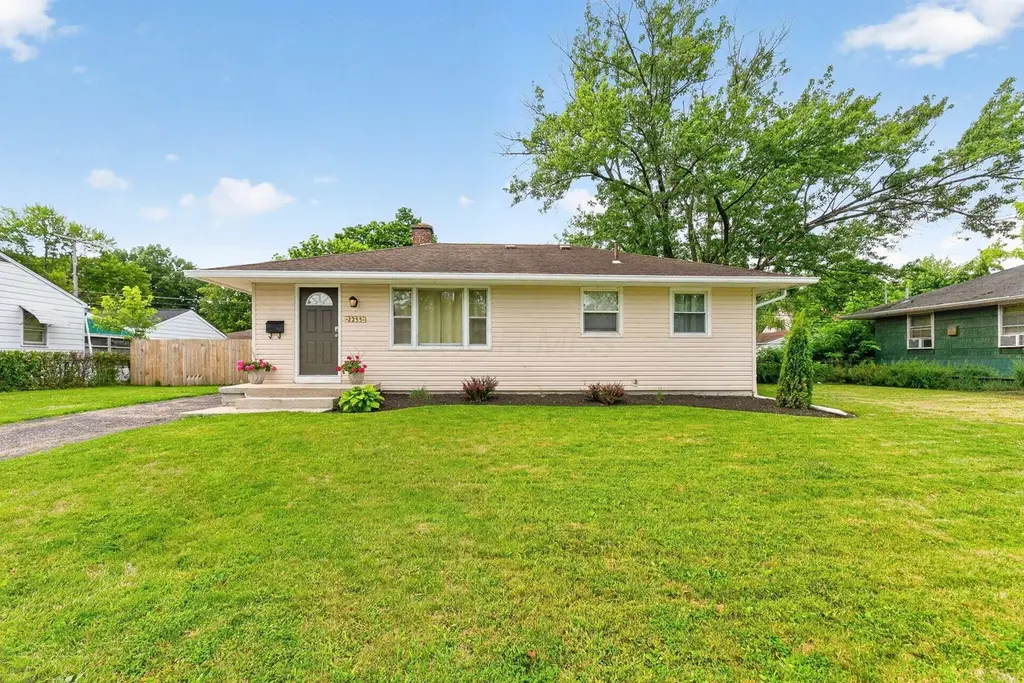
2255 Fenton St · Columbus, OH
Flood risk 1/10 · Minimal
- FEMA flood zone
- X (unshaded)
- Chance of flooding over 30 yrs
- 0.0%
- Est. flood insurance / yr
- $473 – $860
Fire risk 1/10 · Minimal
- Est. fire insurance / yr
- $713 – $1,323
Heat risk 3/10 · Minor
- Hot days now (above 99°F)
- 7 days/yr
- Hot days in 30 yrs
- 18 days/yr
Wind risk 2/10 · Minimal
- Chance of severe wind over 30 yrs
- 1.0%
Air-quality risk 3/10 · Minor
- Unhealthy air days now
- 3 days/yr
- Unhealthy air days in 30 yrs
- 4 days/yr
Risk factors via First Street. Map © Google.
Why this score? — see what drove the C- grade
The composite is a weighted blend of 9 inputs, each scored 0–100. Each bar is that input's sub-score; the figure is the points it added to the 100-point composite (weight × sub-score).
- ARV discount +15.0/15.0
- Cash flow +14.9/30.0
- 1% rule +4.9/10.0
- DSCR +4.6/10.0
- Livability +4.0/5.0
- Rent growth +3.5/5.0
- Condition / age +2.5/5.0
- Schools +1.7/10.0
- Appreciation +0.0/10.0
$125,000
🖨 Deal sheet (PDF) 📄 Offer letter ✓ Due diligence
Listing remarks MLS
This beautiful one story home in Beaumont is move-in ready! Hardwood floors have been finished throughout the living room and all 3 bedrooms (4 including the one in the lower level). Kitchen has been updated and features new cabinets, counters, tile backsplash, and stainless steel appliances! Full bath has new vanity, mirror, toilet, & ceramic tile flooring. Freshly painted interior, most of the lighting & blinds are brand new. Basement has a rec room and and second room that could be used as an office or whatever use you choose! Covered patio is perfect for enjoying the outdoors. Large backyard is fenced and has a shed for additional storage.
Key facts
- New h2o tank
- New downspouts
- New gutters
Tags
Property features AI
Finance
- HOA & community: Sidewalks in the community
Exterior
- Utilities: Public water; Public sewer
- Home design: Single-family residence; One story; Built in 1958; No shared/common walls
- Construction: Block foundation
- Exterior features: Deck; Fenced yard; Shed(s) on property
Interior
- Bedrooms: Three main-level bedrooms
- Flooring: Wood flooring; Ceramic/porcelain flooring
- Bathrooms: One full bathroom
- Heating & cooling: Forced-air heating; Wall cooling units
- Interior features: Insulated windows throughout; Full basement
Neighborhood map
What this means for you Summary
Snapshot
- This is a 3-bed/1.0-bath single-family listed at $125k.
Deal economics
- At list price, monthly cash flow is $37 ($438/yr) — positive.
- The deal already cash-flows at list — no discount required.
- To meet the 1% rule (rent ≥ 1% of price), the offer needs to be $124k (0.6% below list).
- Recommended offer: $124k (0.6% below list) — sets the bar for 1% rule.
- Cap rate 6.6% vs local median 3.8% in Columbus — top-decile yield for the area; either an underpriced asset or a hidden risk that comps aren't pricing in. Stress-test before assuming the spread holds.
Location & tenants
- Location reads 81/100 on livability (#97 in OH, #1,491 nationally) — a professional / high-income tenant draw. Strengths: commute A+, cost of living A+, housing A+; Watch: employment C-, crime F.
- Columbus City School District (urban): math 15% / reading 26% proficiency, ranked #626 of 656 in OH (top 95%) — low school quality limits family demand, transient renter base, plan for 1-2y turnover; 72% free/reduced lunch — lower-income household profile, screen leases tightly.
- Zoned schools: Indianola Informal K-8 School (math 43% / reading 58%, grade D+, #896 of 1,584 statewide, top 57%, 684 students, 0% FRL); Arts Impact Middle School (Aims) (math 17% / reading 25%, grade F, #608 of 654 statewide, top 93%, 532 students, 0% FRL); Columbus Alternative High School (math 27% / reading 74%, grade D+, #380 of 781 statewide, top 49%, 758 students, 0% FRL) — zoned schools average 0% FRL vs 72% district-wide (72 pts lower); this property's tenant base skews higher-income than the district average.
- Zoned-school proficiency averages 41% at this address vs 20% district-wide (+20 pts) — the actual schools serving this property are materially stronger than the Columbus City School District average implies; a family-tenant draw the district grade alone would hide.
- Market conditions: Rents rising fast (+4.2%/yr); 101 active listings in the ZIP; 30 comparable units currently listed for rent nearby; rentals at typical pace (median 26d on market — plan ~3-4 weeks tenant-placement turnaround); 43% of comp listings sitting > 30 days — soft ceiling on asking rent; 8,139 units permitted in Franklin County in 2024 (5,940 in 5+ unit buildings).
Forward outlook
- Local home prices are declining (-3.0%/yr); year-one equity from $864 of loan paydown is wiped out by about $4k of value loss. Plan a longer hold.
- Franklin County population projected at +34% by 2050 — long-run rental-demand tailwind backs the buy-and-hold thesis.
Negotiation context
- Only 12 days on market — expect competitive offers; lowballing is unlikely to land.
- 8 sale attempts since 32y ago with the ask held roughly flat each time — persistent listings suggest the price (not the market) is what's stuck; bring a comps-based counter.
- Current owner paid $92k; 36% above their basis — modest negotiation headroom, anchor on the comps not their cost.
Risks & watch-outs
- Watch-outs: built in 1958 — expect roof / HVAC / electrical / plumbing capex.
Questions for the listing agent
- Built in 1958 — when were the roof, HVAC, electrical panel, plumbing, and water heater last replaced?
- Is there a deadline driving the sale (1031 exchange, divorce, estate, relocation)? That informs how much negotiation room exists.
- Crime grade is F in this area — have there been break-ins, vandalism, or insurance claims at this property in the last 3 years? What carrier currently insures it and at what premium?
- What's the average days-on-market for RENTAL listings here right now (not sales)? A rising rental-DOM trend means longer vacancies and softer asking-rent achievability than the comps imply.
- What's the recent tenant-quality profile in this submarket — average credit score on applications, eviction rate, late-payment / NSF rate, and stable-employment percentage? A property-management company in the area should have these aggregated.
- How much new for-sale + rental construction is in the pipeline within 1–3 miles? Heavy new supply typically softens prices + rents 12–24 months out; constrained supply supports both.
Investment metrics
- 1% rule
- 0.99% ✗
- Cap rate
- 6.64%
- Cash-on-cash
- 1.25%
- DSCR
- 1.06
- GRM
- 8.4
CMA / ARV
- ARV (on-the-fly)
- $199,728
- Comps found
- 12
Show comp detail 12 sales within ~0.75 mi
| Address | Dist | Beds/Ba | Sqft | Sold | Price | $/sf | Match |
|---|---|---|---|---|---|---|---|
| 2298 Belcher Dr | 0.16mi | 3/1.0 | 914 (+0%) | 2mo | $210,000 | $230 | 90 |
| 2208 Fenton St | 0.07mi | 3/2.0 | 912 (0%) | 6mo | $199,900 | $219 | 88 |
| 2144 Colfax Ave | 0.18mi | 3/1.0 | 914 (+0%) | 6mo | $205,560 | $225 | 86 |
| 2283 Ward Rd | 0.24mi | 3/1.0 | 936 (+3%) | 3mo | $236,000 | $252 | 82 |
| 4217 Hickman Rd | 0.23mi | 2/1.0 (-1) | 914 (+0%) | 6mo | $186,000 | $204 | 79 |
| 4123 Arbury Ln | 0.42mi | 3/1.0 | 959 (+5%) | 1mo | $205,000 | $214 | 70 |
| 2583 Milverton Way | 0.51mi | 3/1.0 | 959 (+5%) | 3mo | $162,500 | $169 | 65 |
| 2045 Sale Rd | 0.41mi | 2/1.5 (-1) | 864 (-5%) | 2mo | $145,000 | $168 | 63 |
| 4211 Chesford Rd | 0.71mi | 3/1.0 | 925 (+1%) | 1mo | $208,000 | $225 | 63 |
| 1734 Ferris Rd | 0.73mi | 3/1.0 | 914 (+0%) | 4mo | $196,000 | $214 | 62 |
| 2091 Radnor Ave | 0.58mi | 3/1.0 | 864 (-5%) | 7mo | $210,000 | $243 | 58 |
| 2547 Ferris Park Dr S | 0.53mi | 3/1.0 | 1,008 (+10%) | 4mo | $121,000 | $120 | 54 |
Match score weights: distance 35% · size 25% · config 20% · recency 20%. Top-matched comps best support the ARV.
Projected returns pro-forma
-3.0% appreciation · 4.16% rent growth · sell at horizon
- IRR
- -12.8%
- Equity multiple
- 0.53×
- Total profit
- $-16,394
- Equity at exit
- $18,638
- IRR
- -1.9%
- Equity multiple
- 0.86×
- Total profit
- $-4,840
- Equity at exit
- $10,808
Cash invested: $35,000 (down + closing). Projections, not guarantees.
Landlord ↔ Tenant lean methodology
- Overall (STATE)
- 73 Landlord-Friendly
- State Ohio
- 73 Landlord-Friendly · R+6
- County
- — inherits STATE
- City
- — inherits STATE
ZIP-level market 43224
- Rents YoY
- 4.2%
- Active inventory
- 101
- Price-to-rent
- 8.4×
Monthly cashflow live
- Estimated rent
- $1,242 high interval (Pro) →
- Mortgage (P&I)
- −$656
- Tax from tax record
- −$237 /mo · $2,847/yr
- Insurance
- −$52
- HOA
- −$0
- Vacancy / Maint / Mgmt
- −$261
- Net cashflow
- $37
Break-even live
Sensitivity live
| Price | -10% $107 | -5% $72 | +0% $37 | +5% $1 | +10% $-34 |
|---|---|---|---|---|---|
| Rent | -10% $-62 | -5% $-13 | +0% $37 | +5% $86 | +10% $135 |
| Rate | -1.0pp $99 | -0.5pp $68 | base $37 | +0.5pp $4 | +1.0pp $-29 |
UW: 25.0% down · 7.5% · 30yr · 1.5% tax · 5.0% vac · 8.0% maint · 8.0% mgmt
Financing live
Cash to close
- Down payment
- $31,250
- Closing costs
- $3,750
- Reserves months
- —
- Total cash needed
- —
Loan-product check · same deal, 3 products live
Conventional
25% down · 7.5% · 30yr
- Down + closing
- —
- Monthly P&I
- —
- Monthly cashflow
- —
- DSCR
- —
- Eligible?
- —
Personal DTI + credit; lowest rate.
DSCR
20% down · 8.5% · 30yr
- Down + closing
- —
- Monthly P&I
- —
- Monthly cashflow
- —
- DSCR
- —
- Eligible?
- —
No personal income docs; deal must DSCR.
Hard money
10% down · 12.0% · 12mo
- Down + closing
- —
- Monthly P&I
- —
- Monthly cashflow
- —
- DSCR
- —
- Eligible?
- —
Short-term bridge; refi at stabilization.
Rent comps 30 comps
| Address | Beds | Baths | Sqft | Rent | $/sqft | DOM | Units | Dist |
|---|---|---|---|---|---|---|---|---|
| 2419 Belcher Dr Unit 2419 Columbus, OH | 2.0 | 1.0 | 1038 | $950 | $0.92 | 45d | 1 | 0.17mi |
| 4224 Concord Ln Columbus, OH | 1.0–2.0 | 1.0 | 962 | $1,200 | $1.25 | 45d | 1 | 0.18mi |
| 2300 Fitzroy Pl S Columbus, OH | 2.0 | 1.0 | 825 | $1,149 | $1.39 | 9d | 10 | 0.20mi |
| 4241 Cleveland Ave Unit 1 Columbus, OH | 2.0 | 1.0 | 1100 | $1,200 | $1.09 | 45d | 1 | 0.22mi |
| 2414 Timber Trail Dr N Columbus, OH | 2.0 | 1.0 | 1008 | $1,295 | $1.28 | 45d | 2 | 0.29mi |
| 2162 Fitzroy Dr Unit 2162 A2 Columbus, OH | 2.0 | 1.0 | 1038 | $899 | $0.87 | 25d | 1 | 0.31mi |
| 4370 Le Marie Ct Columbus, OH | 1.0–3.0 | 1.0–1.5 | 670 | $1,525 | $2.28 | 45d | 8 | 0.42mi |
| 4314 Dresden St Columbus, OH | 1.0–3.0 | 1.0–1.5 | 732 | $1,449 | $1.98 | 3d | 9 | 0.59mi |
| 4565 Northland Square Dr E Columbus, OH | 1.0–2.0 | 1.0–1.5 | 842 | $1,390 | $1.65 | 45d | 2 | 0.59mi |
| 4426 Calderwood Dr Columbus, OH | 1.0–2.0 | 1.0 | 850 | $2,530 | $2.98 | 17d | 1 | 0.68mi |
| 1748 Ward Rd Columbus, OH | 3.0 | 1.0 | 914 | $1,425 | $1.56 | 25d | 1 | 0.71mi |
| 1699 Shanley Dr Columbus, OH | 1.0–3.0 | 1.0–2.0 | 800 | $1,519 | $1.90 | 3d | 45 | 0.79mi |
| 2132 Elmore Ave Columbus, OH | 3.0 | 1.0 | 1000 | $1,245 | $1.25 | 25d | 1 | 0.84mi |
| 1900 Sunny Ct Columbus, OH | 1.0–3.0 | 1.0–1.5 | 863 | $1,299 | $1.51 | 25d | 1 | 0.86mi |
| 4646 Tamarack Blvd Columbus, OH | 1.0–4.0 | 1.0–2.0 | 989 | $1,662 | $1.68 | 25d | 1 | 0.91mi |
| 4187 Beechwold Dr Columbus, OH | 2.0 | 1.0–1.5 | 952 | $1,237 | $1.30 | 3d | 10 | 0.99mi |
| 2976 Sandridge Ave Unit 2992 Columbus, OH | 2.0 | 1.0 | 1000 | $899 | $0.90 | 45d | 1 | 1.05mi |
| 2976 Sandridge Ave #3069 Columbus, OH | 2.0 | 1.0 | 1000 | $899 | $0.90 | 46d | 1 | 1.06mi |
| 3998 Stonegate Sq W Columbus, OH | 1.0–2.0 | 1.0 | 872 | $1,100 | $1.26 | 45d | 5 | 1.08mi |
| 4451 Karl Rd Columbus, OH | 2.0 | 1.0 | 595 | $1,148 | $1.93 | 5d | 3 | 1.09mi |
| 1691 Red Robin Rd Columbus, OH | 2.0 | 1.0 | 800 | $1,125 | $1.41 | 45d | 1 | 1.09mi |
| 4117 Karl Rd #304 Columbus, OH | 2.0 | 2.0 | 966 | $1,100 | $1.14 | 14d | 1 | 1.10mi |
| 2766 Stonehenge Dr Columbus, OH | 2.0 | 1.0 | 880 | $899 | $1.02 | 25d | 1 | 1.11mi |
| 4141 Karl Rd #109 Columbus, OH | 2.0 | 2.0 | 966 | $975 | $1.01 | 25d | 1 | 1.14mi |
| 3039 Morsetowne Ct N Columbus, OH | 2.0 | 1.0 | 896 | $995 | $1.11 | 45d | 1 | 1.15mi |
| 1633 Red Robin Rd Columbus, OH | 2.0–3.0 | 1.0–1.5 | 1040 | $1,510 | $1.45 | 45d | 1 | 1.22mi |
| 1517 Elmore Ave Columbus, OH | 2.0 | 1.0 | 720 | $1,600 | $2.22 | 16d | 1 | 1.24mi |
| 1449 Elmore Ave Columbus, OH | 2.0 | 1.0 | 850 | $1,025 | $1.21 | 16d | 1 | 1.28mi |
| 3257 Cleveland Ave Apt C Columbus, OH | 2.0 | 1.0 | 975 | $1,000 | $1.03 | 45d | 1 | 1.41mi |
| 3327 Morse Rd Unit 3335 Columbus, OH | 2.0 | 1.0 | 950 | $1,100 | $1.16 | 21d | 1 | 1.42mi |
Listing history 9 events
-
2026-06-21days on market $125,000 Active 12 DOM
-
2026-06-18days on market $125,000 Active 9 DOM
-
2026-06-17days on market $125,000 Active 8 DOM
-
2026-06-16days on market $125,000 Active 7 DOM
-
2026-06-15days on market $125,000 Active 6 DOM
-
2026-06-13days on market $125,000 Active 4 DOM
-
2026-06-13days on market $125,000 Active 3 DOM
-
2026-06-10remarks 628-char remark
-
2026-06-10$125,000 Active 1 DOM
ⓘ Source: listings_history table (triggers on properties + properties_extension) + one-shot
backfill from property_details.listing_events for pre-trigger history.
Tax reassessment forecast OH · Partial reset (capped growth)
- Current annual tax
- $2,847 · $237/mo
- Projected year-2 tax
- $2,847 · $237/mo
- Expected delta
- $0/yr ($0/mo · 0.0%)
ⓘ Screening estimate from a state-policy table — verify with the county assessor before closing.
Climate risk First Street
- Flood 1/10 Low FEMA zone X (unshaded) · 0% chance over 30 yrs
- Wildfire 1/10 Low
- Heat 3/10 Moderate 7 d/yr ≥99°F today · 18 d/yr by 30 yrs out
- Wind 2/10 Low 100% chance of damaging wind over 30 yrs
- Air quality 3/10 Moderate 3 unhealthy d/yr today · 4 by 30 yrs out
Nearby sold comps map
Loading sold comps map…
Walkable amenities ~0.75 mi
Loading nearby amenities…
Taxation est. · year 1
- Rental income
- $14,907
- − Mortgage interest
- −$7,002
- − Property taxes
- −$2,847
- − Insurance
- −$625
- − Repairs & maintenance
- −$1,193
- − Management
- −$1,193
- − Depreciation
- −$3,636
- Taxable loss
- −$1,589
- Est. tax savings @ 24.0%
- +$381
- After-tax cash flow
- $820/yr
For passive investors: Depreciation is non-cash, so a rental often shows a tax loss while cash-flowing — sheltering income. Rental losses are passive: they offset passive income freely, and up to $25,000/yr can offset ordinary (W-2) income if you actively participate and your MAGI is under $100k (phasing out to $0 by $150k); unused losses carry forward. On sale, claimed depreciation is recaptured at up to 25%, and gains may owe capital-gains tax (a 1031 exchange can defer both). Figures are a year-1 estimate at your 24.0% rate — not tax advice; consult a CPA.
Schools (NCES district)
- District
- Columbus City School District
- NCES district ID
- 3904380
- Math proficiency
- 15% ▼ -17.00%
- Reading proficiency
- 26% ▼ -12.00%
- Median HH income
- $38,483
- Composite
- 17.19/100
- National rank
- #9105
- State rank
- #626 of 656 in OH
Livability — Columbus
- Score
- 81/100
- State rank
- #97
- US rank
- #1491
Category grades
Schools grade is shown separately in the Schools card above.
Census & demographics
- Census place
- Columbus, OH
- County
- Franklin County · 1,351,780 people
- City population
- 612,189
- Metro
- Columbus, OH
- Population (ZIP)
- 44,319
- Household income
- $53,321
- Rent vs Own
- Severe rent burden
- 1730.0
Population outlook (Franklin County) Hauer SSP2
- Today (2025)
- 1,456,139 people
- By 2030
- 1,556,890 · +6.9%
- By 2040
- 1,757,349 · +20.7%
- By 2050
- 1,950,539 · +34.0%
- By 2075
- 2,376,171 · +63.2%
- By 2100
- 2,636,796 · +81.1%
Race, ethnicity, and origin ACS 2023
- Neighborhood character
- Diverse neighborhood (Simpson 0.66)
- Race & ethnicity
- Black 43% White 39% Hispanic / Latino 10% Two or more races 9% Asian 2%
- Hispanic origin (detail)
- Mexican 6% Dominican 1%
- Common ancestry
- Romanian 1% Hispanic 1% Italian 1%
- Foreign-born
- 22% · Canada, Vietnam
- Languages at home
- 71% English-only · Spanish 8% French/Haitian/Cajun 4% Arabic 1%
Political lean MEDSL · Franklin
- 2024 margin
- Strong D (+28.4) · D 63.7% · R 35.3% · Other 1.0%
- 2008→2024 swing
- +7.7pp toward D · 2008: 20.7pp · 2024: 28.4pp
- All cycles
- 2024: D+28.4 2020: D+31.4 2016: D+25.9 2012: D+21.7 2008: D+20.7
Not yet ingested
- Civics
- —
Market trends
- HPI YoY
- ▼ -226.58%
- Current HPI
- 274.6336
- Rent YoY
- ▲ 4.16%
- Metro
- Columbus, OH
- State GDP YoY
- ▲ 1.98%
- F500 in state
- 48
Industry mix (Fortune 500 HQ in OH)
| Industry | F500 HQs | Revenue |
|---|---|---|
| Insurance | 3 | $145B |
|
||
| Industrial Machinery | 3 | $49B |
|
||
| Financial Services | 3 | $24B |
|
||
| Consumer Goods | 2 | $93B |
|
||
| Aerospace / Defense | 2 | $47B |
|
||
| Utilities | 2 | $33B |
|
||
Price history
+119.3% since first listed27 events — show timeline
- 2026-06-09 Listed $125,000 CBRMLS
- 2018-03-14 Sold (Public Records) $92,000 Public Records
- 2018-03-05 Sold (MLS) $92,000 CBRMLS
- 2018-02-03 Contingent — CBRMLS
- 2018-01-30 Relisted — CBRMLS
- 2018-01-30 Listing Removed — CBRMLS
- 2018-01-30 Relisted — CBRMLS
- 2018-01-18 Contingent — CBRMLS
- 2018-01-12 Listed $94,900 CBRMLS
- 2003-05-06 Sold (Public Records) $77,000 Public Records
- 2002-05-24 Sold (Public Records) $90,000 Public Records
- 2002-05-20 Sold (MLS) $89,999 CBRMLS
- 2002-05-19 Listing Removed — CBRMLS
- 2002-03-19 Listed $89,999 CBRMLS
- 2002-02-08 Sold (MLS) $60,000 CBRMLS
- 2002-01-10 Listing Removed — CBRMLS
- 2001-10-12 Listed $66,000 CBRMLS
- 1997-04-28 Sold (Public Records) $70,900 Public Records
- 1997-04-28 Sold (Public Records) $70,900 Public Records
- 1997-04-24 Sold (MLS) $70,900 CBRMLS
- 1997-03-08 Listing Removed — CBRMLS
- 1997-02-10 Listed $70,700 CBRMLS
- 1995-02-03 Sold (Public Records) $66,700 Public Records
- 1995-01-31 Sold (MLS) $66,700 CBRMLS
- 1995-01-09 Listing Removed — CBRMLS
- 1994-09-27 Listed $65,700 CBRMLS
- 1991-07-19 Sold (Public Records) $57,000 Public Records
Property tax history
+8.0%/yrLatest (2024): $2,847 · +1.3% YoY. Source: county tax records.
Cash-flow waterfall
monthlySold comps — $/sqft
last 12 mo · ≤1 miLoading sold comps…