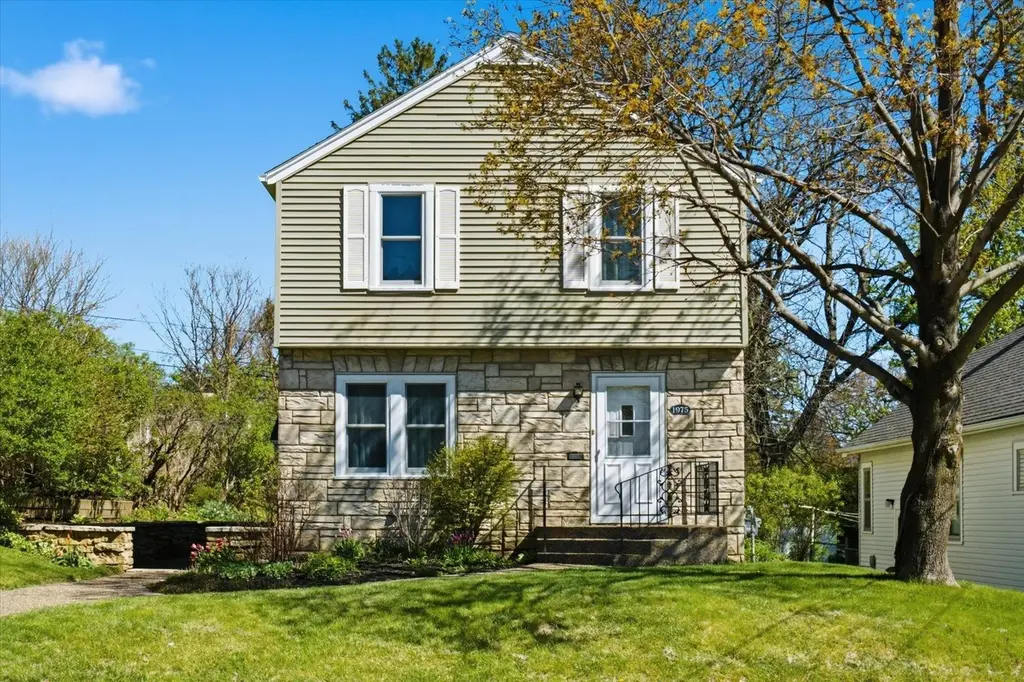
1975 Hale St · Dubuque, IA
Flood risk 1/10 · Minimal
- FEMA flood zone
- X (unshaded)
- Chance of flooding over 30 yrs
- 0.0%
- Est. flood insurance / yr
- $473 – $860
Fire risk 1/10 · Minimal
- Est. fire insurance / yr
- $902 – $1,676
Heat risk 3/10 · Minor
- Hot days now (above 101°F)
- 7 days/yr
- Hot days in 30 yrs
- 15 days/yr
Wind risk 2/10 · Minimal
- Chance of severe wind over 30 yrs
- —
Air-quality risk 2/10 · Minimal
- Unhealthy air days now
- 1 days/yr
- Unhealthy air days in 30 yrs
- 2 days/yr
Risk factors via First Street. Map © Google.
Why this score? — see what drove the D+ grade
The composite is a weighted blend of 9 inputs, each scored 0–100. Each bar is that input's sub-score; the figure is the points it added to the 100-point composite (weight × sub-score).
- ARV discount +15.0/15.0
- Cash flow +8.9/30.0
- Schools +5.5/10.0
- Livability +4.5/5.0
- Rent growth +3.9/5.0
- DSCR +2.5/10.0
- Condition / age +2.5/5.0
- 1% rule +2.4/10.0
- Appreciation +0.0/10.0
$235,000
🖨 Deal sheet (PDF) 📄 Offer letter ✓ Due diligence
Listing remarks
Well-maintained and 2-story home in Dubuque offering 4 bedrooms and 3 bathrooms and over 2000sqft of finished space. The main floor features a primary bedroom with en-suite bath, convenient stackable laundry hookup, and a spacious eat-in kitchen highlighted by beautiful exposed beams. A finished lower level provides additional living space, ideal for a second living room, rec area, or home office. Upstairs bedrooms feature original hardwood flooring, with additional hardwoods located beneath the carpet on the stairs and main level. Updated beautiful Pella wood windows are installed throughout the home, providing great natural light and efficiency. Exterior features include a large brick-pav
Key facts
- En-suite bath
- Exposed beams
- Primary bedroom
Tags
Neighborhood map
What this means for you Summary
Snapshot
- This is a 4-bed/3.5-bath single-family listed at $235k.
Deal economics
- At list price, monthly cash flow is $-190 ($-2k/yr) — negative.
- To cash-flow at today's rent, offer at most $202k (14.2% below list).
- To meet the 1% rule (rent ≥ 1% of price), the offer needs to be $173k (26.2% below list).
- Recommended offer: $173k (26.2% below list) — sets the bar for 1% rule.
- Cap rate 5.3% vs local median 3.5% in Dubuque — top-decile yield for the area; either an underpriced asset or a hidden risk that comps aren't pricing in. Stress-test before assuming the spread holds.
Location & tenants
- Location reads 89/100 on livability (#7 in IA, #119 nationally) — a professional / high-income tenant draw. Strengths: amenities A+, commute A+, cost of living A+; Watch: crime C-.
- Dubuque Community School District (urban): math 63% / reading 65% proficiency, ranked #205 of 289 in IA (top 71%) — acceptable for families but not a draw, mixed tenant base, ~2y average lease.
- Zoned schools: Irving Elementary School (math 72% / reading 62%, grade B+, #273 of 616 statewide, top 51%, 418 students, 43% FRL); George Washington Middle School (math 63% / reading 65%, grade B+, #166 of 246 statewide, top 68%, 624 students, 50% FRL); Dubuque Senior High School (math 63% / reading 74%, grade B, #181 of 336 statewide, top 54%, 1,435 students, 36% FRL).
- Market conditions: Rents rising fast (+5.6%/yr); 234 active listings in the ZIP; 3 comparable units currently listed for rent nearby; rentals lingering (median 46d on market — plan ~5-8 weeks vacancy on turnover, expect pricing pressure); 100% of comp listings sitting > 30 days — soft ceiling on asking rent; 473 units permitted in Dubuque County in 2024 (319 in 5+ unit buildings).
- This rent runs 34% of the median local income ($62k/yr) — at the standard rent-burdened threshold; future hikes will face affordability resistance.
Forward outlook
- Local home prices are declining (-3.0%/yr); year-one equity from $2k of loan paydown is wiped out by about $7k of value loss. Plan a longer hold.
- Dubuque County population projected at +13% by 2050 — modest demand growth; plan on rents tracking national, not racing it.
Negotiation context
- Only 1 days on market — expect competitive offers; lowballing is unlikely to land.
Risks & watch-outs
- Watch-outs: built in 1949 — expect roof / HVAC / electrical / plumbing capex.
Questions for the listing agent
- What do current leases actually rent for vs. the listed asking? Can we see a recent rent roll and the last 12 months of T-12 income?
- Built in 1949 — when were the roof, HVAC, electrical panel, plumbing, and water heater last replaced?
- Is there a deadline driving the sale (1031 exchange, divorce, estate, relocation)? That informs how much negotiation room exists.
- Schools are B-rated — typically a magnet for longer-tenancy family renters. What's the average tenant stay here, and is there a school-zone premium baked into asking?
- The area grade is low — what's the realistic commute time and amenity access for the typical tenant pool here? Any planned neighborhood developments (good or bad) we should know about?
- What's the average days-on-market for RENTAL listings here right now (not sales)? A rising rental-DOM trend means longer vacancies and softer asking-rent achievability than the comps imply.
- What's the recent tenant-quality profile in this submarket — average credit score on applications, eviction rate, late-payment / NSF rate, and stable-employment percentage? A property-management company in the area should have these aggregated.
- How much new for-sale + rental construction is in the pipeline within 1–3 miles? Heavy new supply typically softens prices + rents 12–24 months out; constrained supply supports both.
Investment metrics
- 1% rule
- 0.74% ✗
- Cap rate
- 5.33%
- Cash-on-cash
- -3.46%
- DSCR
- 0.85
- GRM
- 11.3
CMA / ARV
- ARV (on-the-fly)
- $322,580
- Comps found
- 12
Show comp detail 12 sales within ~0.75 mi
| Address | Dist | Beds/Ba | Sqft | Sold | Price | $/sf | Match |
|---|---|---|---|---|---|---|---|
| 1985 Marion St | 0.33mi | 4/2.5 | 2,712 (+7%) | 8mo | $316,000 | $117 | 62 |
| 1098 W 5th St | 0.56mi | 5/3.0 (+1) | 2,480 (-2%) | 8mo | $247,000 | $100 | 56 |
| 1537 Irving St | 0.42mi | 3/2.0 (-1) | 2,469 (-3%) | 10mo | $279,000 | $113 | 56 |
| 1095 Mount Pleasant St | 0.47mi | 3/2.5 (-1) | 2,677 (+5%) | 9mo | $382,000 | $143 | 53 |
| 2422 University Ave | 0.46mi | 4/1.5 | 2,324 (-8%) | 4mo | $238,000 | $102 | 52 |
| 285 N Grandview Ave | 0.15mi | 4/1.5 | 2,187 (-14%) | 11mo | $330,000 | $151 | 52 |
| 2425 Green St | 0.67mi | 5/2.5 (+1) | 2,476 (-2%) | 4mo | $331,500 | $134 | 52 |
| 2160 Simpson St | 0.63mi | 4/2.0 | 2,657 (+5%) | 9mo | $340,000 | $128 | 49 |
| 2637 Nebraska St | 0.70mi | 3/2.0 (-1) | 2,420 (-5%) | 2mo | $266,000 | $110 | 47 |
| 298 Princeton Pl | 0.42mi | 3/2.0 (-1) | 2,848 (+12%) | 11mo | $350,000 | $123 | 40 |
| 2155 Simpson St | 0.60mi | 3/3.5 (-1) | 2,884 (+14%) | 5mo | $380,000 | $132 | 40 |
| 1110 Langworthy St | 0.65mi | 4/1.5 | 2,792 (+10%) | 8mo | $355,000 | $127 | 39 |
Match score weights: distance 35% · size 25% · config 20% · recency 20%. Top-matched comps best support the ARV.
Projected returns pro-forma
-3.0% appreciation · 5.63% rent growth · sell at horizon
- IRR
- -19.3%
- Equity multiple
- 0.31×
- Total profit
- $-45,453
- Equity at exit
- $35,039
- IRR
- -7.5%
- Equity multiple
- 0.47×
- Total profit
- $-34,778
- Equity at exit
- $20,319
Cash invested: $65,800 (down + closing). Projections, not guarantees.
Landlord ↔ Tenant lean methodology
- Overall (STATE)
- 83 Strongly Landlord-Friendly
- State Iowa
- 83 Strongly Landlord-Friendly · R+6
- County
- — inherits STATE
- City
- — inherits STATE
ZIP-level market 52001
- Rents YoY
- 5.6%
- Active inventory
- 234
- Price-to-rent
- 11.3×
Monthly cashflow live
- Estimated rent
- $1,734 medium interval (Pro) →
- Mortgage (P&I)
- −$1,232
- Tax from tax record
- −$229 /mo · $2,752/yr
- Insurance
- −$98
- HOA
- −$0
- Vacancy / Maint / Mgmt
- −$364
- Net cashflow
- $-190
Break-even live
Sensitivity live
| Price | -10% $-56 | -5% $-123 | +0% $-190 | +5% $-256 | +10% $-323 |
|---|---|---|---|---|---|
| Rent | -10% $-327 | -5% $-258 | +0% $-190 | +5% $-121 | +10% $-52 |
| Rate | -1.0pp $-71 | -0.5pp $-130 | base $-190 | +0.5pp $-250 | +1.0pp $-312 |
UW: 25.0% down · 7.5% · 30yr · 1.5% tax · 5.0% vac · 8.0% maint · 8.0% mgmt
Financing live
Cash to close
- Down payment
- $58,750
- Closing costs
- $7,050
- Reserves months
- —
- Total cash needed
- —
Loan-product check · same deal, 3 products live
Conventional
25% down · 7.5% · 30yr
- Down + closing
- —
- Monthly P&I
- —
- Monthly cashflow
- —
- DSCR
- —
- Eligible?
- —
Personal DTI + credit; lowest rate.
DSCR
20% down · 8.5% · 30yr
- Down + closing
- —
- Monthly P&I
- —
- Monthly cashflow
- —
- DSCR
- —
- Eligible?
- —
No personal income docs; deal must DSCR.
Hard money
10% down · 12.0% · 12mo
- Down + closing
- —
- Monthly P&I
- —
- Monthly cashflow
- —
- DSCR
- —
- Eligible?
- —
Short-term bridge; refi at stabilization.
Rent comps 3 comps
| Address | Beds | Baths | Sqft | Rent | $/sqft | DOM | Units | Dist |
|---|---|---|---|---|---|---|---|---|
| 500 Hill St Unit 2 Dubuque, IA | 3.0 | 1.0 | 1900 | $1,910 | $1.01 | 45d | 1 | 0.87mi |
| 597 Jefferson St Rm 3 Dubuque, IA | 5.0 | 2.0 | 1800 | $550 | $0.31 | 45d | 1 | 0.98mi |
| 1199 Central Ave Unit 302 Dubuque, IA | 4.0 | 3.0 | 2339 | $2,850 | $1.22 | 45d | 1 | 1.39mi |
Listing history 2 events
-
2026-04-24status Pending
-
2026-04-23$235,000 Active
ⓘ Source: listings_history table (triggers on properties + properties_extension) + one-shot
backfill from property_details.listing_events for pre-trigger history.
Tax reassessment forecast IA · Partial reset (capped growth)
- Current annual tax
- $2,752 · $229/mo
- Projected year-2 tax
- $3,221 · $268/mo
- Expected delta
- +$469/yr (+$39/mo · 17.0%)
ⓘ Screening estimate from a state-policy table — verify with the county assessor before closing.
Climate risk First Street
- Flood 1/10 Low FEMA zone X (unshaded) · 0% chance over 30 yrs
- Wildfire 1/10 Low
- Heat 3/10 Moderate 7 d/yr ≥101°F today · 15 d/yr by 30 yrs out
- Wind 2/10 Low
- Air quality 2/10 Low 1 unhealthy d/yr today · 2 by 30 yrs out
Nearby sold comps map
Loading sold comps map…
Walkable amenities ~0.75 mi
Loading nearby amenities…
Taxation est. · year 1
- Rental income
- $20,812
- − Mortgage interest
- −$13,164
- − Property taxes
- −$2,752
- − Insurance
- −$1,175
- − Repairs & maintenance
- −$1,665
- − Management
- −$1,665
- − Depreciation
- −$6,836
- Taxable loss
- −$6,445
- Est. tax savings @ 24.0%
- +$1,547
- After-tax cash flow
- $-727/yr
For passive investors: Depreciation is non-cash, so a rental often shows a tax loss while cash-flowing — sheltering income. Rental losses are passive: they offset passive income freely, and up to $25,000/yr can offset ordinary (W-2) income if you actively participate and your MAGI is under $100k (phasing out to $0 by $150k); unused losses carry forward. On sale, claimed depreciation is recaptured at up to 25%, and gains may owe capital-gains tax (a 1031 exchange can defer both). Figures are a year-1 estimate at your 24.0% rate — not tax advice; consult a CPA.
Schools (NCES district)
- District
- Dubuque Community School District
- NCES district ID
- 1909480
- Math proficiency
- 63% ▼ -7.00%
- Reading proficiency
- 65% ▼ -1.00%
- Median HH income
- $51,237
- Composite
- 54.51/100
- National rank
- #1345
- State rank
- #205 of 289 in IA
Livability — Dubuque
- Score
- 89/100
- State rank
- #7
- US rank
- #119
Category grades
Schools grade is shown separately in the Schools card above.
Census & demographics
- Census place
- Dubuque, IA
- County
- Dubuque County · 60,106 people
- City population
- 60,106
- Metro
- Dubuque, IA
- Population (ZIP)
- 43,101
- Household income
- $61,643
- Rent vs Own
- Severe rent burden
- 1940.0
Population outlook (Dubuque County) Hauer SSP2
- Today (2025)
- 103,359 people
- By 2030
- 106,472 · +3.0%
- By 2040
- 112,043 · +8.4%
- By 2050
- 116,553 · +12.8%
- By 2075
- 128,014 · +23.9%
- By 2100
- 132,892 · +28.6%
Race, ethnicity, and origin ACS 2023
- Neighborhood character
- Predominantly White (84%)
- Race & ethnicity
- White 84% Two or more races 6% Black 5% Hispanic / Latino 4% Asian 1% Pacific Islander 1%
- Common ancestry
- Portuguese 3% Italian 2% Lithuanian 2%
- Foreign-born
- 4% · Canada, China
- Languages at home
- 95% English-only · Spanish 3% Tagalog/Filipino 1% Other Asian/Pacific 1%
Political lean MEDSL · Dubuque
- 2024 margin
- Lean R (+8.6) · D 45.1% · R 53.7% · Other 1.2%
- 2008→2024 swing
- -29.4pp toward R · 2008: 20.8pp · 2024: -8.6pp
- All cycles
- 2024: R+8.6 2020: R+2.9 2016: R+1.2 2012: D+14.5 2008: D+20.8
Not yet ingested
- Civics
- —
Market trends
- HPI YoY
- ▼ -156.36%
- Current HPI
- 173.5536
- Rent YoY
- ▲ 5.63%
- Metro
- Dubuque, IA
- State GDP YoY
- ▲ 2.48%
- F500 in state
- 4
Industry mix (Fortune 500 HQ in IA)
| Industry | F500 HQs | Revenue |
|---|---|---|
| Financial Services | 1 | $16B |
|
||
| Retail / Convenience | 1 | $15B |
|
||
Price history
2 events — show timeline
- 2026-04-24 Pending — ECIMLS
- 2026-04-23 Listed $235,000 ECIMLS
Property tax history
+2.7%/yrLatest (2025): $2,752 · +3.0% YoY. Source: county tax records.
Cash-flow waterfall
monthlySold comps — $/sqft
last 12 mo · ≤1 miLoading sold comps…