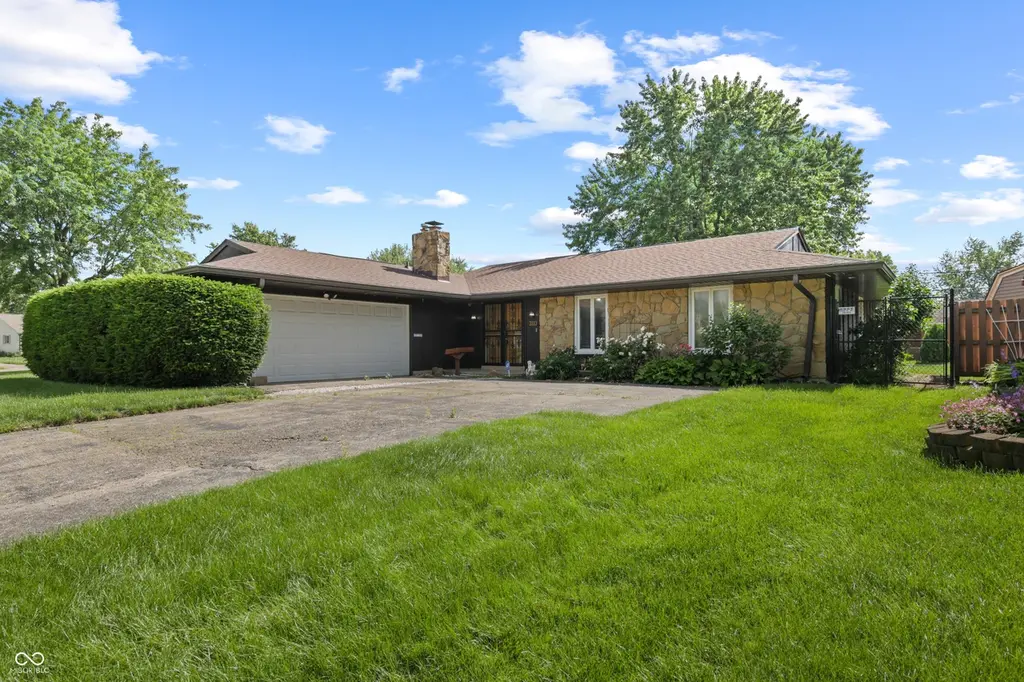
3113 Lupine Dr · Indianapolis city (balance), IN
Flood risk 1/10 · Minimal
- FEMA flood zone
- X (unshaded)
- Chance of flooding over 30 yrs
- 0.0%
- Est. flood insurance / yr
- $507 – $1,088
Fire risk 1/10 · Minimal
- Est. fire insurance / yr
- $717 – $1,331
Heat risk 3/10 · Minor
- Hot days now (above 101°F)
- 7 days/yr
- Hot days in 30 yrs
- 19 days/yr
Wind risk 2/10 · Minimal
- Chance of severe wind over 30 yrs
- —
Air-quality risk 4/10 · Minor
- Unhealthy air days now
- 4 days/yr
- Unhealthy air days in 30 yrs
- 5 days/yr
Risk factors via First Street. Map © Google.
Why this score? — see what drove the C- grade
The composite is a weighted blend of 9 inputs, each scored 0–100. Each bar is that input's sub-score; the figure is the points it added to the 100-point composite (weight × sub-score).
- Cash flow +16.8/30.0
- ARV discount +15.0/15.0
- DSCR +5.2/10.0
- 1% rule +4.3/10.0
- Rent growth +2.7/5.0
- Livability +2.5/5.0
- Condition / age +2.5/5.0
- Schools +1.4/10.0
- Appreciation +0.0/10.0
$185,000
🖨 Deal sheet (PDF) 📄 Offer letter ✓ Due diligence
Listing remarks
Opportunity awaits at 3113 Lupine Dr in Indianapolis! This estate property is being SOLD AS-IS and offers tremendous potential for investors, flippers, or buyers looking to add their personal touch. Built in 1971, this single-story home features 3 bedrooms, 2 full baths, and approximately 1,755 square feet of living space on a spacious 9,888 square foot lot. The home needs updates and is priced accordingly, making it an excellent value-add opportunity. With a functional layout, generous room sizes, and a desirable single-level floor plan, the possibilities are endless. Whether you're searching for your next investment project or a home to renovate and make your own, this property is full of
Key facts
- 9,888 sq ft lot
- 2 garage spots
- Built 1971
Property features AI
Exterior
- Parking: Attached garage (2 spaces, approximately 456 sq ft)
- Security: Smoke detector(s)
- Utilities: Public water; Municipal sewer connected; Cable connected; Solid waste service available
- Home design: Single family residence; One level
- Construction: Cedar, stone, and wood siding exterior; Slab foundation
- Exterior features: Porch; Gas grill; Storage shed; Chain link and full fencing; Street lights; Mature trees
Interior
- Kitchen: Gas cooktop; Double oven; Electric oven; Range hood; Microwave; Dishwasher; Disposal; Refrigerator; Free-standing freezer; Water purifier; Breakfast bar; Pantry
- Bedrooms: 3 bedrooms on the main level; Primary bedroom with walk-in closet
- Bathrooms: 2 full bathrooms on the main level; Primary bath has a full shower stall and suite layout
- Heating & cooling: Forced air heating (natural gas); Central air conditioning
- Interior features: Attic access; Breakfast bar; Pantry; Walk-in closet(s); Living room (formal); Fireplace in family room (wood burning)
- Laundry & utility: Main-level laundry room; Washer; Dryer; Gas water heater; Exhaust fan
Neighborhood map
What this means for you Summary
Snapshot
- This is a 3-bed/1.0-bath single-family listed at $185k.
Deal economics
- At list price, monthly cash flow is $119 ($1k/yr) — positive.
- The deal already cash-flows at list — no discount required.
- To meet the 1% rule (rent ≥ 1% of price), the offer needs to be $173k (6.7% below list).
- Recommended offer: $173k (6.7% below list) — sets the bar for 1% rule.
- Cap rate 7.1% vs local median 4.4% in Indianapolis city (balance) — top-decile yield for the area; either an underpriced asset or a hidden risk that comps aren't pricing in. Stress-test before assuming the spread holds.
Location & tenants
- Location reads: area grade C — affects rentability + tenant quality, not the cash-flow math above.
- Indianapolis Public Schools (urban): math 14% / reading 20% proficiency, ranked #286 of 301 in IN (top 95%) — low school quality limits family demand, transient renter base, plan for 1-2y turnover; 77% free/reduced lunch — lower-income household profile, screen leases tightly.
- Zoned schools: Center For Inquiry School 27 (math 25% / reading 29%, grade F, #737 of 994 statewide, top 76%, 525 students, 51% FRL); H L Harshman Middle School (math 3% / reading 16%, grade F, #316 of 330 statewide, top 96%, 549 students, 84% FRL).
- Market conditions: Rents flat; 64 active listings in the ZIP; 9 comparable units currently listed for rent nearby; rentals leasing fast (median 10d on market — plan ~1-2 weeks tenant-placement turnaround); 1,906 units permitted in Marion County in 2024 (621 in 5+ unit buildings).
- This rent runs 37% of the median local income ($56k/yr) — at the standard rent-burdened threshold; future hikes will face affordability resistance.
Forward outlook
- Local home prices are declining (-3.0%/yr); year-one equity from $1k of loan paydown is wiped out by about $6k of value loss. Plan a longer hold.
- Marion County population projected at +18% by 2050 — long-run rental-demand tailwind backs the buy-and-hold thesis.
Negotiation context
- Only 4 days on market — expect competitive offers; lowballing is unlikely to land.
Questions for the listing agent
- Built in 1971 — when were the roof, HVAC, electrical panel, plumbing, and water heater last replaced?
- Is there a deadline driving the sale (1031 exchange, divorce, estate, relocation)? That informs how much negotiation room exists.
- What's the average days-on-market for RENTAL listings here right now (not sales)? A rising rental-DOM trend means longer vacancies and softer asking-rent achievability than the comps imply.
- What's the recent tenant-quality profile in this submarket — average credit score on applications, eviction rate, late-payment / NSF rate, and stable-employment percentage? A property-management company in the area should have these aggregated.
- How much new for-sale + rental construction is in the pipeline within 1–3 miles? Heavy new supply typically softens prices + rents 12–24 months out; constrained supply supports both.
Investment metrics
- 1% rule
- 0.93% ✗
- Cap rate
- 7.07%
- Cash-on-cash
- 2.76%
- DSCR
- 1.12
- GRM
- 8.9
CMA / ARV
- ARV (on-the-fly)
- $277,290
- Comps found
- 12
Show comp detail 12 sales within ~0.75 mi
| Address | Dist | Beds/Ba | Sqft | Sold | Price | $/sf | Match |
|---|---|---|---|---|---|---|---|
| 3221 Bluebell Ln | 0.23mi | 3/2.0 | 1,702 (-3%) | 1mo | $220,000 | $129 | 80 |
| 3148 Arbutus Dr | 0.07mi | 4/2.0 (+1) | 1,824 (+4%) | 9mo | $265,000 | $145 | 74 |
| 6340 Bluebell Ct | 0.23mi | 4/2.0 (+1) | 1,680 (-4%) | 13mo | $266,000 | $158 | 62 |
| 6108 Midway Ct | 0.38mi | 3/2.0 | 1,855 (+6%) | 10mo | $236,500 | $127 | 60 |
| 5854 W 29th Pl | 0.60mi | 4/2.0 (+1) | 1,767 (+1%) | 4mo | $285,000 | $161 | 58 |
| 6117 Ashway Ct | 0.38mi | 4/2.0 (+1) | 1,626 (-7%) | 4mo | $274,900 | $169 | 57 |
| 2753 N High School Rd | 0.45mi | 4/2.0 (+1) | 1,790 (+2%) | 13mo | $244,000 | $136 | 56 |
| 3208 Voigt Dr | 0.49mi | 3/1.0 | 1,944 (+11%) | 6mo | $160,000 | $82 | 54 |
| 5923 W 29th Pl | 0.57mi | 3/1.5 | 1,865 (+6%) | 10mo | $298,000 | $160 | 53 |
| 5809 Hollister Dr | 0.70mi | 3/2.0 | 1,616 (-8%) | 7mo | $260,000 | $161 | 44 |
| 3231 Thurston Dr | 0.66mi | 4/1.5 (+1) | 1,536 (-12%) | 8mo | $235,000 | $153 | 35 |
| 3237 Thurston Dr | 0.66mi | 4/2.0 (+1) | 1,560 (-11%) | 12mo | $270,000 | $173 | 32 |
Match score weights: distance 35% · size 25% · config 20% · recency 20%. Top-matched comps best support the ARV.
Projected returns pro-forma
-3.0% appreciation · 0.79% rent growth · sell at horizon
- IRR
- -14.4%
- Equity multiple
- 0.50×
- Total profit
- $-26,143
- Equity at exit
- $27,584
- IRR
- -9.6%
- Equity multiple
- 0.46×
- Total profit
- $-27,716
- Equity at exit
- $15,995
Cash invested: $51,800 (down + closing). Projections, not guarantees.
Landlord ↔ Tenant lean methodology
- Overall (STATE)
- 90 Strongly Landlord-Friendly
- State Indiana
- 90 Strongly Landlord-Friendly · R+11
- County
- — inherits STATE
- City
- — inherits STATE
ZIP-level market 46224
- Rents YoY
- 0.8%
- Active inventory
- 64
- Price-to-rent
- 8.9×
Monthly cashflow live
- Estimated rent
- $1,726 high interval (Pro) →
- Mortgage (P&I)
- −$970
- Tax from tax record
- −$197 /mo · $2,363/yr
- Insurance
- −$77
- HOA
- −$0
- Vacancy / Maint / Mgmt
- −$362
- Net cashflow
- $119
Break-even live
Sensitivity live
| Price | -10% $224 | -5% $171 | +0% $119 | +5% $67 | +10% $14 |
|---|---|---|---|---|---|
| Rent | -10% $-17 | -5% $51 | +0% $119 | +5% $187 | +10% $255 |
| Rate | -1.0pp $212 | -0.5pp $166 | base $119 | +0.5pp $71 | +1.0pp $22 |
UW: 25.0% down · 7.5% · 30yr · 1.5% tax · 5.0% vac · 8.0% maint · 8.0% mgmt
Financing live
Cash to close
- Down payment
- $46,250
- Closing costs
- $5,550
- Reserves months
- —
- Total cash needed
- —
Loan-product check · same deal, 3 products live
Conventional
25% down · 7.5% · 30yr
- Down + closing
- —
- Monthly P&I
- —
- Monthly cashflow
- —
- DSCR
- —
- Eligible?
- —
Personal DTI + credit; lowest rate.
DSCR
20% down · 8.5% · 30yr
- Down + closing
- —
- Monthly P&I
- —
- Monthly cashflow
- —
- DSCR
- —
- Eligible?
- —
No personal income docs; deal must DSCR.
Hard money
10% down · 12.0% · 12mo
- Down + closing
- —
- Monthly P&I
- —
- Monthly cashflow
- —
- DSCR
- —
- Eligible?
- —
Short-term bridge; refi at stabilization.
Rent comps 9 comps
| Address | Beds | Baths | Sqft | Rent | $/sqft | DOM | Units | Dist |
|---|---|---|---|---|---|---|---|---|
| 3226 Voigt Dr Indianapolis, IN | 3.0 | 1.5 | 1826 | $1,850 | $1.01 | 25d | 1 | 0.50mi |
| 6710 Hollow Run Pl Indianapolis, IN | 1.0–3.0 | 1.0–2.0 | 995 | $2,000 | $2.01 | 9d | 37 | 0.64mi |
| 5925 Sunwood Dr Indianapolis, IN | 3.0 | 1.0 | 1479 | $1,600 | $1.08 | 6d | 1 | 0.71mi |
| 5925 Sunwood Dr Indianapolis, IN | 3.0 | 1.0 | 1479 | $1,600 | $1.08 | 22d | 1 | 0.71mi |
| 5801 Sunwood Dr Indianapolis, IN | 4.0 | 2.0 | 1908 | $2,055 | $1.08 | 9d | 1 | 0.74mi |
| 5505 Scarlet Dr Indianapolis, IN | 3.0 | 1.0–1.5 | 883 | $1,669 | $1.89 | 0d | 7 | 0.95mi |
| 3338 Tara Ln Indianapolis, IN | 3.0 | 1.5 | 1242 | $1,199 | $0.97 | 45d | 1 | 1.22mi |
| 2030 Runaway Bay Dr Indianapolis, IN | 1.0–3.0 | 1.0–2.0 | 1121 | $1,975 | $1.76 | 4d | 21 | 1.25mi |
| 6932 Thousand Oaks Dr Indianapolis, IN | 3.0 | 2.5 | 2536 | $2,400 | $0.95 | 25d | 1 | 1.36mi |
Listing history 5 events
-
2026-06-10status $185,000 Pending 4 DOM
-
2026-06-09days on market $185,000 Active 4 DOM
-
2026-06-08days on market $185,000 Active 3 DOM
-
2026-06-07remarks 699-char remark
-
2026-06-07$185,000 Active 2 DOM
ⓘ Source: listings_history table (triggers on properties + properties_extension) + one-shot
backfill from property_details.listing_events for pre-trigger history.
Tax reassessment forecast IN · Partial reset (capped growth)
- Current annual tax
- $2,363 · $197/mo
- Projected year-2 tax
- $2,363 · $197/mo
- Expected delta
- $0/yr ($0/mo · 0.0%)
ⓘ Screening estimate from a state-policy table — verify with the county assessor before closing.
Climate risk First Street
- Flood 1/10 Low FEMA zone X (unshaded) · 0% chance over 30 yrs
- Wildfire 1/10 Low
- Heat 3/10 Moderate 7 d/yr ≥101°F today · 19 d/yr by 30 yrs out
- Wind 2/10 Low
- Air quality 4/10 Moderate 4 unhealthy d/yr today · 5 by 30 yrs out
Nearby sold comps map
Loading sold comps map…
Walkable amenities ~0.75 mi
Loading nearby amenities…
Taxation est. · year 1
- Rental income
- $20,708
- − Mortgage interest
- −$10,363
- − Property taxes
- −$2,363
- − Insurance
- −$925
- − Repairs & maintenance
- −$1,657
- − Management
- −$1,657
- − Depreciation
- −$5,382
- Taxable loss
- −$1,638
- Est. tax savings @ 24.0%
- +$393
- After-tax cash flow
- $1,822/yr
For passive investors: Depreciation is non-cash, so a rental often shows a tax loss while cash-flowing — sheltering income. Rental losses are passive: they offset passive income freely, and up to $25,000/yr can offset ordinary (W-2) income if you actively participate and your MAGI is under $100k (phasing out to $0 by $150k); unused losses carry forward. On sale, claimed depreciation is recaptured at up to 25%, and gains may owe capital-gains tax (a 1031 exchange can defer both). Figures are a year-1 estimate at your 24.0% rate — not tax advice; consult a CPA.
Schools (NCES district)
- District
- Indianapolis Public Schools
- NCES district ID
- 1804770
- Math proficiency
- 14% ▼ -7.00%
- Reading proficiency
- 20% ▼ -3.00%
- Median HH income
- $32,034
- Composite
- 13.69/100
- National rank
- #9499
- State rank
- #286 of 301 in IN
Livability — Indianapolis city (balance)
No livability data for this city. (Only ~50 U.S. cities are tracked.)
Census & demographics
- Census place
- Indianapolis city (balance), IN
- County
- Marion County · 998,460 people
- City population
- 881,119
- Metro
- Indianapolis-Carmel-Anderson, IN
- Population (ZIP)
- 40,228
- Household income
- $55,986
- Rent vs Own
- Severe rent burden
- 2206.0
Population outlook (Marion County) Hauer SSP2
- Today (2025)
- 1,025,572 people
- By 2030
- 1,065,727 · +3.9%
- By 2040
- 1,141,577 · +11.3%
- By 2050
- 1,208,920 · +17.9%
- By 2075
- 1,367,288 · +33.3%
- By 2100
- 1,438,201 · +40.2%
Race, ethnicity, and origin ACS 2023
- Neighborhood character
- Diverse neighborhood (Simpson 0.69)
- Race & ethnicity
- Black 39% White 33% Hispanic / Latino 23% Two or more races 7% Asian 1%
- Hispanic origin (detail)
- Mexican 14% Dominican 2%
- Common ancestry
- Hispanic 3% Arab 1% Italian 1%
- Foreign-born
- 31% · Canada, Philippines
- Languages at home
- 62% English-only · Spanish 19% French/Haitian/Cajun 5% Arabic 2%
Political lean MEDSL · Marion
- 2024 margin
- Strong D (+27.7) · D 63.0% · R 35.3% · Other 1.7%
- 2008→2024 swing
- -0.7pp no change · 2008: 28.4pp · 2024: 27.7pp
- All cycles
- 2024: D+27.7 2020: D+29.1 2016: D+22.8 2012: D+22.2 2008: D+28.4
Not yet ingested
- Civics
- —
Market trends
- HPI YoY
- ▼ -179.31%
- Current HPI
- 297.7156
- Rent YoY
- ▲ 0.79%
- Metro
- Indianapolis-Carmel-Anderson, IN
- State GDP YoY
- ▲ 2.90%
- F500 in state
- 18
Industry mix (Fortune 500 HQ in IN)
| Industry | F500 HQs | Revenue |
|---|---|---|
| Industrial Machinery | 2 | $37B |
|
||
| Healthcare | 1 | $177B |
|
||
| Pharmaceuticals | 1 | $45B |
|
||
| Metals / Steel | 1 | $18B |
|
||
| Agriculture | 1 | $17B |
|
||
| Packaging | 1 | $12B |
|
||
Price history
1 event — show timeline
- 2026-06-05 Listed $185,000 MIBOR as Distributed by MLS Grid
Property tax history
+41.5%/yrLatest (2025): $2,363 · -3.3% YoY. Source: county tax records.
Cash-flow waterfall
monthlySold comps — $/sqft
last 12 mo · ≤1 miLoading sold comps…