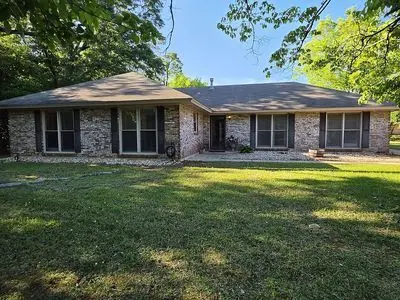
202 Hiwassee Dr · Montgomery, AL
Flood risk 1/10 · Minimal
- FEMA flood zone
- X (unshaded)
- Chance of flooding over 30 yrs
- 0.0%
- Est. flood insurance / yr
- $507 – $1,088
Fire risk 3/10 · Minor
- Est. fire insurance / yr
- $916 – $1,700
Heat risk 7/10 · Major
- Hot days now (above 108°F)
- 7 days/yr
- Hot days in 30 yrs
- 20 days/yr
Wind risk 8/10 · Major
- Chance of severe wind over 30 yrs
- 80.0%
Air-quality risk 4/10 · Minor
- Unhealthy air days now
- 4 days/yr
- Unhealthy air days in 30 yrs
- 5 days/yr
Risk factors via First Street. Map © Google.
Why this score? — see what drove the C grade
The composite is a weighted blend of 9 inputs, each scored 0–100. Each bar is that input's sub-score; the figure is the points it added to the 100-point composite (weight × sub-score).
- Cash flow +21.1/30.0
- ARV discount +15.0/15.0
- DSCR +6.7/10.0
- 1% rule +4.5/10.0
- Rent growth +3.2/5.0
- Livability +3.2/5.0
- Condition / age +2.5/5.0
- Schools +1.7/10.0
- Appreciation +0.0/10.0
$210,500
🖨 Deal sheet (PDF) 📄 Offer letter ✓ Due diligence
Listing remarks
Welcome to 202 Hiwassee Drive in the desirable Arrowhead neighborhood! This charming 4-bedroom, 2-bath brick home offers the perfect blend of comfort, character, and functionality. Thoughtfully designed with no wasted space, this home features generously sized bedrooms, oversized closets, and abundant storage throughout & acirc; & euro; & rdquo; including spacious hallway closets that make organization easy. The kitchen is warm and inviting, complete with a new refrigerator and stove, making it move-in ready for its next owners. The cozy den is truly a standout, featuring a beautiful fireplace accented by stunning wood ceiling beams, creating the perfect place to gather and unw
Key facts
- New stove
- Beautiful fireplace
- Covered patio
Tags
Neighborhood map
What this means for you Summary
Snapshot
- This is a 4-bed/2.0-bath single-family listed at $210k.
Deal economics
- At list price, monthly cash flow is $299 ($4k/yr) — positive.
- The deal already cash-flows at list — no discount required.
- To meet the 1% rule (rent ≥ 1% of price), the offer needs to be $200k (4.8% below list).
- Recommended offer: $200k (4.8% below list) — sets the bar for 1% rule.
- Cap rate 8.0% vs local median 6.0% in Montgomery — top-decile yield for the area; either an underpriced asset or a hidden risk that comps aren't pricing in. Stress-test before assuming the spread holds.
Location & tenants
- Location reads 65/100 on livability (#138 in AL) — a middle-class / working-renter tenant base. Strengths: cost of living A+, housing A+; Watch: employment D, crime F, amenities D-.
- Montgomery County (urban): math 9% / reading 31% proficiency, ranked #106 of 129 in AL (top 82%) — low school quality limits family demand, transient renter base, plan for 1-2y turnover; 70% free/reduced lunch — lower-income household profile, screen leases tightly.
- Zoned schools: Garrett Elementary School (math 2% / reading 27%, grade F, #508 of 627 statewide, top 84%, 564 students, 68% FRL); Park Crossing High School (math 12% / reading 27%, grade F, #169 of 305 statewide, top 59%, 906 students, 53% FRL).
- Market conditions: Rents rising (+3.0%/yr); 409 active listings in the ZIP; 9 comparable units currently listed for rent nearby; rentals at typical pace (median 23d on market — plan ~3-4 weeks tenant-placement turnaround); 44% of comp listings sitting > 30 days — soft ceiling on asking rent; 460 units permitted in Montgomery County in 2024 (37 in 5+ unit buildings).
- This rent runs 32% of the median local income ($75k/yr) — at the standard rent-burdened threshold; future hikes will face affordability resistance.
Forward outlook
- Local home prices are declining (-3.0%/yr); year-one equity from $1k of loan paydown is wiped out by about $6k of value loss. Plan a longer hold.
- Montgomery County population projected to shrink 8% by 2050 — rents likely to lag national; underwrite the cash flow, not the appreciation.
Negotiation context
- It's been on market 40 days — a 3% lower offer ($204k) is reasonable based on typical stale-listing flexibility.
- 8 sale attempts since 28y ago with the ask held roughly flat each time — persistent listings suggest the price (not the market) is what's stuck; bring a comps-based counter.
- Current owner paid $146k; 44% above their basis — modest negotiation headroom, anchor on the comps not their cost.
Risks & watch-outs
- Climate carrying-cost: severe wind risk, 80% chance of damaging wind over 30y; extreme-heat days projected 7→20/yr by 2055 (HVAC capex compounding) — expect insurance premiums to compound above CPI over the hold.
Questions for the listing agent
- It's been on market 40 days. Have you received any prior offers? Is the seller open to a 5% concession, seller financing, or rate buy-down credit?
- Built in 1973 — when were the roof, HVAC, electrical panel, plumbing, and water heater last replaced?
- Is there a deadline driving the sale (1031 exchange, divorce, estate, relocation)? That informs how much negotiation room exists.
- Crime grade is F in this area — have there been break-ins, vandalism, or insurance claims at this property in the last 3 years? What carrier currently insures it and at what premium?
- What's the average days-on-market for RENTAL listings here right now (not sales)? A rising rental-DOM trend means longer vacancies and softer asking-rent achievability than the comps imply.
- What's the recent tenant-quality profile in this submarket — average credit score on applications, eviction rate, late-payment / NSF rate, and stable-employment percentage? A property-management company in the area should have these aggregated.
- How much new for-sale + rental construction is in the pipeline within 1–3 miles? Heavy new supply typically softens prices + rents 12–24 months out; constrained supply supports both.
Investment metrics
- 1% rule
- 0.95% ✗
- Cap rate
- 8.00%
- Cash-on-cash
- 6.09%
- DSCR
- 1.27
- GRM
- 8.8
CMA / ARV
- ARV (on-the-fly)
- $290,400
- Comps found
- 12
Show comp detail 12 sales within ~0.75 mi
| Address | Dist | Beds/Ba | Sqft | Sold | Price | $/sf | Match |
|---|---|---|---|---|---|---|---|
| 104 Tuckabatchee Ct | 0.31mi | 4/2.0 | 2,155 (-2%) | 1mo | $285,000 | $132 | 82 |
| 200 Oldfield Dr | 0.55mi | 4/2.0 | 2,202 (+0%) | 3mo | $255,000 | $116 | 71 |
| 125 Ocala Dr | 0.12mi | 3/2.0 (-1) | 1,884 (-14%) | 1mo | $259,000 | $137 | 64 |
| 1256 Autumn Ridge Rd | 0.70mi | 4/2.0 | 2,239 (+2%) | 6mo | $309,200 | $138 | 59 |
| 7325 Old Forest Rd | 0.70mi | 4/2.0 | 2,103 (-4%) | 2mo | $270,000 | $128 | 58 |
| 8519 Wexford Trce | 0.55mi | 3/2.5 (-1) | 2,316 (+5%) | 3mo | $275,000 | $119 | 56 |
| 51 Lake Frst | 0.59mi | 3/2.5 (-1) | 2,110 (-4%) | 5mo | $282,000 | $134 | 55 |
| 7307 Old Forest Rd | 0.73mi | 4/2.0 | 2,020 (-8%) | 1mo | $290,000 | $144 | 52 |
| 949 Somerset Dr | 0.46mi | 3/2.0 (-1) | 2,460 (+12%) | 2mo | $280,000 | $114 | 52 |
| 447 Arrowhead Dr | 0.65mi | 3/2.0 (-1) | 2,384 (+8%) | 1mo | $290,000 | $122 | 49 |
| 7955 Bridgewater Trce | 0.64mi | 3/2.5 (-1) | 2,385 (+8%) | 2mo | $315,000 | $132 | 48 |
| 30 Lake Forest Dr | 0.54mi | 3/2.0 (-1) | 1,931 (-12%) | 2mo | $277,000 | $143 | 47 |
Match score weights: distance 35% · size 25% · config 20% · recency 20%. Top-matched comps best support the ARV.
Projected returns pro-forma
-3.0% appreciation · 2.99% rent growth · sell at horizon
- IRR
- -7.0%
- Equity multiple
- 0.74×
- Total profit
- $-15,159
- Equity at exit
- $31,386
- IRR
- 2.6%
- Equity multiple
- 1.19×
- Total profit
- $10,939
- Equity at exit
- $18,200
Cash invested: $58,940 (down + closing). Projections, not guarantees.
Landlord ↔ Tenant lean methodology
- Overall (STATE)
- 90 Strongly Landlord-Friendly
- State Alabama
- 90 Strongly Landlord-Friendly · R+15
- County
- — inherits STATE
- City
- — inherits STATE
ZIP-level market 36117
- Home prices YoY
- -20.0%
- Rents YoY
- 3.0%
- Active inventory
- 409
- Price-to-rent
- 8.8×
Monthly cashflow live
- Estimated rent
- $2,005 high interval (Pro) →
- Mortgage (P&I)
- −$1,104
- Tax from tax record
- −$93 /mo · $1,117/yr
- Insurance
- −$88
- HOA
- −$0
- Vacancy / Maint / Mgmt
- −$421
- Net cashflow
- $299
Break-even live
Sensitivity live
| Price | -10% $418 | -5% $359 | +0% $299 | +5% $239 | +10% $180 |
|---|---|---|---|---|---|
| Rent | -10% $141 | -5% $220 | +0% $299 | +5% $378 | +10% $457 |
| Rate | -1.0pp $405 | -0.5pp $353 | base $299 | +0.5pp $244 | +1.0pp $189 |
UW: 25.0% down · 7.5% · 30yr · 1.5% tax · 5.0% vac · 8.0% maint · 8.0% mgmt
Financing live
Cash to close
- Down payment
- $52,625
- Closing costs
- $6,315
- Reserves months
- —
- Total cash needed
- —
Loan-product check · same deal, 3 products live
Conventional
25% down · 7.5% · 30yr
- Down + closing
- —
- Monthly P&I
- —
- Monthly cashflow
- —
- DSCR
- —
- Eligible?
- —
Personal DTI + credit; lowest rate.
DSCR
20% down · 8.5% · 30yr
- Down + closing
- —
- Monthly P&I
- —
- Monthly cashflow
- —
- DSCR
- —
- Eligible?
- —
No personal income docs; deal must DSCR.
Hard money
10% down · 12.0% · 12mo
- Down + closing
- —
- Monthly P&I
- —
- Monthly cashflow
- —
- DSCR
- —
- Eligible?
- —
Short-term bridge; refi at stabilization.
Rent comps 9 comps
| Address | Beds | Baths | Sqft | Rent | $/sqft | DOM | Units | Dist |
|---|---|---|---|---|---|---|---|---|
| 137 Hillabee Ct Montgomery, AL | 3.0 | 2.0 | 1881 | $1,900 | $1.01 | 45d | 1 | 0.38mi |
| 280 New Haven Blvd Montgomery, AL | 1.0–3.0 | 1.0–2.0 | 1175 | $1,714 | $1.46 | 15d | 18 | 0.43mi |
| 111 Arrowhead Dr Montgomery, AL | 3.0 | 2.0 | 2234 | $2,150 | $0.96 | 22d | 1 | 0.64mi |
| 14 Creek Dr Montgomery, AL | 4.0 | 2.5 | 2523 | $2,100 | $0.83 | 22d | 1 | 0.65mi |
| 7117 Stamford Ct Montgomery, AL | 3.0 | 2.0 | 1527 | $1,700 | $1.11 | 15d | 1 | 0.69mi |
| 7136 Breckenridge Dr Montgomery, AL | 4.0 | 2.0 | 1544 | $1,970 | $1.28 | 45d | 1 | 0.78mi |
| 7528 Pinnacle Ct Montgomery, AL | 3.0 | 2.0 | 1607 | $1,850 | $1.15 | 45d | 1 | 0.96mi |
| 7448 Pinnacle Pt Montgomery, AL | 3.0 | 2.0 | 1581 | $2,000 | $1.27 | 45d | 1 | 1.06mi |
| 655 Whistlewood Rd Montgomery, AL | 3.0 | 2.0 | 2057 | $2,200 | $1.07 | 22d | 1 | 1.34mi |
Listing history 28 events
-
2026-06-21days on market $210,500 Active 40 DOM
-
2026-06-18days on market $210,500 Active 37 DOM
-
2026-06-17days on market $210,500 Active 36 DOM
-
2026-06-16days on market $210,500 Active 35 DOM
-
2026-06-15days on market $210,500 Active 34 DOM
-
2026-06-14days on market $210,500 Active 32 DOM
-
2026-06-13days on market $210,500 Active 31 DOM
-
2026-06-10days on market $210,500 Active 29 DOM
-
2026-06-09days on market $210,500 Active 28 DOM
-
2026-06-08days on market $210,500 Active 27 DOM
-
2026-06-07days on market $210,500 Active 26 DOM
-
2026-06-03days on market $210,500 Active 22 DOM
-
2026-06-02days on market $210,500 Active 21 DOM
-
2026-06-01days on market $210,500 Active 20 DOM
-
2026-05-31days on market $210,500 Active 19 DOM
-
2026-05-30days on market $210,500 Active 18 DOM
-
2026-05-12$210,500 Active 1630-char remark
-
2016-06-10soldstatus $146,355
-
2016-05-27soldstatus $146,000
-
2016-03-28$149,900
-
2015-08-27$149,900
-
2013-03-25$149,900
-
2012-01-17$162,240
-
2008-05-10$203,000
-
2001-03-30soldstatus $137,000
-
2001-01-05$139,900
-
1999-02-16soldstatus $120,000
-
1998-10-13$129,900
ⓘ Source: listings_history table (triggers on properties + properties_extension) + one-shot
backfill from property_details.listing_events for pre-trigger history.
Tax reassessment forecast AL · Resets to sale price
- Current annual tax
- $1,117 · $93/mo
- Projected year-2 tax
- $1,117 · $93/mo
- Expected delta
- $0/yr ($0/mo · 0.0%)
ⓘ Screening estimate from a state-policy table — verify with the county assessor before closing.
Climate risk First Street
- Flood 1/10 Low FEMA zone X (unshaded) · 0% chance over 30 yrs
- Wildfire 3/10 Moderate
- Heat 7/10 Severe 7 d/yr ≥108°F today · 20 d/yr by 30 yrs out
- Wind 8/10 Severe 80% chance of damaging wind over 30 yrs
- Air quality 4/10 Moderate 4 unhealthy d/yr today · 5 by 30 yrs out
Nearby sold comps map
Loading sold comps map…
Walkable amenities ~0.75 mi
Loading nearby amenities…
Taxation est. · year 1
- Rental income
- $24,057
- − Mortgage interest
- −$11,791
- − Property taxes
- −$1,117
- − Insurance
- −$1,052
- − Repairs & maintenance
- −$1,925
- − Management
- −$1,925
- − Depreciation
- −$6,124
- Taxable income
- $123
- Est. tax owed @ 24.0%
- −$29
- After-tax cash flow
- $3,559/yr
For passive investors: Depreciation is non-cash, so a rental often shows a tax loss while cash-flowing — sheltering income. Rental losses are passive: they offset passive income freely, and up to $25,000/yr can offset ordinary (W-2) income if you actively participate and your MAGI is under $100k (phasing out to $0 by $150k); unused losses carry forward. On sale, claimed depreciation is recaptured at up to 25%, and gains may owe capital-gains tax (a 1031 exchange can defer both). Figures are a year-1 estimate at your 24.0% rate — not tax advice; consult a CPA.
Schools (NCES district)
- District
- Montgomery County
- NCES district ID
- 0102430
- Math proficiency
- 9% ▼ -21.00%
- Reading proficiency
- 31% ▼ -1.00%
- Median HH income
- $43,902
- Composite
- 17.24/100
- National rank
- #9093
- State rank
- #106 of 129 in AL
Livability — Montgomery
- Score
- 65/100
- State rank
- #138
- US rank
- #13416
Category grades
Schools grade is shown separately in the Schools card above.
Census & demographics
- Census place
- Montgomery, AL
- County
- Montgomery County · 190,016 people
- City population
- 175,913
- Metro
- Montgomery, AL
- Population (ZIP)
- 53,172
- Household income
- $74,720
- Rent vs Own
- Severe rent burden
- 1742.0
Population outlook (Montgomery County) Hauer SSP2
- Today (2025)
- 224,008 people
- By 2030
- 221,460 · -1.1%
- By 2040
- 214,179 · -4.4%
- By 2050
- 204,912 · -8.5%
- By 2075
- 177,821 · -20.6%
- By 2100
- 145,134 · -35.2%
Race, ethnicity, and origin ACS 2023
- Neighborhood character
- Diverse neighborhood (Simpson 0.60)
- Race & ethnicity
- Black 53% White 34% Asian 8% Two or more races 3% Hispanic / Latino 3%
- Common ancestry
- Italian 1% Slovak 1% Lithuanian 1%
- Foreign-born
- 9% · South Korea, Canada, China
- Languages at home
- 90% English-only · Korean 4% Spanish 3% Other Indo-European 1%
Political lean MEDSL · Montgomery
- 2024 margin
- Solid D (+30.7) · D 64.8% · R 34.1% · Other 1.1%
- 2008→2024 swing
- +11.5pp toward D · 2008: 19.2pp · 2024: 30.7pp
- All cycles
- 2024: D+30.7 2020: D+31.5 2016: D+26.2 2012: D+24.3 2008: D+19.2
Not yet ingested
- Civics
- —
Market trends
- HPI YoY
- ▼ -37.24%
- Current HPI
- 148.7728
- Rent YoY
- ▲ 2.99%
- Metro
- Montgomery, AL
- State GDP YoY
- ▲ 2.94%
- F500 in state
- 4
Industry mix (Fortune 500 HQ in AL)
| Industry | F500 HQs | Revenue |
|---|---|---|
| Financial Services | 1 | $8B |
|
||
| Healthcare | 1 | $5B |
|
||
Price history
+62.0% since first listed12 events — show timeline
- 2026-05-12 Listed $210,500 FSBO.com
- 2016-06-10 Sold (Public Records) $146,355 Public Records
- 2016-05-27 Sold (MLS) $146,000 MAAR
- 2016-03-28 Listed $149,900 MAAR
- 2015-08-27 Listed $149,900 MAAR
- 2013-03-25 Listed $149,900 MAAR
- 2012-01-17 Listed $162,240 MAAR
- 2008-05-10 Listed $203,000 MAAR
- 2001-03-30 Sold (MLS) $137,000 MAAR
- 2001-01-05 Listed $139,900 MAAR
- 1999-02-16 Sold (MLS) $120,000 MAAR
- 1998-10-13 Listed $129,900 MAAR
Property tax history
+6.7%/yrLatest (2025): $1,117 · +6.9% YoY. Source: county tax records.
Cash-flow waterfall
monthlySold comps — $/sqft
last 12 mo · ≤1 miLoading sold comps…