 Multi-family
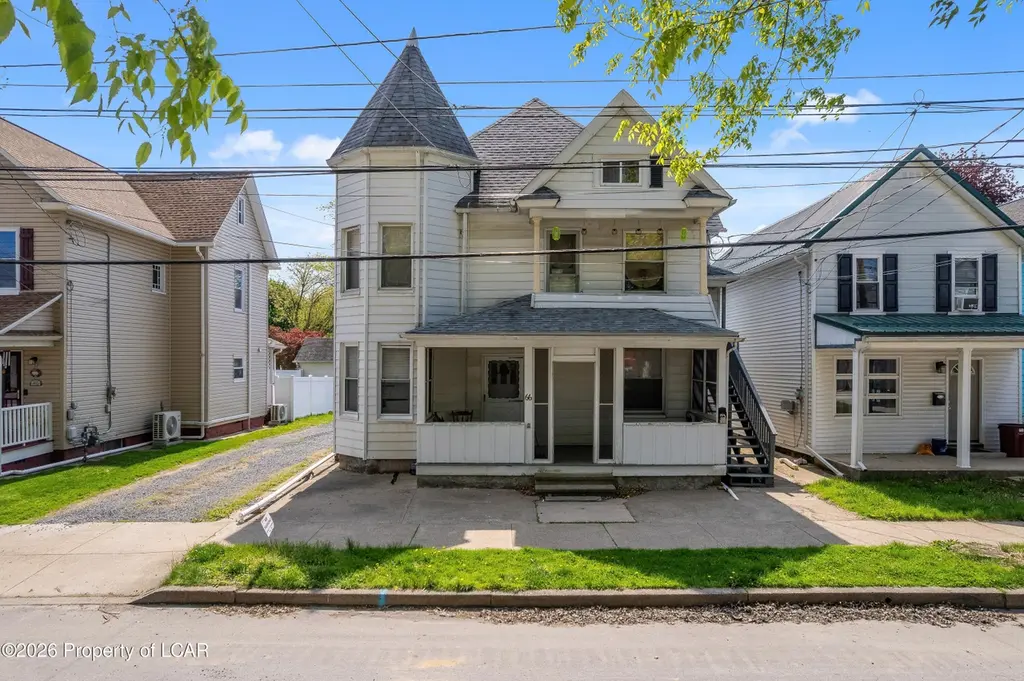
66 Sharpe St · Kingston, PA
Flood risk 9/10 · Severe
- FEMA flood zone
- X
- Chance of flooding over 30 yrs
- 0.99%
- Est. flood insurance / yr
- $507 – $1,088
Fire risk 3/10 · Minor
- Est. fire insurance / yr
- $511 – $949
Heat risk 4/10 · Minor
- Hot days now (above 95°F)
- 7 days/yr
- Hot days in 30 yrs
- 16 days/yr
Wind risk 3/10 · Minor
- Chance of severe wind over 30 yrs
- 5.0%
Air-quality risk 3/10 · Minor
- Unhealthy air days now
- 2 days/yr
- Unhealthy air days in 30 yrs
- 4 days/yr
Risk factors via First Street. Map © Google.
Why this score? — see what drove the C- grade
The composite is a weighted blend of 9 inputs, each scored 0–100. Each bar is that input's sub-score; the figure is the points it added to the 100-point composite (weight × sub-score).
- Cash flow +25.6/30.0
- DSCR +8.5/10.0
- 1% rule +6.5/10.0
- Livability +4.0/5.0
- Rent growth +3.7/5.0
- Schools +2.5/10.0
- Condition / age +2.5/5.0
- ARV discount +0.0/15.0
- Appreciation +0.0/10.0
$239,000
🖨 Deal sheet 📄 Offer letter ✓ Due diligence
Multi-family units
County records classify this as Multi-Family (2-4 Unit). Listing-text estimate: 1 unit. estimate disagrees with records
Listing remarks
Open House 5/3/26 from 1 -3 pm due to overwhelming response! Well-maintained two-unit investment property located on Sharpe Street in Kingston, PA. This versatile property offers a two-bedroom, one-bath unit alongside a spacious three-bedroom, one-bath unit--both featuring updated kitchens and strong rental appeal. Additional highlights include a four-car garage, providing potential for extra
Key facts
- Updated kitchens
- Turnkey opportunity
- Strong rental appeal
Tags
Property features AI
Exterior
- Parking: Detached garage; Off-street parking; 4 garage spaces
- Utilities: Public water; Public sewer
- Home design: Multi-family residential income property
- Construction: Aluminum siding
- Exterior features: Deck; Porch; Residential zoning
Interior
- Heating & cooling: Electric baseboard heating
- Interior features: Electric water heater; Full unfinished basement
Neighborhood map
What this means for you Summary
Snapshot
- This is a 5-bed/2.0-bath multifamily listed at $239k.
Deal economics
- At list price, monthly cash flow is $495 ($6k/yr) — positive.
- The deal already cash-flows at list — no discount required.
- Meets the 1% rule at list price ($3k rent vs $239k).
- Cap rate 9.1% vs local median 5.0% in Kingston — top-decile yield for the area; either an underpriced asset or a hidden risk that comps aren't pricing in. Stress-test before assuming the spread holds.
Location & tenants
- Location reads 81/100 on livability (#162 in PA, #1,345 nationally) — a professional / high-income tenant draw. Strengths: cost of living A+, health & safety A+, housing A; Watch: employment D, commute F.
- Wyoming Valley West SD (suburban): math 18% / reading 42% proficiency, ranked #445 of 539 in PA (top 83%) — families likely to look elsewhere, expect single-tenant / working-renter base with shorter leases.
- Market conditions: Rents rising fast (+4.7%/yr); 132 active listings in the ZIP; 4 comparable units currently listed for rent nearby; rentals lingering (median 44d on market — plan ~5-8 weeks vacancy on turnover, expect pricing pressure); 50% of comp listings sitting > 30 days — soft ceiling on asking rent; 349 units permitted in Luzerne County in 2024 (16 in 5+ unit buildings).
- At $2,744/mo this rent would consume 51% of the median local household income ($64k/yr) (locally 1454% of renters already pay >50% of income on rent) — very limited rent-growth headroom before tenants either downsize or default.
Forward outlook
- Local home prices are declining (-3.0%/yr); year-one equity from $2k of loan paydown is wiped out by about $7k of value loss. Plan a longer hold.
- Luzerne County population projected at +4% by 2050 — modest demand growth; plan on rents tracking national, not racing it.
- At projected returns (-3.0% appreciation + 4.7% rent growth), your $67k cash investment doubles in ~10 years — after that, you're playing with house money.
Negotiation context
- Only 10 days on market — expect competitive offers; lowballing is unlikely to land.
- 2 sale attempts since 3y ago with the ask held roughly flat each time — persistent listings suggest the price (not the market) is what's stuck; bring a comps-based counter.
- Current owner paid $35k; list at $239k implies a 583% gain — meaningful room to come down on a strong offer.
Risks & watch-outs
- Watch-outs: flood insurance adds $66/mo; built in 1940 — expect roof / HVAC / electrical / plumbing capex.
- Climate carrying-cost: severe flood risk — expect insurance premiums to compound above CPI over the hold.
Questions for the listing agent
- Built in 1940 — when were the roof, HVAC, electrical panel, plumbing, and water heater last replaced?
- What's the actual annual flood-insurance premium (NFIP or private), and is the property in a SFHA with mandatory coverage?
- Is there a deadline driving the sale (1031 exchange, divorce, estate, relocation)? That informs how much negotiation room exists.
- What's the average days-on-market for RENTAL listings here right now (not sales)? A rising rental-DOM trend means longer vacancies and softer asking-rent achievability than the comps imply.
- What's the recent tenant-quality profile in this submarket — average credit score on applications, eviction rate, late-payment / NSF rate, and stable-employment percentage? A property-management company in the area should have these aggregated.
- How much new apartment / multifamily construction is in the pipeline within 1–3 miles? Heavy new supply (>2% of stock underway) typically softens rents 12–24 months out; light construction supports rent growth.
Investment metrics
- 1% rule
- 1.15% ✓
- Cap rate
- 9.11%
- Cash-on-cash
- 10.07%
- DSCR
- 1.45
- GRM
- 7.3
CMA / ARV
- ARV (median comp)
- $204,114
- List price
- $239,000
- Delta
- 17.09%
- Verdict
- OVERPRICED
- Comps
- 20 within 1.0 mi
Show comp detail 7 sales within ~0.75 mi
| Address | Dist | Beds/Ba | Sqft | Sold | Price | $/sf | Match |
|---|---|---|---|---|---|---|---|
| 277 Rutter Ave | 0.64mi | 4/2.0 (-1) | 1,888 (-3%) | 2mo | $300,000 | $159 | 58 |
| 4-5 Curtis Ln | 0.74mi | 6/2.0 (+1) | 1,976 (+1%) | 19mo | $75,000 | $38 | 42 |
| 62-64 Ryman St | 0.48mi | 4/2.0 (-1) | 2,180 (+12%) | 14mo | $151,000 | $69 | 42 |
| 26 28 Grove St | 0.55mi | 4/2.0 (-1) | 2,100 (+8%) | 21mo | $180,000 | $86 | 39 |
| 328 Charles St | 0.69mi | 6/2.0 (+1) | 2,200 (+13%) | 6mo | $185,500 | $84 | 37 |
| 266 Rutter Ave | 0.65mi | 4/2.0 (-1) | 1,750 (-10%) | 16mo | $249,000 | $142 | 34 |
| 401 403 Bennett St | 0.74mi | 6/3.0 (+1) | 1,890 (-3%) | 21mo | $180,000 | $95 | 34 |
Match score weights: distance 35% · size 25% · config 20% · recency 20%. Top-matched comps best support the ARV.
Projected returns pro-forma
-3.0% appreciation · 4.65% rent growth · sell at horizon
- IRR
- -1.0%
- Equity multiple
- 0.96×
- Total profit
- $-2,514
- Equity at exit
- $35,636
- IRR
- 10.4%
- Equity multiple
- 1.87×
- Total profit
- $58,283
- Equity at exit
- $20,664
Cash invested: $66,920 (down + closing). Projections, not guarantees.
Landlord ↔ Tenant lean methodology
- Overall (STATE)
- 62 Landlord-Friendly
- State Pennsylvania
- 62 Landlord-Friendly · EVEN
- County
- — inherits STATE
- City
- — inherits STATE
ZIP-level market 18704
- Rents YoY
- 4.7%
- Active inventory
- 132
- Price-to-rent
- 15.3×
Monthly cashflow live
- Estimated rent
- $2,744 high interval (Pro) →
- Mortgage (P&I)
- −$1,253
- Tax from tax record
- −$253 /mo · $3,040/yr
- Insurance
- −$100
- Flood insurance flood zone
- −$66 /mo · $798/yr
- HOA
- −$0
- Vacancy / Maint / Mgmt
- −$576
- Net cashflow
- $495
Break-even live
2-unit breakdown (identical units grouped — click to expand)
| Units | Beds | Baths | Est. rent |
|---|---|---|---|
| 1× unit | 2 | 1 | $1,301 |
| 1× unit | 3 | 1 | $1,443 |
| Total (2 units) | $2,744 | ||
UW: 25.0% down · 7.5% · 30yr · 1.5% tax · 5.0% vac · 8.0% maint · 8.0% mgmt
Financing live
Cash to close
- Down payment
- $59,750
- Closing costs
- $7,170
- Reserves months
- —
- Total cash needed
- —
Loan-product check · same deal, 3 products live
Conventional
25% down · 7.5% · 30yr
- Down + closing
- —
- Monthly P&I
- —
- Monthly cashflow
- —
- DSCR
- —
- Eligible?
- —
Personal DTI + credit; lowest rate.
DSCR
20% down · 8.5% · 30yr
- Down + closing
- —
- Monthly P&I
- —
- Monthly cashflow
- —
- DSCR
- —
- Eligible?
- —
No personal income docs; deal must DSCR.
Hard money
10% down · 12.0% · 12mo
- Down + closing
- —
- Monthly P&I
- —
- Monthly cashflow
- —
- DSCR
- —
- Eligible?
- —
Short-term bridge; refi at stabilization.
Rent comps 4 comps
| Address | Beds | Baths | Sqft | Rent | $/sqft | DOM | Units | Dist |
|---|---|---|---|---|---|---|---|---|
| 143 W Dorrance St Kingston, PA | 5.0 | 1.5 | 2200 | $2,500 | $1.14 | 21d | 1 | 0.20mi |
| 54 Butler St Kingston, PA | 4.0 | 2.5 | 2174 | $2,000 | $0.92 | 43d | 1 | 0.31mi |
| 58 Jackson St Kingston, PA | 4.0 | 2.0 | 1600 | $2,000 | $1.25 | 43d | 1 | 1.16mi |
| 79 Washington St Kingston, PA | 4.0 | 1.5 | 1800 | $1,750 | $0.97 | 13d | 1 | 1.41mi |
Listing history 5 events
-
2026-05-07status Pending 395-char remark
-
2026-04-27$239,000 Active 395-char remark
-
2024-02-27historical $900
-
2023-09-22$900
-
2012-07-31soldstatus $35,000
ⓘ Source: listings_history table (triggers on properties + properties_extension) + one-shot
backfill from property_details.listing_events for pre-trigger history.
Tax reassessment forecast PA · Partial reset (capped growth)
- Current annual tax
- $3,040 · $253/mo
- Projected year-2 tax
- $3,408 · $284/mo
- Expected delta
- +$368/yr (+$31/mo · 12.1%)
ⓘ Screening estimate from a state-policy table — verify with the county assessor before closing.
Climate risk First Street
- Flood 9/10 Extreme FEMA zone X · 99% chance over 30 yrs
- Wildfire 3/10 Moderate
- Heat 4/10 Moderate 7 d/yr ≥95°F today · 16 d/yr by 30 yrs out
- Wind 3/10 Moderate 5% chance of damaging wind over 30 yrs
- Air quality 3/10 Moderate 2 unhealthy d/yr today · 4 by 30 yrs out
Nearby sold comps map
Loading sold comps map…
Walkable amenities ~0.75 mi
Loading nearby amenities…
Taxation est. · year 1
- Rental income
- $32,928
- − Mortgage interest
- −$13,388
- − Property taxes
- −$3,040
- − Insurance
- −$1,992
- − Repairs & maintenance
- −$2,634
- − Management
- −$2,634
- − Depreciation
- −$6,953
- Taxable income
- $2,287
- Est. tax owed @ 24.0%
- −$549
- After-tax cash flow
- $5,392/yr
For passive investors: Depreciation is non-cash, so a rental often shows a tax loss while cash-flowing — sheltering income. Rental losses are passive: they offset passive income freely, and up to $25,000/yr can offset ordinary (W-2) income if you actively participate and your MAGI is under $100k (phasing out to $0 by $150k); unused losses carry forward. On sale, claimed depreciation is recaptured at up to 25%, and gains may owe capital-gains tax (a 1031 exchange can defer both). Figures are a year-1 estimate at your 24.0% rate — not tax advice; consult a CPA.
Schools (NCES district)
- District
- Wyoming Valley West SD
- NCES district ID
- 4225950
- Math proficiency
- 18% ▼ -11.00%
- Reading proficiency
- 42% ▼ -12.00%
- Median HH income
- $42,437
- Composite
- 25.38/100
- National rank
- #7470
- State rank
- #445 of 539 in PA
Livability — Kingston
- Score
- 81/100
- State rank
- #162
- US rank
- #1345
Category grades
Schools grade is shown separately in the Schools card above.
Census & demographics
- Census place
- Kingston, PA
- County
- Luzerne County · 118,885 people
- City population
- 31,149
- Metro
- Scranton--Wilkes-Barre, PA
- Population (ZIP)
- 31,149
- Household income
- $64,444
- Rent vs Own
- Severe rent burden
- 1454.0
Population outlook (Luzerne County) Hauer SSP2
- Today (2025)
- 319,505 people
- By 2030
- 319,943 · +0.1%
- By 2040
- 322,643 · +1.0%
- By 2050
- 330,817 · +3.5%
- By 2075
- 379,145 · +18.7%
- By 2100
- 431,908 · +35.2%
Race, ethnicity, and origin ACS 2023
- Neighborhood character
- Predominantly White (82%)
- Race & ethnicity
- White 82% Hispanic / Latino 8% Black 6% Two or more races 6%
- Hispanic origin (detail)
- Mexican 1% Puerto Rican 4% Dominican 1%
- Common ancestry
- Romanian 18% Scotch-Irish 4% Italian 2%
- Foreign-born
- 3% · Canada
- Languages at home
- 93% English-only · Spanish 4% Russian/Polish/Slavic 1%
Political lean MEDSL · Luzerne
- 2024 margin
- R (+19.2) · D 40.0% · R 59.2%
- 2008→2024 swing
- -27.6pp toward R · 2008: 8.4pp · 2024: -19.2pp
- All cycles
- 2024: R+19.2 2020: R+14.4 2016: R+19.6 2012: D+4.8 2008: D+8.4
Not yet ingested
- Civics
- —
Market trends
- HPI YoY
- ▼ -154.72%
- Current HPI
- 255.5375
- Rent YoY
- ▲ 4.65%
- Metro
- Scranton--Wilkes-Barre, PA
- State GDP YoY
- ▲ 1.68%
- F500 in state
- 34
Industry mix (Fortune 500 HQ in PA)
| Industry | F500 HQs | Revenue |
|---|---|---|
| Healthcare | 2 | $309B |
|
||
| Insurance | 2 | $27B |
|
||
| Telecommunications / Media | 1 | $124B |
|
||
| Industrial Distribution | 1 | $22B |
|
||
| Financial Services | 1 | $20B |
|
||
| Chemicals / Materials | 1 | $18B |
|
||
Price history
+582.9% since first listed5 events — show timeline
- 2026-05-07 Pending — LCAR
- 2026-04-27 Listed $239,000 LCAR
- 2024-02-27 Rental Removed $900 LCAR
- 2023-09-22 Listed for Rent $900 LCAR
- 2012-07-31 Sold (Public Records) $35,000 Public Records
Property tax history
+1.8%/yrLatest (2026): $3,040 · +0.4% YoY. Source: county tax records.
Cash-flow waterfall
monthlySold comps — $/sqft
last 12 mo · ≤1 miLoading sold comps…