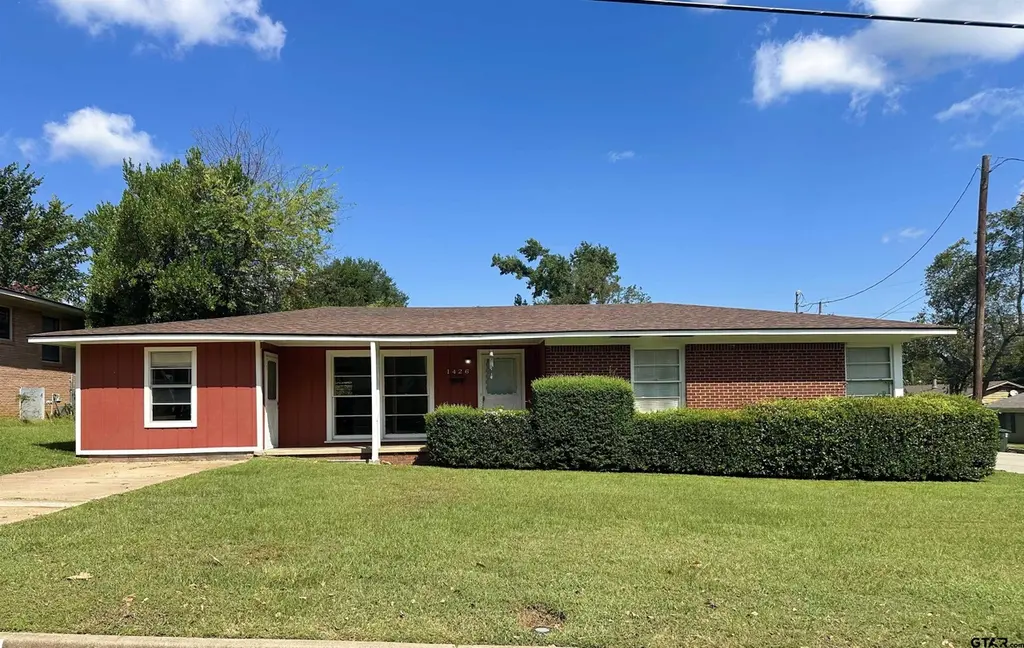
1426 Marian St · Tyler, TX
Flood risk 1/10 · Minimal
- FEMA flood zone
- X (unshaded)
- Chance of flooding over 30 yrs
- 0.0%
- Est. flood insurance / yr
- $507 – $1,088
Fire risk 1/10 · Minimal
- Est. fire insurance / yr
- $1,222 – $2,270
Heat risk 6/10 · Moderate
- Hot days now (above 109°F)
- 7 days/yr
- Hot days in 30 yrs
- 25 days/yr
Wind risk 6/10 · Moderate
- Chance of severe wind over 30 yrs
- 63.0%
Air-quality risk 2/10 · Minimal
- Unhealthy air days now
- 0 days/yr
- Unhealthy air days in 30 yrs
- 1 days/yr
Risk factors via First Street. Map © Google.
Why this score? — see what drove the B grade
The composite is a weighted blend of 9 inputs, each scored 0–100. Each bar is that input's sub-score; the figure is the points it added to the 100-point composite (weight × sub-score).
- Cash flow +27.4/30.0
- ARV discount +15.0/15.0
- DSCR +9.6/10.0
- 1% rule +7.2/10.0
- Livability +3.8/5.0
- Rent growth +3.4/5.0
- Schools +3.3/10.0
- Condition / age +2.5/5.0
- Appreciation +0.0/10.0
$139,900
🖨 Deal sheet 📄 Offer letter ✓ Due diligence
Listing remarks
A 2025 roof, a 2024 HVAC system, and an oversized lot for the neighborhood makes this an investor winner--the cosmetics are left for your discretion. Located in the Bell, Hubbard, and Legacy districts, this property is within walking distance of Bell Elementary and TJC. The back yard extends to the second chain link fence giving room for expansion or extra buildings. We have a May 2025 appraisal for $150,000 showing 1389 s. f. ; HOWEVER, there is an additional room (256 s. f. enclosed carport) which has a gas heater, window unit, closet, wall of built-ins, and its own outside entrance--perfect for an additional bedroom, craft room, home office, etc. SCAD shows 1587 s. f. Buyer to satisfy se
Key facts
- Back yard extends
- Gas heater
- Additional room
Tags
Property features AI
Exterior
- Home design: Single family detached residence; Single-story
- Construction: Brick veneer construction; Composition roof
- Exterior features: Front porch; Chain link fencing
Interior
- Kitchen: Dishwasher; Gas oven; Gas range
- Bathrooms: 1 full bathroom; 1 half bathroom
- Heating & cooling: Central heating; Natural gas heating; Space heater; Central air conditioning; Window unit(s)
- Interior features: Dishwasher; Gas oven; Gas range; Gas water heater
- Laundry & utility: Gas water heater
Neighborhood map
What this means for you Summary
Snapshot
- This is a 3-bed/1.5-bath single-family listed at $140k.
Deal economics
- At list price, monthly cash flow is $408 ($5k/yr) — positive.
- The deal already cash-flows at list — no discount required.
- Meets the 1% rule at list price ($2k rent vs $140k).
- Cap rate 9.8% vs local median 3.6% in Tyler — top-decile yield for the area; either an underpriced asset or a hidden risk that comps aren't pricing in. Stress-test before assuming the spread holds.
Location & tenants
- Location reads 75/100 on livability (#147 in TX, #4,181 nationally) — a middle-class / working-renter tenant base. Strengths: cost of living A+, housing A+, health & safety A+; Watch: employment C-, crime D+, commute F.
- Tyler ISD (urban): math 39% / reading 38% proficiency, ranked #449 of 826 in TX (top 54%) — families likely to look elsewhere, expect single-tenant / working-renter base with shorter leases; 66% free/reduced lunch — lower-income household profile, screen leases tightly.
- Zoned schools: Bell El (math 48% / reading 47%, grade D, #989 of 4,322 statewide, top 23%, 533 students, 88% FRL); Hubbard Middle (math 47% / reading 45%, grade D+, #462 of 1,662 statewide, top 28%, 869 students, 62% FRL); Tyler Legacy H S (math 34% / reading 49%, grade F, #767 of 1,632 statewide, top 47%, 2,594 students, 58% FRL) — zoned schools at 69% FRL track the district average.
- Market conditions: Rents rising (+3.7%/yr); 327 active listings in the ZIP; 33 comparable units currently listed for rent nearby; rentals at typical pace (median 22d on market — plan ~3-4 weeks tenant-placement turnaround); 595 units permitted in Smith County in 2024 (45 in 5+ unit buildings).
- This rent runs 31% of the median local income ($66k/yr) — at the standard rent-burdened threshold; future hikes will face affordability resistance.
Forward outlook
- Local home prices are declining (-3.0%/yr); year-one equity from $967 of loan paydown is wiped out by about $4k of value loss. Plan a longer hold.
- Smith County population projected at +24% by 2050 — long-run rental-demand tailwind backs the buy-and-hold thesis.
- At projected returns (-3.0% appreciation + 3.7% rent growth), your $39k cash investment doubles in ~9 years — after that, you're playing with house money.
Negotiation context
- Only 2 days on market — expect competitive offers; lowballing is unlikely to land.
Risks & watch-outs
- Watch-outs: built in 1955 — expect roof / HVAC / electrical / plumbing capex.
- Climate carrying-cost: major wind risk, 63% chance of damaging wind over 30y; extreme-heat days projected 7→25/yr by 2055 (HVAC capex compounding) — expect insurance premiums to compound above CPI over the hold.
Questions for the listing agent
- Built in 1955 — when were the roof, HVAC, electrical panel, plumbing, and water heater last replaced?
- Is there a deadline driving the sale (1031 exchange, divorce, estate, relocation)? That informs how much negotiation room exists.
- Schools are D-rated, which usually means shorter tenancies and higher turnover. Who's the typical renter profile here, and what's been the actual vacancy rate?
- Crime grade is D in this area — have there been break-ins, vandalism, or insurance claims at this property in the last 3 years? What carrier currently insures it and at what premium?
- What's the average days-on-market for RENTAL listings here right now (not sales)? A rising rental-DOM trend means longer vacancies and softer asking-rent achievability than the comps imply.
- What's the recent tenant-quality profile in this submarket — average credit score on applications, eviction rate, late-payment / NSF rate, and stable-employment percentage? A property-management company in the area should have these aggregated.
- How much new for-sale + rental construction is in the pipeline within 1–3 miles? Heavy new supply typically softens prices + rents 12–24 months out; constrained supply supports both.
Investment metrics
- 1% rule
- 1.22% ✓
- Cap rate
- 9.79%
- Cash-on-cash
- 12.51%
- DSCR
- 1.56
- GRM
- 6.8
CMA / ARV
- ARV (on-the-fly)
- $228,528
- Comps found
- 9
Show comp detail 9 sales within ~0.75 mi
| Address | Dist | Beds/Ba | Sqft | Sold | Price | $/sf | Match |
|---|---|---|---|---|---|---|---|
| 1515 San Antonio | 0.12mi | 3/2.0 | 1,682 (+6%) | 7mo | $198,500 | $118 | 76 |
| 1715 Ridgeview | 0.46mi | 2/1.5 (-1) | 1,637 (+3%) | 7mo | $245,000 | $150 | 63 |
| 2026 Neeley | 0.75mi | 3/2.0 | 1,596 (+1%) | 0mo | $225,000 | $141 | 62 |
| 2101 Bernice Ave | 0.55mi | 3/2.0 | 1,468 (-8%) | 11mo | $237,000 | $161 | 51 |
| 921 E Barbara St | 0.65mi | 3/2.0 | 1,749 (+10%) | 3mo | $244,900 | $140 | 48 |
| 2200 Airline Dr | 0.73mi | 3/1.0 | 1,450 (-9%) | 2mo | $205,000 | $141 | 48 |
| 2516 S Fleishel Ave | 0.41mi | 3/2.0 | 1,727 (+9%) | 23mo | $279,000 | $162 | 45 |
| 2619 Golden Rd | 0.72mi | 3/2.0 | 1,684 (+6%) | 14mo | $280,900 | $167 | 43 |
| 1520 E Devine St | 0.75mi | 4/2.0 (+1) | 1,720 (+8%) | 20mo | $248,500 | $144 | 27 |
Match score weights: distance 35% · size 25% · config 20% · recency 20%. Top-matched comps best support the ARV.
Projected returns pro-forma
-3.0% appreciation · 3.66% rent growth · sell at horizon
- IRR
- 3.0%
- Equity multiple
- 1.11×
- Total profit
- $4,487
- Equity at exit
- $20,860
- IRR
- 13.1%
- Equity multiple
- 2.08×
- Total profit
- $42,195
- Equity at exit
- $12,096
Cash invested: $39,172 (down + closing). Projections, not guarantees.
Landlord ↔ Tenant lean methodology
- Overall (STATE)
- 87 Strongly Landlord-Friendly
- State Texas
- 87 Strongly Landlord-Friendly · R+5
- County
- — inherits STATE
- City
- — inherits STATE
ZIP-level market 75701
- Rents YoY
- 3.7%
- Active inventory
- 327
- Price-to-rent
- 6.8×
Monthly cashflow live
- Estimated rent
- $1,712 high interval (Pro) →
- Mortgage (P&I)
- −$734
- Tax from tax record
- −$152 /mo · $1,827/yr
- Insurance
- −$58
- HOA
- −$0
- Vacancy / Maint / Mgmt
- −$359
- Net cashflow
- $408
Break-even live
UW: 25.0% down · 7.5% · 30yr · 1.5% tax · 5.0% vac · 8.0% maint · 8.0% mgmt
Financing live
Cash to close
- Down payment
- $34,975
- Closing costs
- $4,197
- Reserves months
- —
- Total cash needed
- —
Loan-product check · same deal, 3 products live
Conventional
25% down · 7.5% · 30yr
- Down + closing
- —
- Monthly P&I
- —
- Monthly cashflow
- —
- DSCR
- —
- Eligible?
- —
Personal DTI + credit; lowest rate.
DSCR
20% down · 8.5% · 30yr
- Down + closing
- —
- Monthly P&I
- —
- Monthly cashflow
- —
- DSCR
- —
- Eligible?
- —
No personal income docs; deal must DSCR.
Hard money
10% down · 12.0% · 12mo
- Down + closing
- —
- Monthly P&I
- —
- Monthly cashflow
- —
- DSCR
- —
- Eligible?
- —
Short-term bridge; refi at stabilization.
Rent comps 33 comps
| Address | Beds | Baths | Sqft | Rent | $/sqft | DOM | Units | Dist |
|---|---|---|---|---|---|---|---|---|
| 1225 San Antonio St Tyler, TX | 3.0 | 2.0 | 1754 | $1,695 | $0.97 | 13d | 1 | 0.17mi |
| 1712 Redbud Ave Tyler, TX | 3.0 | 1.5 | 1561 | $1,475 | $0.94 | 13d | 1 | 0.27mi |
| 1712 Redbud Ave Tyler, TX | 3.0 | 1.5 | 1305 | $1,475 | $1.13 | 21d | 1 | 0.27mi |
| 2020 S Tipton Ave Tyler, TX | 3.0 | 2.0 | 1914 | $2,100 | $1.10 | 13d | 1 | 0.55mi |
| 826 Wilma St Tyler, TX | 3.0 | 2.0 | 1210 | $1,800 | $1.49 | 13d | 1 | 0.60mi |
| 1118 S Fleishel Ave Tyler, TX | 3.0 | 2.0 | 1425 | $1,495 | $1.05 | 13d | 1 | 0.68mi |
| 2319 Hunter St Tyler, TX | 3.0 | 1.0 | 1200 | $1,225 | $1.02 | 44d | 1 | 0.74mi |
| 2009 E Devine St Tyler, TX | 3.0 | 2.0 | 1200 | $1,600 | $1.33 | 44d | 1 | 0.84mi |
| 2401 Airline Dr Tyler, TX | 3.0 | 2.5 | 1512 | $1,325 | $0.88 | 44d | 1 | 0.88mi |
| 811 S Mahon Ave Tyler, TX | 3.0 | 2.0 | 1761 | $1,900 | $1.08 | 44d | 1 | 0.89mi |
| 1421 E Idel St Tyler, TX | 3.0 | 1.5 | 1080 | $1,300 | $1.20 | 13d | 1 | 0.92mi |
| 1403 S Donnybrook Ave Tyler, TX | 3.0 | 3.0 | 1834 | $2,150 | $1.17 | 44d | 1 | 0.94mi |
| 3206 Bain Pl Tyler, TX | 3.0 | 2.5 | 1840 | $1,895 | $1.03 | 44d | 1 | 0.98mi |
| 2720 S Broadway Ave Tyler, TX | 1.0–3.0 | 1.0–2.0 | 1064 | $1,330 | $1.25 | 13d | 14 | 1.04mi |
| 305 E Lake St Tyler, TX | 2.0 | 1.5 | 1287 | $1,695 | $1.32 | 13d | 1 | 1.05mi |
| 1729 E Arnold St Tyler, TX | 2.0 | 1.0 | 1074 | $1,295 | $1.21 | 21d | 1 | 1.08mi |
| 613 S Baxter Ave Tyler, TX | 3.0 | 2.0 | 1090 | $1,250 | $1.15 | 21d | 1 | 1.09mi |
| 3106 S Donnybrook Ave Tyler, TX | 3.0 | 1.0 | 1251 | $1,525 | $1.22 | 13d | 1 | 1.12mi |
| 2725 Tanglewood Dr Tyler, TX | 3.0 | 2.0 | 1956 | $1,675 | $0.86 | 13d | 1 | 1.14mi |
| 117 Ridgecrest Dr Tyler, TX | 3.0 | 2.0 | 1571 | $2,150 | $1.37 | 44d | 1 | 1.19mi |
| 3210 S Donnybrook Ave Tyler, TX | 3.0 | 2.0 | 1584 | $1,945 | $1.23 | 21d | 1 | 1.21mi |
| 132 Rowland Pl Unit b Tyler, TX | 2.0 | 1.0 | 1170 | $1,295 | $1.11 | 21d | 1 | 1.26mi |
| 3032 Santa Elena Dr Tyler, TX | 3.0 | 2.0 | 1473 | $2,485 | $1.69 | 44d | 1 | 1.28mi |
| 3038 Santa Elena Dr Tyler, TX | 3.0 | 2.0 | 1305 | $2,485 | $1.90 | 13d | 1 | 1.29mi |
| 328 Mockingbird Ln Tyler, TX | 2.0 | 1.0 | 1200 | $950 | $0.79 | 13d | 1 | 1.32mi |
| 3113 Greg Ln Tyler, TX | 3.0 | 1.5 | 1157 | $1,300 | $1.12 | 13d | 1 | 1.34mi |
| 2002 S Robertson Ave Tyler, TX | 3.0 | 2.5 | 1992 | $1,800 | $0.90 | 44d | 1 | 1.37mi |
| 324 S Saunders Ave Tyler, TX | 3.0 | 2.0 | 1650 | $2,100 | $1.27 | 44d | 1 | 1.43mi |
| 711 W 6th St Tyler, TX | 3.0 | 2.0 | 1854 | $1,850 | $1.00 | 13d | 1 | 1.44mi |
| 1115 S Robertson Ave Tyler, TX | 2.0 | 1.0 | 1366 | $1,550 | $1.13 | 13d | 1 | 1.46mi |
| 3712 Colony Park Dr Tyler, TX | 3.0 | 2.0 | 1802 | $1,850 | $1.03 | 13d | 1 | 1.47mi |
| 3127 Andy Ln Tyler, TX | 4.0 | 2.0 | 1733 | $2,100 | $1.21 | 44d | 1 | 1.47mi |
| 211 Patricia Ct Tyler, TX | 3.0 | 2.0 | 1314 | $1,795 | $1.37 | 44d | 1 | 1.50mi |
Listing history 2 events
-
2026-05-20status Pending
-
2026-05-18$139,900 Active
ⓘ Source: listings_history table (triggers on properties + properties_extension) + one-shot
backfill from property_details.listing_events for pre-trigger history.
Tax reassessment forecast TX · Resets to sale price
- Current annual tax
- $1,827 · $152/mo
- Projected year-2 tax
- $2,560 · $213/mo
- Expected delta
- +$734/yr (+$61/mo · 40.2%)
ⓘ Screening estimate from a state-policy table — verify with the county assessor before closing.
Climate risk First Street
- Flood 1/10 Low FEMA zone X (unshaded) · 0% chance over 30 yrs
- Wildfire 1/10 Low
- Heat 6/10 Major 7 d/yr ≥109°F today · 25 d/yr by 30 yrs out
- Wind 6/10 Major 63% chance of damaging wind over 30 yrs
- Air quality 2/10 Low 0 unhealthy d/yr today · 1 by 30 yrs out
Nearby sold comps map
Loading sold comps map…
Walkable amenities ~0.75 mi
Loading nearby amenities…
Taxation est. · year 1
- Rental income
- $20,543
- − Mortgage interest
- −$7,837
- − Property taxes
- −$1,827
- − Insurance
- −$700
- − Repairs & maintenance
- −$1,643
- − Management
- −$1,643
- − Depreciation
- −$4,070
- Taxable income
- $2,823
- Est. tax owed @ 24.0%
- −$678
- After-tax cash flow
- $4,221/yr
For passive investors: Depreciation is non-cash, so a rental often shows a tax loss while cash-flowing — sheltering income. Rental losses are passive: they offset passive income freely, and up to $25,000/yr can offset ordinary (W-2) income if you actively participate and your MAGI is under $100k (phasing out to $0 by $150k); unused losses carry forward. On sale, claimed depreciation is recaptured at up to 25%, and gains may owe capital-gains tax (a 1031 exchange can defer both). Figures are a year-1 estimate at your 24.0% rate — not tax advice; consult a CPA.
Schools (NCES district)
- District
- Tyler ISD
- NCES district ID
- 4843470
- Math proficiency
- 39% ▼ -4.00%
- Reading proficiency
- 38% ▼ -1.00%
- Median HH income
- $44,090
- Composite
- 32.69/100
- National rank
- #5650
- State rank
- #449 of 826 in TX
Livability — Tyler
- Score
- 75/100
- State rank
- #147
- US rank
- #4181
Category grades
Schools grade is shown separately in the Schools card above.
Census & demographics
- Census place
- Tyler, TX
- County
- Smith County · 180,570 people
- City population
- 127,842
- Metro
- Tyler, TX
- Population (ZIP)
- 36,344
- Household income
- $66,401
- Rent vs Own
- Severe rent burden
- 1116.0
Population outlook (Smith County) Hauer SSP2
- Today (2025)
- 248,890 people
- By 2030
- 261,665 · +5.1%
- By 2040
- 286,114 · +15.0%
- By 2050
- 308,006 · +23.8%
- By 2075
- 354,171 · +42.3%
- By 2100
- 372,828 · +49.8%
Race, ethnicity, and origin ACS 2023
- Neighborhood character
- Diverse neighborhood (Simpson 0.64)
- Race & ethnicity
- White 53% Black 21% Hispanic / Latino 19% Two or more races 8% Asian 2%
- Hispanic origin (detail)
- Mexican 17%
- Common ancestry
- Slovak 2% Italian 1% Lithuanian 1%
- Foreign-born
- 8% · Canada
- Languages at home
- 84% English-only · Spanish 14% Other Indo-European 1%
Political lean MEDSL · Smith
- 2024 margin
- Solid R (+45.1) · D 27.0% · R 72.1%
- 2008→2024 swing
- -5.6pp toward R · 2008: -39.5pp · 2024: -45.1pp
- All cycles
- 2024: R+45.1 2020: R+39.4 2016: R+43.9 2012: R+46.9 2008: R+39.5
Not yet ingested
- Civics
- —
Market trends
- HPI YoY
- ▼ -299.78%
- Current HPI
- 207.238
- Rent YoY
- ▲ 3.66%
- Metro
- Tyler, TX
- State GDP YoY
- ▲ 3.95%
- F500 in state
- 110
Industry mix (Fortune 500 HQ in TX)
| Industry | F500 HQs | Revenue |
|---|---|---|
| Energy | 16 | $1,198B |
|
||
| Technology | 5 | $198B |
|
||
| Engineering / Construction | 4 | $72B |
|
||
| Energy Services | 3 | $60B |
|
||
| Utilities | 3 | $41B |
|
||
| Healthcare | 2 | $330B |
|
||
Price history
2 events — show timeline
- 2026-05-20 Pending — GTAR
- 2026-05-18 Listed $139,900 GTAR
Property tax history
+3.1%/yrLatest (2024): $1,827 · +7.4% YoY. Source: county tax records.
Cash-flow waterfall
monthlySold comps — $/sqft
last 12 mo · ≤1 miLoading sold comps…