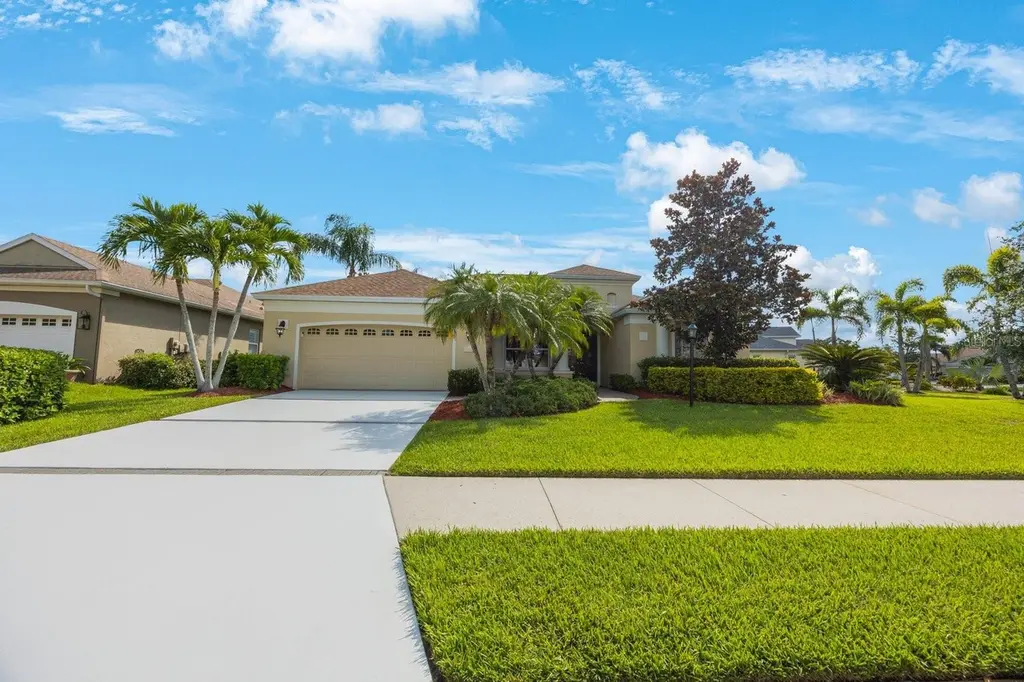
7615 Charleston St · Lakewood Ranch, FL
Flood risk 1/10 · Minimal
- FEMA flood zone
- X (unshaded)
- Chance of flooding over 30 yrs
- 0.0%
- Est. flood insurance / yr
- $507 – $1,088
Fire risk 1/10 · Minimal
- Est. fire insurance / yr
- $947 – $1,759
Heat risk 10/10 · Severe
- Hot days now (above 108°F)
- 7 days/yr
- Hot days in 30 yrs
- 30 days/yr
Wind risk 10/10 · Severe
- Chance of severe wind over 30 yrs
- 99.0%
Air-quality risk 2/10 · Minimal
- Unhealthy air days now
- 1 days/yr
- Unhealthy air days in 30 yrs
- 1 days/yr
Risk factors via First Street. Map © Google.
Why this score? — see what drove the C+ grade
The composite is a weighted blend of 9 inputs, each scored 0–100. Each bar is that input's sub-score; the figure is the points it added to the 100-point composite (weight × sub-score).
- Cash flow +21.3/30.0
- ARV discount +13.8/15.0
- DSCR +6.8/10.0
- 1% rule +5.3/10.0
- Schools +4.4/10.0
- Appreciation +4.2/10.0
- Rent growth +2.5/5.0
- Livability +2.5/5.0
- Condition / age +2.5/5.0
$674,900
🖨 Deal sheet (PDF) 📄 Offer letter ✓ Due diligence
Listing remarks
Experience the best of Florida living in this beautifully maintained home located in the gated community of University Place in Bradenton. Offering over 2,700 sq ft, this versatile floor plan features 4 bedrooms, 4 full bathrooms, a spacious loft/bonus room, private pool, and 2-car garage — perfectly designed for today’s flexible lifestyle. The open-concept kitchen and family room create an inviting central gathering space, while formal living and dining areas provide room for entertaining and special occasions. Large sliding glass doors open to the screened lanai and pool area, blending indoor comfort with outdoor Florida living. A highly desirable first-floor den with closet a
Key facts
- Gated community
- New a c system
- Open-concept kitchen
Tags
Property features AI
Finance
- Other: Community features include sidewalks and street lights; Pets allowed: cats and dogs
- Financial info: Total monthly HOA fees $112 (total annual fees $1,344); Lease restrictions apply
- HOA & community: Has HOA with monthly fee of $112; Association approval required; HOA amenities include fitness center, pool, trails; Association fee covers common area taxes, pool, escrow reserves, management, recreational facilities, and security
Exterior
- Parking: Attached 2-car garage
- Security: Gated community (community amenity); Association-provided security (included in HOA)
- Utilities: Public water; Canal/lake irrigation source; Public sewer; Electricity connected; Natural gas connected; Cable available; Phone available; Sewer connected; Water connected; Sprinkler system with recycled water; Underground utilities; Irrigation equipment
- Home design: Single family residence; Two levels; South-facing; Residential property; Located in a CDD community; Homestead exempt
- Construction: Stucco construction; Shingle roof; Slab foundation; Built by Lee Wetherington
- Exterior features: Screened patio/porch; Private mailbox; Sliding doors; Child-safety fenced, gunite, in-ground pool with lighting and screen enclosure; Mature landscaping; Corner lot; Oversized lot; Paved, public-maintained road
Interior
- Kitchen: Built-in oven; Convection oven; Cooktop; Dishwasher; Disposal; Microwave; Range hood; Refrigerator; Solid surface counters; Solid wood cabinets
- Bedrooms: 4 bedrooms
- Flooring: Carpet; Ceramic tile; Wood
- Bathrooms: 4 full bathrooms
- Heating & cooling: Central heating; Central air conditioning
- Interior features: Built-in features; Ceiling fans; Crown molding; High ceilings; Kitchen/family room combo; Living room/dining room combo; Open floorplan; Solid surface counters; Solid wood cabinets; Split bedroom plan; Thermostat; Walk-in closets; Window treatments
- Laundry & utility: Laundry room with washer and dryer hookups; Gas dryer hookup; Inside laundry
Neighborhood map
What this means for you Summary
Snapshot
- This is a 3-bed/4.0-bath single-family listed at $675k.
Deal economics
- At list price, monthly cash flow is $991 ($12k/yr) — positive.
- The deal already cash-flows at list — no discount required.
- Meets the 1% rule at list price ($7k rent vs $675k).
- Recommended offer: $594k (12.0% below list) — sets the bar for market timing.
- Cap rate 8.1% vs local median 3.3% in Lakewood Ranch — top-decile yield for the area; either an underpriced asset or a hidden risk that comps aren't pricing in. Stress-test before assuming the spread holds.
Location & tenants
- Location reads: area grade C — affects rentability + tenant quality, not the cash-flow math above.
- Manatee (suburban): math 54% / reading 50% proficiency, ranked #26 of 73 in FL (top 36%) — acceptable for families but not a draw, mixed tenant base, ~2y average lease.
- Zoned schools: Robert Willis Elementary School (math 83% / reading 79%, grade A+, #95 of 2,144 statewide, top 5%, 765 students, 22% FRL); Braden River High School (math 44% / reading 52%, grade D, #201 of 667 statewide, top 30%, 1,774 students, 45% FRL) — zoned schools average 33% FRL vs 51% district-wide (17 pts lower); this property's tenant base skews higher-income than the district average.
- Zoned-school proficiency averages 64% at this address vs 52% district-wide (+12 pts) — the actual schools serving this property are materially stronger than the Manatee average implies; a family-tenant draw the district grade alone would hide.
- Market conditions: 102 active listings in the ZIP; 11 comparable units currently listed for rent nearby; rentals at typical pace (median 17d on market — plan ~3-4 weeks tenant-placement turnaround); 7,472 units permitted in Manatee County in 2024 (1,782 in 5+ unit buildings).
Forward outlook
- Local home prices are declining (-1.6%/yr); year-one equity from $5k of loan paydown is wiped out by about $11k of value loss. Plan a longer hold.
- Manatee County population projected at +43% by 2050 — long-run rental-demand tailwind backs the buy-and-hold thesis.
Negotiation context
- It's been on market 337 days — a 12% lower offer ($594k) is reasonable based on typical stale-listing flexibility.
- 2 sale attempts; this cycle's ask has dropped $100k (13%) from the opening price — seller is motivated, your offer sets the floor, not the list.
- Current owner paid $110k; list at $675k implies a 511% gain — meaningful room to come down on a strong offer.
Risks & watch-outs
- Climate carrying-cost: severe wind risk, 99% chance of damaging wind over 30y; extreme-heat days projected 7→30/yr by 2055 (HVAC capex compounding) — expect insurance premiums to compound above CPI over the hold.
Questions for the listing agent
- It's been on market 337 days. Have you received any prior offers? Is the seller open to a 12% concession, seller financing, or rate buy-down credit?
- What does the HOA fee cover, when was the last increase, and are there any pending special assessments or reserve-fund shortfalls?
- Why hasn't it sold? Are there any deal-killer items the seller is aware of (foundation, flood, title, zoning, code violations)?
- Is there a deadline driving the sale (1031 exchange, divorce, estate, relocation)? That informs how much negotiation room exists.
- What's the average days-on-market for RENTAL listings here right now (not sales)? A rising rental-DOM trend means longer vacancies and softer asking-rent achievability than the comps imply.
- What's the recent tenant-quality profile in this submarket — average credit score on applications, eviction rate, late-payment / NSF rate, and stable-employment percentage? A property-management company in the area should have these aggregated.
- How much new for-sale + rental construction is in the pipeline within 1–3 miles? Heavy new supply typically softens prices + rents 12–24 months out; constrained supply supports both.
Investment metrics
- 1% rule
- 1.03% ✓
- Cap rate
- 8.05%
- Cash-on-cash
- 6.29%
- DSCR
- 1.28
- GRM
- 8.1
CMA / ARV
- ARV (on-the-fly)
- $785,608
- Comps found
- 12
Show comp detail 12 sales within ~0.75 mi
| Address | Dist | Beds/Ba | Sqft | Sold | Price | $/sf | Match |
|---|---|---|---|---|---|---|---|
| 7915 Edmonston Cir | 0.35mi | 3/3.0 | 2,627 (-5%) | 1mo | $725,000 | $276 | 70 |
| 7816 Ashley Cir | 0.22mi | 4/2.5 (+1) | 2,693 (-3%) | 11mo | $780,000 | $290 | 64 |
| 7815 Ashley Cir | 0.19mi | 4/3.0 (+1) | 3,151 (+14%) | 0mo | $600,000 | $190 | 59 |
| 7915 Warwick Gardens Ln | 0.57mi | 3/3.0 | 2,915 (+5%) | 3mo | $1,155,000 | $396 | 59 |
| 7204 Saint Georges Way | 0.52mi | 3/2.5 | 2,902 (+4%) | 6mo | $1,050,000 | $362 | 57 |
| 7519 Ascot Ct | 0.46mi | 3/2.5 | 2,674 (-4%) | 13mo | $1,283,000 | $480 | 56 |
| 7819 Ashley Cir | 0.20mi | 4/3.0 (+1) | 3,104 (+12%) | 13mo | $569,000 | $183 | 51 |
| 7905 Drayton Cir | 0.25mi | 4/3.0 (+1) | 2,435 (-12%) | 13mo | $769,000 | $316 | 48 |
| 7003 74th Street Cir E | 0.64mi | 4/3.0 (+1) | 2,894 (+4%) | 8mo | $660,000 | $228 | 47 |
| 7723 Heyward Cir | 0.38mi | 4/3.0 (+1) | 2,509 (-10%) | 13mo | $710,000 | $283 | 46 |
| 6977 74th Street Cir E | 0.66mi | 3/3.5 | 3,113 (+12%) | 11mo | $630,000 | $202 | 38 |
| 6996 74th Street Cir E | 0.66mi | 3/3.0 | 2,510 (-10%) | 20mo | $700,000 | $279 | 32 |
Match score weights: distance 35% · size 25% · config 20% · recency 20%. Top-matched comps best support the ARV.
Projected returns pro-forma
-1.61% appreciation · 3.0% rent growth · sell at horizon
- IRR
- -0.8%
- Equity multiple
- 0.97×
- Total profit
- $-6,134
- Equity at exit
- $143,302
- IRR
- 6.7%
- Equity multiple
- 1.60×
- Total profit
- $112,477
- Equity at exit
- $134,339
Cash invested: $188,972 (down + closing). Projections, not guarantees.
Landlord ↔ Tenant lean methodology
- Overall (STATE)
- 87 Strongly Landlord-Friendly
- State Florida
- 87 Strongly Landlord-Friendly · R+3
- County
- — inherits STATE
- City
- — inherits STATE
ZIP-level market 34201
- Home prices YoY
- -0.9%
- Active inventory
- 102
- Price-to-rent
- 8.1×
Monthly cashflow live
- Estimated rent
- $6,976 high interval (Pro) →
- Mortgage (P&I)
- −$3,539
- Tax from tax record
- −$587 /mo · $7,050/yr
- Insurance
- −$281
- HOA
- −$112
- Vacancy / Maint / Mgmt
- −$1,465
- Net cashflow
- $991
Break-even live
Sensitivity live
| Price | -10% $1,373 | -5% $1,182 | +0% $991 | +5% $800 | +10% $609 |
|---|---|---|---|---|---|
| Rent | -10% $440 | -5% $715 | +0% $991 | +5% $1,266 | +10% $1,542 |
| Rate | -1.0pp $1,331 | -0.5pp $1,162 | base $991 | +0.5pp $816 | +1.0pp $638 |
UW: 25.0% down · 7.5% · 30yr · 1.5% tax · 5.0% vac · 8.0% maint · 8.0% mgmt
Financing live
Cash to close
- Down payment
- $168,725
- Closing costs
- $20,247
- Reserves months
- —
- Total cash needed
- —
Loan-product check · same deal, 3 products live
Conventional
25% down · 7.5% · 30yr
- Down + closing
- —
- Monthly P&I
- —
- Monthly cashflow
- —
- DSCR
- —
- Eligible?
- —
Personal DTI + credit; lowest rate.
DSCR
20% down · 8.5% · 30yr
- Down + closing
- —
- Monthly P&I
- —
- Monthly cashflow
- —
- DSCR
- —
- Eligible?
- —
No personal income docs; deal must DSCR.
Hard money
10% down · 12.0% · 12mo
- Down + closing
- —
- Monthly P&I
- —
- Monthly cashflow
- —
- DSCR
- —
- Eligible?
- —
Short-term bridge; refi at stabilization.
Rent comps 11 comps
| Address | Beds | Baths | Sqft | Rent | $/sqft | DOM | Units | Dist |
|---|---|---|---|---|---|---|---|---|
| 7135 Kensington Ct University Park, FL | 2.0 | 2.0 | 2208 | $7,000 | $3.17 | 24d | 1 | 0.69mi |
| 6945 74th Street Cir E Bradenton, FL | 4.0 | 3.5 | 2930 | $3,300 | $1.13 | 17d | 1 | 0.84mi |
| 9405 Boxthorn Pl Bradenton, FL | 3.0 | 3.0 | 2669 | $6,900 | $2.59 | 4d | 1 | 0.89mi |
| 7005 Stanhope Pl University Park, FL | 4.0 | 3.0 | 2846 | $9,000 | $3.16 | 24d | 1 | 1.23mi |
| 7101 Victoria Cir University Park, FL | 3.0 | 2.5 | 2254 | $3,900 | $1.73 | 24d | 1 | 1.26mi |
| 6914 Stanhope Pl University Park, FL | 3.0 | 4.0 | 2951 | $8,000 | $2.71 | 4d | 1 | 1.27mi |
| 6909 Lennox Pl University Park, FL | 3.0 | 2.0 | 2032 | $6,500 | $3.20 | 17d | 1 | 1.30mi |
| 6939 Lennox Pl University Park, FL | 3.0 | 2.0 | 2034 | $8,300 | $4.08 | 24d | 1 | 1.30mi |
| 6920 Lennox Pl University Park, FL | 3.0 | 2.0 | 2044 | $8,300 | $4.06 | 24d | 1 | 1.34mi |
| 9910 Laurel Valley Avenue Cir Bradenton, FL | 3.0 | 2.5 | 2379 | $4,500 | $1.89 | 17d | 1 | 1.38mi |
| 6380 Rookery Cir Bradenton, FL | 4.0 | 3.0 | 2633 | $3,450 | $1.31 | 17d | 1 | 1.44mi |
HOA detail
- Monthly dues
- $112 · $1,344/yr
- Likely covers
- poolsecurity
Listing history 9 events
-
2026-05-23status Pending
-
2026-05-18price $674,900
-
2026-03-04price $698,500
-
2026-01-08price $725,000
-
2025-12-14status Active
-
2025-12-11historical
-
2025-12-10price $749,500
-
2025-06-17$775,000 Active
-
2004-04-08soldstatus $110,500
ⓘ Source: listings_history table (triggers on properties + properties_extension) + one-shot
backfill from property_details.listing_events for pre-trigger history.
Tax reassessment forecast FL · Resets to sale price
- Current annual tax
- $7,050 · $587/mo
- Projected year-2 tax
- $7,050 · $587/mo
- Expected delta
- $0/yr ($0/mo · 0.0%)
ⓘ Screening estimate from a state-policy table — verify with the county assessor before closing.
Climate risk First Street
- Flood 1/10 Low FEMA zone X (unshaded) · 0% chance over 30 yrs
- Wildfire 1/10 Low
- Heat 10/10 Extreme 7 d/yr ≥108°F today · 30 d/yr by 30 yrs out
- Wind 10/10 Extreme 99% chance of damaging wind over 30 yrs
- Air quality 2/10 Low 1 unhealthy d/yr today · 1 by 30 yrs out
Nearby sold comps map
Loading sold comps map…
Walkable amenities ~0.75 mi
Loading nearby amenities…
Taxation est. · year 1
- Rental income
- $83,707
- − Mortgage interest
- −$37,805
- − Property taxes
- −$7,050
- − Insurance
- −$3,374
- − Repairs & maintenance
- −$6,697
- − Management
- −$6,697
- − HOA
- −$1,344
- − Depreciation
- −$19,633
- Taxable income
- $1,107
- Est. tax owed @ 24.0%
- −$266
- After-tax cash flow
- $11,623/yr
For passive investors: Depreciation is non-cash, so a rental often shows a tax loss while cash-flowing — sheltering income. Rental losses are passive: they offset passive income freely, and up to $25,000/yr can offset ordinary (W-2) income if you actively participate and your MAGI is under $100k (phasing out to $0 by $150k); unused losses carry forward. On sale, claimed depreciation is recaptured at up to 25%, and gains may owe capital-gains tax (a 1031 exchange can defer both). Figures are a year-1 estimate at your 24.0% rate — not tax advice; consult a CPA.
Schools (NCES district)
- District
- Manatee
- NCES district ID
- 1201230
- Math proficiency
- 54% ▼ -6.00%
- Reading proficiency
- 50% ▼ -2.00%
- Median HH income
- $49,607
- Composite
- 44.43/100
- National rank
- #2806
- State rank
- #26 of 73 in FL
Livability — Lakewood Ranch
No livability data for this city. (Only ~50 U.S. cities are tracked.)
Census & demographics
- City population
- 52,177
- Population (ZIP)
- 3,993
Population outlook (Manatee County) Hauer SSP2
- Today (2025)
- 447,342 people
- By 2030
- 488,911 · +9.3%
- By 2040
- 567,934 · +27.0%
- By 2050
- 637,995 · +42.6%
- By 2075
- 781,970 · +74.8%
- By 2100
- 848,272 · +89.6%
Race, ethnicity, and origin ACS 2023
- Neighborhood character
- Predominantly White (87%)
- Race & ethnicity
- White 87% Hispanic / Latino 11% Two or more races 6% Asian 1%
- Hispanic origin (detail)
- Cuban 4%
- Common ancestry
- Lithuanian 8% Romanian 6% Scotch-Irish 3%
- Foreign-born
- 17% · Canada, South Korea, Dominican Republic
- Languages at home
- 80% English-only · German/W. Germanic 6% Russian/Polish/Slavic 6% Spanish 4%
Political lean MEDSL · Manatee
- 2024 margin
- Strong R (+23.5) · D 37.9% · R 61.4%
- 2008→2024 swing
- -16.5pp toward R · 2008: -7.0pp · 2024: -23.5pp
- All cycles
- 2024: R+23.5 2020: R+16.1 2016: R+17.1 2012: R+12.5 2008: R+7.0
Not yet ingested
- Civics
- —
Market trends
- HPI YoY
- ▼ -1.61%
- Current HPI
- 173.9689
- Rent YoY
- —
- Metro
- —
- State GDP YoY
- ▲ 3.28%
- F500 in state
- 36
Industry mix (Fortune 500 HQ in FL)
| Industry | F500 HQs | Revenue |
|---|---|---|
| Industrial Technology | 2 | $29B |
|
||
| Insurance | 2 | $17B |
|
||
| Retail | 1 | $60B |
|
||
| Technology Distribution | 1 | $58B |
|
||
| Homebuilding | 1 | $35B |
|
||
| Technology Manufacturing | 1 | $35B |
|
||
Price history
+510.8% since first listed9 events — show timeline
- 2026-05-23 Pending — Stellar MLS as Distributed by MLS Grid
- 2026-05-18 Price Changed $674,900 Stellar MLS as Distributed by MLS Grid
- 2026-03-04 Price Changed $698,500 Stellar MLS as Distributed by MLS Grid
- 2026-01-08 Price Changed $725,000 Stellar MLS as Distributed by MLS Grid
- 2025-12-14 Relisted — Stellar MLS as Distributed by MLS Grid
- 2025-12-11 Listing Removed — Stellar MLS as Distributed by MLS Grid
- 2025-12-10 Price Changed $749,500 Stellar MLS as Distributed by MLS Grid
- 2025-06-17 Listed $775,000 Stellar MLS as Distributed by MLS Grid
- 2004-04-08 Sold (Public Records) $110,500 Public Records
Property tax history
+1.3%/yrLatest (2024): $7,050 · +3.7% YoY. Source: county tax records.
Cash-flow waterfall
monthlySold comps — $/sqft
last 12 mo · ≤1 miLoading sold comps…