 Fourplex
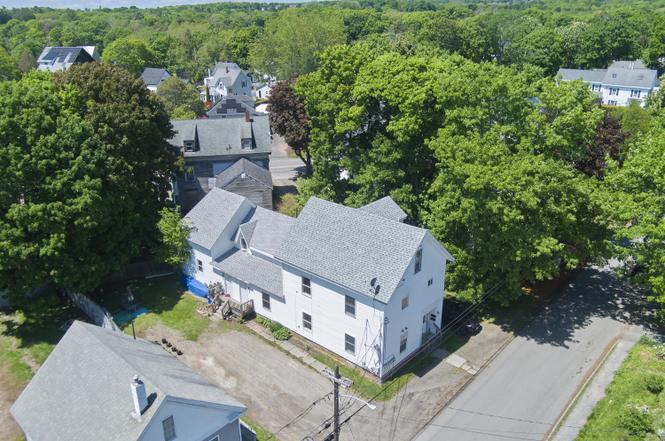
22 Rockland St · Rockland, ME
Flood risk 1/10 · Minimal
- FEMA flood zone
- X (unshaded)
- Chance of flooding over 30 yrs
- 0.0%
- Est. flood insurance / yr
- $473 – $860
Fire risk 1/10 · Minimal
- Est. fire insurance / yr
- $669 – $1,243
Heat risk 4/10 · Minor
- Hot days now (above 85°F)
- 7 days/yr
- Hot days in 30 yrs
- 17 days/yr
Wind risk 6/10 · Moderate
- Chance of severe wind over 30 yrs
- 73.0%
Air-quality risk 1/10 · Minimal
- Unhealthy air days now
- 0 days/yr
- Unhealthy air days in 30 yrs
- 0 days/yr
Risk factors via First Street. Map © Google.
Why this score? — see what drove the B grade
The composite is a weighted blend of 9 inputs, each scored 0–100. Each bar is that input's sub-score; the figure is the points it added to the 100-point composite (weight × sub-score).
- Cash flow +30.0/30.0
- 1% rule +10.0/10.0
- DSCR +10.0/10.0
- ARV discount +7.5/15.0
- Schools +6.8/10.0
- Livability +3.1/5.0
- Rent growth +2.5/5.0
- Condition / age +2.5/5.0
- Appreciation +0.0/10.0
$435,000
🖨 Deal sheet 📄 Offer letter ✓ Due diligence
Multi-family units
County records classify this as Multi-Family (5+ Unit). Listing-text estimate: 4 units. estimate disagrees with records
5+ unit building — per-unit beds/baths from public records are typically unavailable; the breakdown below (if shown) is an estimate from the listing text.
Listing remarks MLS
Investment opportunity, 4 unit apartment with positive cash flow. Over $130,000 in total renovation done in 2008, entire building 13-R SPRINKLER SYSTEM, new egress windows throughout, wired smoke detectors, new Monitor propane heaters in each apt, and much more. City did white glove Inspection back in 2008. The rent in each unit has not gone up since 2008, and are low for today's standards. Since 2008 there have been some damage from tenants that need additional repairs, paint, etc, but is manageable at this price. Broker owned.
Key facts
- 3-year-old roof
- New sewer line
- 7,405 sq ft lot
Tags
Property features AI
Finance
- Financial info: Gross income reported: $55,400; Operating expenses reported: $22,646; Actual rents by unit type: $700 (1-bed), $1,350 (2-bed), $1,200 (2-bed), $1,300 (2-bed)
Exterior
- Parking: Gravel on-site parking with 5–10 spaces
- Security: Fire sprinkler system
- Utilities: Public water; Public sewer; Utilities on; Electric water heater
- Home design: Multi-level building; Residential zoning; Built in 1860
- Construction: Wood frame construction with vinyl siding; Stone, granite, and brick/mortar foundation; Pitched shingle roof
- Exterior features: Intown location near shopping; Level lot; Seasonal harbor view of Rockland Harbor
Interior
- Kitchen: Refrigerator included in each unit
- Bedrooms: One 1-bedroom unit (third level); Three 2-bedroom units (first and second levels)
- Flooring: Carpet; Vinyl; Wood
- Bathrooms: Four full bathrooms (one per unit)
- Heating & cooling: Heating present in each unit; Direct vent heater; Circuit breaker electrical system
- Interior features: Carpet, vinyl, and wood flooring; Full unfinished basement with interior entry and bulkhead; dirt floor
- Laundry & utility: Dedicated water heater for each unit; Dedicated electric meter for each unit
Neighborhood map
What this means for you Summary
Snapshot
- This is a 4 × 7-bed/4.0-bath units multifamily listed at $435k.
Deal economics
- At list price, monthly cash flow is $5k ($56k/yr) — positive. Per door: $1k/mo.
- The deal already cash-flows at list — no discount required.
- Meets the 1% rule at list price ($10k rent vs $435k).
- Cap rate 19.2% vs local median 3.3% in Rockland — top-decile yield for the area; either an underpriced asset or a hidden risk that comps aren't pricing in. Stress-test before assuming the spread holds.
Location & tenants
- Location reads 62/100 on livability (#116 in ME) — a middle-class / working-renter tenant base. Strengths: cost of living A+, housing A+, crime A-; Watch: schools D, amenities F, commute F.
- RSU 13 (town): math 77% / reading 85% proficiency, ranked #84 of 112 in ME (top 75%) — strong family-tenant draw, lease renewals of 3-5y typical.
- Market conditions: 71 active listings in the ZIP; 160 units permitted in Knox County in 2024 (58 in 5+ unit buildings).
- At $9,712/mo this rent would consume 206% of the median local household income ($57k/yr) (locally 279% of renters already pay >50% of income on rent) — very limited rent-growth headroom before tenants either downsize or default.
Forward outlook
- Local home prices are declining (-3.0%/yr); year-one equity from $3k of loan paydown is wiped out by about $13k of value loss. Plan a longer hold.
- Knox County population projected at -14% by 2050 — secular population decline; favor cash flow + early exit over multi-decade hold.
- At projected returns (-3.0% appreciation + 3.0% rent growth), your $122k cash investment doubles in ~3 years — after that, you're playing with house money.
Negotiation context
- Only 2 days on market — expect competitive offers; lowballing is unlikely to land.
- 3 sale attempts since 21y ago with the ask held roughly flat each time — persistent listings suggest the price (not the market) is what's stuck; bring a comps-based counter.
- Current owner paid $210k; list at $435k implies a 107% gain — meaningful room to come down on a strong offer.
Risks & watch-outs
- Watch-outs: built in 1860 — expect roof / HVAC / electrical / plumbing capex.
- Climate carrying-cost: major wind risk, 73% chance of damaging wind over 30y — expect insurance premiums to compound above CPI over the hold.
Questions for the listing agent
- Can we see the unit-by-unit rent roll, current vacancy, and any below-market leases? What's the average tenancy length?
- What capital expenditures (roof, boiler, parking lot, exteriors) have been made in the last 5 years, and what's planned in the next 2?
- Built in 1860 — when were the roof, HVAC, electrical panel, plumbing, and water heater last replaced?
- Is there a deadline driving the sale (1031 exchange, divorce, estate, relocation)? That informs how much negotiation room exists.
- Schools are D-rated, which usually means shorter tenancies and higher turnover. Who's the typical renter profile here, and what's been the actual vacancy rate?
- What's the average days-on-market for RENTAL listings here right now (not sales)? A rising rental-DOM trend means longer vacancies and softer asking-rent achievability than the comps imply.
- What's the recent tenant-quality profile in this submarket — average credit score on applications, eviction rate, late-payment / NSF rate, and stable-employment percentage? A property-management company in the area should have these aggregated.
- How much new apartment / multifamily construction is in the pipeline within 1–3 miles? Heavy new supply (>2% of stock underway) typically softens rents 12–24 months out; light construction supports rent growth.
Investment metrics
- 1% rule
- 2.23% ✓
- Cap rate
- 19.15%
- Cash-on-cash
- 45.93%
- DSCR
- 3.04
- GRM
- 3.7
CMA / ARV
No comps found within radius.
Projected returns pro-forma
-3.0% appreciation · 3.0% rent growth · sell at horizon
- IRR
- 43.1%
- Equity multiple
- 2.86×
- Total profit
- $226,573
- Equity at exit
- $64,860
- IRR
- 49.2%
- Equity multiple
- 5.76×
- Total profit
- $580,224
- Equity at exit
- $37,611
Cash invested: $121,800 (down + closing). Projections, not guarantees.
Landlord ↔ Tenant lean methodology
- Overall (STATE)
- 41 Moderately Tenant-Leaning
- State Maine
- 41 Moderately Tenant-Leaning · D+2
- County
- — inherits STATE
- City
- — inherits STATE
ZIP-level market 04841
- Home prices YoY
- -17.8%
- Active inventory
- 71
- Price-to-rent
- 14.9×
Monthly cashflow live
- Estimated rent
- $9,712 medium interval (Pro) →
- Mortgage (P&I)
- −$2,281
- Tax from tax record
- −$548 /mo · $6,579/yr
- Insurance
- −$181
- HOA
- −$0
- Vacancy / Maint / Mgmt
- −$2,040
- Net cashflow
- $4,662
Break-even live
4-unit breakdown (identical units grouped — click to expand)
| Units | Beds | Baths | Est. rent |
|---|---|---|---|
| 4× units | 7 | 4 | $9,712 |
| #1 | 7 | 4 | $2,428 |
| #2 | 7 | 4 | $2,428 |
| #3 | 7 | 4 | $2,428 |
| #4 | 7 | 4 | $2,428 |
| Total (4 units) | $9,712 | ||
UW: 25.0% down · 7.5% · 30yr · 1.5% tax · 5.0% vac · 8.0% maint · 8.0% mgmt
Financing live
Cash to close
- Down payment
- $108,750
- Closing costs
- $13,050
- Reserves months
- —
- Total cash needed
- —
Loan-product check · same deal, 3 products live
Conventional
25% down · 7.5% · 30yr
- Down + closing
- —
- Monthly P&I
- —
- Monthly cashflow
- —
- DSCR
- —
- Eligible?
- —
Personal DTI + credit; lowest rate.
DSCR
20% down · 8.5% · 30yr
- Down + closing
- —
- Monthly P&I
- —
- Monthly cashflow
- —
- DSCR
- —
- Eligible?
- —
No personal income docs; deal must DSCR.
Hard money
10% down · 12.0% · 12mo
- Down + closing
- —
- Monthly P&I
- —
- Monthly cashflow
- —
- DSCR
- —
- Eligible?
- —
Short-term bridge; refi at stabilization.
Listing history 3 events
-
2026-06-18days on market $435,000 Active 2 DOM
-
2026-06-16remarks 444-char remark
-
2026-06-16$435,000 Active 1 DOM
ⓘ Source: listings_history table (triggers on properties + properties_extension) + one-shot
backfill from property_details.listing_events for pre-trigger history.
Tax reassessment forecast ME · Partial reset (capped growth)
- Current annual tax
- $6,579 · $548/mo
- Projected year-2 tax
- $6,579 · $548/mo
- Expected delta
- $0/yr ($0/mo · 0.0%)
ⓘ Screening estimate from a state-policy table — verify with the county assessor before closing.
Climate risk First Street
- Flood 1/10 Low FEMA zone X (unshaded) · 0% chance over 30 yrs
- Wildfire 1/10 Low
- Heat 4/10 Moderate 7 d/yr ≥85°F today · 17 d/yr by 30 yrs out
- Wind 6/10 Major 73% chance of damaging wind over 30 yrs
- Air quality 1/10 Low 0 unhealthy d/yr today · 0 by 30 yrs out
Nearby sold comps map
Loading sold comps map…
Walkable amenities ~0.75 mi
Loading nearby amenities…
Taxation est. · year 1
- Rental income
- $116,544
- − Mortgage interest
- −$24,367
- − Property taxes
- −$6,579
- − Insurance
- −$2,175
- − Repairs & maintenance
- −$9,324
- − Management
- −$9,324
- − Depreciation
- −$12,655
- Taxable income
- $52,122
- Est. tax owed @ 24.0%
- −$12,509
- After-tax cash flow
- $43,432/yr
For passive investors: Depreciation is non-cash, so a rental often shows a tax loss while cash-flowing — sheltering income. Rental losses are passive: they offset passive income freely, and up to $25,000/yr can offset ordinary (W-2) income if you actively participate and your MAGI is under $100k (phasing out to $0 by $150k); unused losses carry forward. On sale, claimed depreciation is recaptured at up to 25%, and gains may owe capital-gains tax (a 1031 exchange can defer both). Figures are a year-1 estimate at your 24.0% rate — not tax advice; consult a CPA.
Schools (NCES district)
- District
- RSU 13
- NCES district ID
- 2314787
- Math proficiency
- 77% ▲ 51.00%
- Reading proficiency
- 85% ▲ 36.00%
- Median HH income
- $43,177
- Composite
- 67.81/100
- National rank
- #363
- State rank
- #84 of 112 in ME
Livability — Rockland
- Score
- 62/100
- State rank
- #116
- US rank
- #16831
Category grades
Schools grade is shown separately in the Schools card above.
Census & demographics
- Census place
- Rockland, ME
- County
- Knox County · 7,035 people
- City population
- 7,035
- Metro
- nan
- Population (ZIP)
- 7,035
- Household income
- $56,533
- Rent vs Own
- Severe rent burden
- 279.0
Population outlook (Knox County) Hauer SSP2
- Today (2025)
- 39,304 people
- By 2030
- 38,497 · -2.1%
- By 2040
- 36,090 · -8.2%
- By 2050
- 33,681 · -14.3%
- By 2075
- 29,934 · -23.8%
- By 2100
- 24,633 · -37.3%
Race, ethnicity, and origin ACS 2023
- Neighborhood character
- Predominantly White (97%)
- Race & ethnicity
- White 97% Two or more races 3%
- Common ancestry
- Slovak 12% Serbian 8% Lithuanian 5%
- Foreign-born
- 1% · Canada
- Languages at home
- 97% English-only · French/Haitian/Cajun 2%
Political lean MEDSL · Knox
- 2024 margin
- D (+18.6) · D 58.2% · R 39.6% · Other 2.1%
- 2008→2024 swing
- -2.8pp toward R · 2008: 21.4pp · 2024: 18.6pp
- All cycles
- 2024: D+18.6 2020: D+19.9 2016: D+14.3 2012: D+22.6 2008: D+21.4
Not yet ingested
- Civics
- —
Market trends
- HPI YoY
- ▼ -73.90%
- Current HPI
- 341.7862
- Rent YoY
- —
- Metro
- nan
- State GDP YoY
- —
- F500 in state
- 0
Price history
+97.7% since first listed5 events — show timeline
- 2026-06-16 Listed $435,000 MREIS
- 2020-03-24 Sold (MLS) $210,000 MREIS
- 2020-02-02 Pending — MREIS
- 2020-01-10 Listed $220,000 MREIS
- 2005-06-16 Listed $220,000 MREIS
Property tax history
+4.5%/yrLatest (2025): $6,579 · +20.4% YoY. Source: county tax records.
Cash-flow waterfall
monthlySold comps — $/sqft
last 12 mo · ≤1 miLoading sold comps…