 Duplex
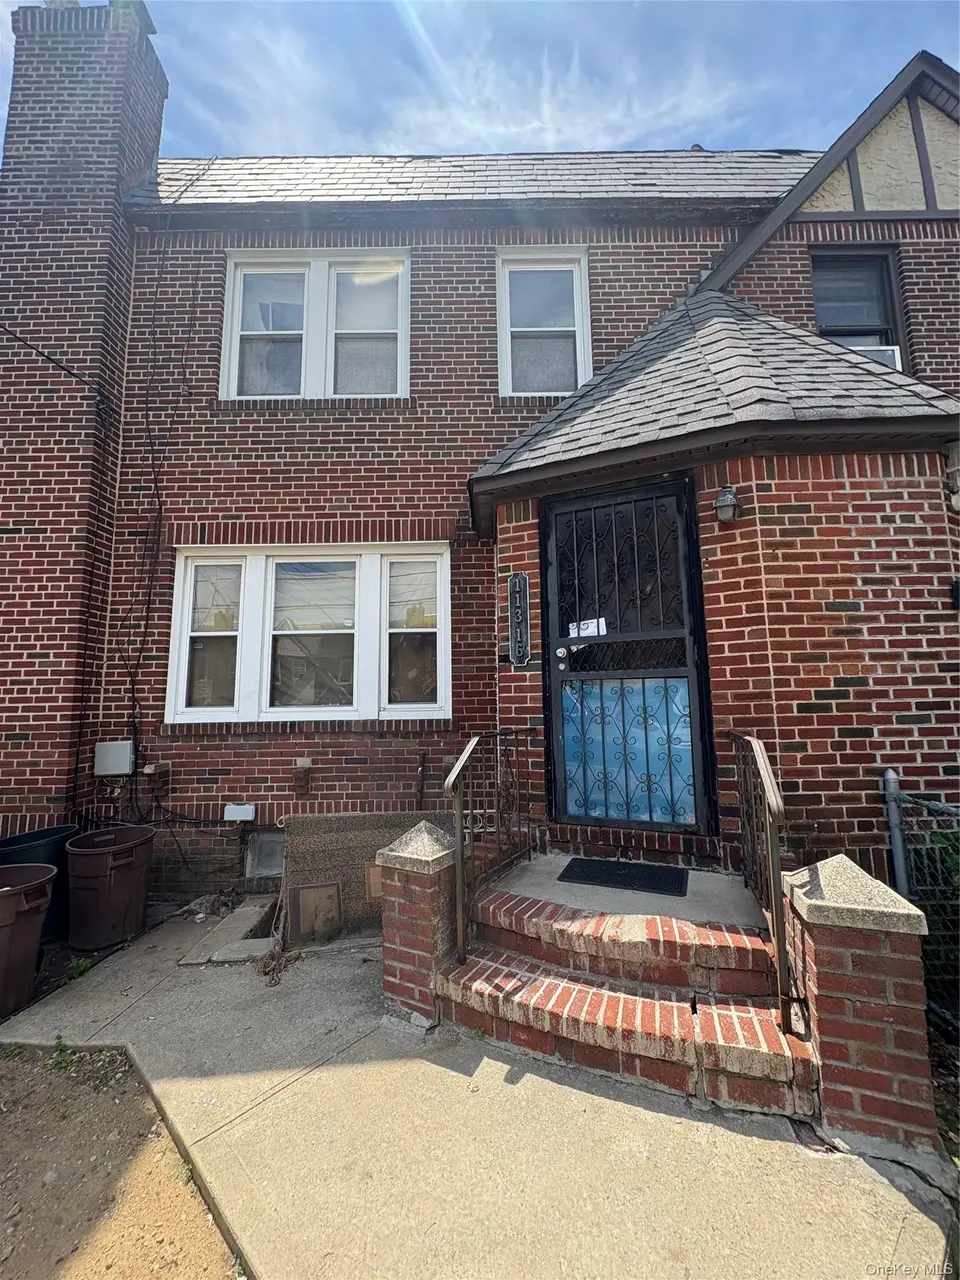
113-16 204 St · New York, NY
Flood risk 1/10 · Minimal
- FEMA flood zone
- X (unshaded)
- Chance of flooding over 30 yrs
- 0.0%
- Est. flood insurance / yr
- $507 – $1,088
Fire risk 1/10 · Minimal
- Est. fire insurance / yr
- $691 – $1,283
Heat risk 7/10 · Major
- Hot days now (above 97°F)
- 7 days/yr
- Hot days in 30 yrs
- 16 days/yr
Wind risk 6/10 · Moderate
- Chance of severe wind over 30 yrs
- 54.0%
Air-quality risk 4/10 · Minor
- Unhealthy air days now
- 6 days/yr
- Unhealthy air days in 30 yrs
- 6 days/yr
Risk factors via First Street. Map © Google.
Why this score? — see what drove the C- grade
The composite is a weighted blend of 9 inputs, each scored 0–100. Each bar is that input's sub-score; the figure is the points it added to the 100-point composite (weight × sub-score).
- ARV discount +15.0/15.0
- Cash flow +14.2/30.0
- Schools +5.0/10.0
- DSCR +4.3/10.0
- Livability +3.8/5.0
- 1% rule +2.9/10.0
- Rent growth +2.5/5.0
- Condition / age +2.5/5.0
- Appreciation +0.0/10.0
$600,000
🖨 Deal sheet (PDF) 📄 Offer letter ✓ Due diligence
Multi-family units
County records classify this as Multi-Family (2-4 Unit). Listing-text estimate: 2 units. confirmed
Listing remarks
2 family needs TLC . 2 bedroom apartment over a one bedroom over a basement with its own entrance.
Key facts
- Parking
- Built 1935
- Listed 3 days
Property features AI
Exterior
- Parking: Carport with 1 space; Alley access
- Utilities: Public sewer; Electricity connected; Natural gas connected
- Home design: Duplex
- Construction: Block and brick construction
- Exterior features: No waterfront; No additional parcels
Interior
- Bedrooms: Bedroom on the first floor
- Heating & cooling: Natural gas heating; No cooling
- Interior features: First-floor bedroom; Full unfinished walk-out basement
Neighborhood map
What this means for you Summary
Snapshot
- This is a 1×2bd/1.0ba + 1×1bd/1.0ba units multifamily listed at $600k.
Deal economics
- At list price, monthly cash flow is $104 ($1k/yr) — positive. Per door: $52/mo.
- The deal already cash-flows at list — no discount required.
- To meet the 1% rule (rent ≥ 1% of price), the offer needs to be $471k (21.5% below list).
- Recommended offer: $471k (21.5% below list) — sets the bar for 1% rule.
- Cap rate 6.5% vs local median 2.6% in New York — top-decile yield for the area; either an underpriced asset or a hidden risk that comps aren't pricing in. Stress-test before assuming the spread holds.
Location & tenants
- Location reads 75/100 on livability (#268 in NY, #4,188 nationally) — a middle-class / working-renter tenant base. Strengths: amenities A+, commute A+, health & safety A; Watch: crime F, cost of living F.
- Market conditions: 145 active listings in the ZIP; 21 comparable units currently listed for rent nearby; rentals at typical pace (median 25d on market — plan ~3-4 weeks tenant-placement turnaround); 5,302 units permitted in Queens County in 2024 (4,918 in 5+ unit buildings).
Forward outlook
- Local home prices are declining (-3.0%/yr); year-one equity from $4k of loan paydown is wiped out by about $18k of value loss. Plan a longer hold.
- Queens County population projected at +16% by 2050 — long-run rental-demand tailwind backs the buy-and-hold thesis.
Negotiation context
- Only 4 days on market — expect competitive offers; lowballing is unlikely to land.
Risks & watch-outs
- Watch-outs: built in 1935 — expect roof / HVAC / electrical / plumbing capex.
- Climate carrying-cost: major wind risk, 54% chance of damaging wind over 30y; extreme-heat days projected 7→16/yr by 2055 (HVAC capex compounding) — expect insurance premiums to compound above CPI over the hold.
Questions for the listing agent
- Can we see the unit-by-unit rent roll, current vacancy, and any below-market leases? What's the average tenancy length?
- What capital expenditures (roof, boiler, parking lot, exteriors) have been made in the last 5 years, and what's planned in the next 2?
- Built in 1935 — when were the roof, HVAC, electrical panel, plumbing, and water heater last replaced?
- Is there a deadline driving the sale (1031 exchange, divorce, estate, relocation)? That informs how much negotiation room exists.
- Schools are B-rated — typically a magnet for longer-tenancy family renters. What's the average tenant stay here, and is there a school-zone premium baked into asking?
- Crime grade is F in this area — have there been break-ins, vandalism, or insurance claims at this property in the last 3 years? What carrier currently insures it and at what premium?
- What's the average days-on-market for RENTAL listings here right now (not sales)? A rising rental-DOM trend means longer vacancies and softer asking-rent achievability than the comps imply.
- What's the recent tenant-quality profile in this submarket — average credit score on applications, eviction rate, late-payment / NSF rate, and stable-employment percentage? A property-management company in the area should have these aggregated.
- How much new apartment / multifamily construction is in the pipeline within 1–3 miles? Heavy new supply (>2% of stock underway) typically softens rents 12–24 months out; light construction supports rent growth.
Investment metrics
- 1% rule
- 0.79% ✗
- Cap rate
- 6.50%
- Cash-on-cash
- 0.74%
- DSCR
- 1.03
- GRM
- 10.6
CMA / ARV
- ARV (on-the-fly)
- $848,640
- Comps found
- 8
Show comp detail 8 sales within ~0.75 mi
| Address | Dist | Beds/Ba | Sqft | Sold | Price | $/sf | Match |
|---|---|---|---|---|---|---|---|
| 112-02 204 St | 0.12mi | 4/3.0 | 1,530 (+12%) | 10mo | $954,000 | $624 | 65 |
| 118-32 200th St | 0.64mi | 6/4.0 | 1,368 (+1%) | 6mo | $1,310,000 | $958 | 64 |
| 194-56 Murdock Ave | 0.41mi | 4/2.0 | 1,516 (+12%) | 2mo | $896,700 | $591 | 61 |
| 118-27 201st St | 0.61mi | 6/3.0 | 1,248 (-8%) | 3mo | $1,240,000 | $994 | 56 |
| 19124 Murdock Ave | 0.57mi | 6/4.0 | 1,509 (+11%) | 2mo | $980,000 | $649 | 53 |
| 189-18 114 Dr | 0.71mi | 4/2.0 | 1,473 (+8%) | 8mo | $880,000 | $597 | 47 |
| 117-33 219th St | 0.75mi | 3/2.0 | 1,296 (-5%) | 16mo | $620,000 | $478 | 44 |
| 116-42 193rd St | 0.71mi | 3/3.0 | 1,480 (+9%) | 11mo | $750,000 | $507 | 43 |
Match score weights: distance 35% · size 25% · config 20% · recency 20%. Top-matched comps best support the ARV.
Projected returns pro-forma
-3.0% appreciation · 3.0% rent growth · sell at horizon
- IRR
- -15.2%
- Equity multiple
- 0.46×
- Total profit
- $-90,872
- Equity at exit
- $89,462
- IRR
- -6.7%
- Equity multiple
- 0.57×
- Total profit
- $-71,650
- Equity at exit
- $51,877
Cash invested: $168,000 (down + closing). Projections, not guarantees.
Landlord ↔ Tenant lean methodology
- Overall (CITY)
- 0 Strongly Tenant-Friendly
- State New York
- 15 Strongly Tenant-Friendly · D+10
- County
- — inherits STATE
- City New York
- 0 Strongly Tenant-Friendly · D+34
ZIP-level market 11412
- Active inventory
- 145
- Price-to-rent
- 21.2×
Monthly cashflow live
- Estimated rent
- $4,712 high interval (Pro) →
- Mortgage (P&I)
- −$3,146
- Tax from tax record
- −$222 /mo · $2,667/yr
- Insurance
- −$250
- HOA
- −$0
- Vacancy / Maint / Mgmt
- −$990
- Net cashflow
- $104
Break-even live
Sensitivity live
| Price | -10% $443 | -5% $274 | +0% $104 | +5% $-66 | +10% $-236 |
|---|---|---|---|---|---|
| Rent | -10% $-269 | -5% $-82 | +0% $104 | +5% $290 | +10% $476 |
| Rate | -1.0pp $406 | -0.5pp $256 | base $104 | +0.5pp $-52 | +1.0pp $-210 |
2-unit breakdown (identical units grouped — click to expand)
| Units | Beds | Baths | Est. rent |
|---|---|---|---|
| 1× unit | 2 | 1 | $2,356 |
| 1× unit | 1 | 1 | $2,356 |
| Total (2 units) | $4,712 | ||
UW: 25.0% down · 7.5% · 30yr · 1.5% tax · 5.0% vac · 8.0% maint · 8.0% mgmt
Financing live
Cash to close
- Down payment
- $150,000
- Closing costs
- $18,000
- Reserves months
- —
- Total cash needed
- —
Loan-product check · same deal, 3 products live
Conventional
25% down · 7.5% · 30yr
- Down + closing
- —
- Monthly P&I
- —
- Monthly cashflow
- —
- DSCR
- —
- Eligible?
- —
Personal DTI + credit; lowest rate.
DSCR
20% down · 8.5% · 30yr
- Down + closing
- —
- Monthly P&I
- —
- Monthly cashflow
- —
- DSCR
- —
- Eligible?
- —
No personal income docs; deal must DSCR.
Hard money
10% down · 12.0% · 12mo
- Down + closing
- —
- Monthly P&I
- —
- Monthly cashflow
- —
- DSCR
- —
- Eligible?
- —
Short-term bridge; refi at stabilization.
Rent comps 21 comps
| Address | Beds | Baths | Sqft | Rent | $/sqft | DOM | Units | Dist |
|---|---|---|---|---|---|---|---|---|
| 11141 202nd St Saint Albans, NY | 3.0 | 1.0 | 900 | $2,750 | $3.06 | 25d | 1 | 0.14mi |
| 11516 199th St Saint Albans, NY | 3.0 | 2.0 | 1000 | $3,800 | $3.80 | 25d | 1 | 0.36mi |
| 10933 Francis Lewis Blvd Queens Village, NY | 3.0 | 1.5 | 1492 | $4,000 | $2.68 | 25d | 1 | 0.41mi |
| 20207 Linden Blvd Saint Albans, NY | 3.0 | 1.0 | 1584 | $3,400 | $2.15 | 25d | 1 | 0.48mi |
| 200-03 109th Ave Unit 2nd flr Jamaica, NY | 3.0 | 2.0 | 1300 | $3,200 | $2.46 | 5d | 1 | 0.50mi |
| 104-23 203rd St Unit 1 Jamaica, NY | 2.0 | 1.0 | 900 | $2,975 | $3.31 | 12d | 1 | 0.50mi |
| 191-28 114th Dr Unit 1 St. Albans, NY | 3.0 | 2.0 | 1767 | $3,150 | $1.78 | 25d | 1 | 0.59mi |
| 21511 111th Rd Queens Village, NY | 2.0 | 1.0 | 1812 | $3,100 | $1.71 | 25d | 1 | 0.66mi |
| 20120 120th Ave Saint Albans, NY | 3.0 | 2.0 | 1040 | $3,500 | $3.37 | 19d | 1 | 0.80mi |
| 12033 200th St Saint Albans, NY | 1.0 | 1.0 | 1099 | $2,000 | $1.82 | 14d | 1 | 0.86mi |
| 11521 222nd St Cambria Heights, NY | 3.0 | 1.5 | 1250 | $3,500 | $2.80 | 25d | 1 | 0.87mi |
| 190-24 102nd Ave Unit First floor Jamaica, NY | 3.0 | 1.5 | 1000 | $3,000 | $3.00 | 25d | 1 | 0.88mi |
| 12054 194th St Saint Albans, NY | 3.0 | 1.0 | 1099 | $3,200 | $2.91 | 25d | 1 | 1.04mi |
| 104-18 220th St Unit 2nd flr Queens Village, NY | 3.0 | 2.0 | 1150 | $3,200 | $2.78 | 19d | 1 | 1.09mi |
| 193-14 Jamaica Ave Unit 2 Floor Jamaica, NY | 3.0 | 2.0 | 1000 | $3,195 | $3.19 | 12d | 1 | 1.09mi |
| 22518 112th Ave Queens Village, NY | 3.0 | 1.0 | 1452 | $3,500 | $2.41 | 19d | 1 | 1.09mi |
| 197-10 Foothill Ave Unit 1st floor Jamaica, NY | 3.0 | 2.0 | 1100 | $3,600 | $3.27 | 7d | 1 | 1.36mi |
| 8789 191st St Hollis, NY | 3.0 | 2.0 | 1374 | $3,600 | $2.62 | 25d | 1 | 1.40mi |
| 177-47 106th Ave Unit First floor Jamaica, NY | 3.0 | 1.0 | 1600 | $3,300 | $2.06 | 15d | 1 | 1.44mi |
| 17724 106th Ave Jamaica, NY | 3.0 | 1.0 | 1600 | $3,500 | $2.19 | 25d | 1 | 1.47mi |
| 10940 175th St Jamaica, NY | 3.0 | 1.5 | 1300 | $4,000 | $3.08 | 19d | 1 | 1.48mi |
Listing history 4 events
-
2026-06-09days on market $600,000 Active 4 DOM
-
2026-06-08days on market $600,000 Active 3 DOM
-
2026-06-07remarks 98-char remark
-
2026-06-07$600,000 Active 2 DOM
ⓘ Source: listings_history table (triggers on properties + properties_extension) + one-shot
backfill from property_details.listing_events for pre-trigger history.
Tax reassessment forecast NY · Partial reset (capped growth)
- Current annual tax
- $2,667 · $222/mo
- Projected year-2 tax
- $6,404 · $534/mo
- Expected delta
- +$3,736/yr (+$311/mo · 140.1%)
ⓘ Screening estimate from a state-policy table — verify with the county assessor before closing.
Climate risk First Street
- Flood 1/10 Low FEMA zone X (unshaded) · 0% chance over 30 yrs
- Wildfire 1/10 Low
- Heat 7/10 Severe 7 d/yr ≥97°F today · 16 d/yr by 30 yrs out
- Wind 6/10 Major 54% chance of damaging wind over 30 yrs
- Air quality 4/10 Moderate 6 unhealthy d/yr today · 6 by 30 yrs out
Nearby sold comps map
Loading sold comps map…
Walkable amenities ~0.75 mi
Loading nearby amenities…
Taxation est. · year 1
- Rental income
- $56,544
- − Mortgage interest
- −$33,609
- − Property taxes
- −$2,667
- − Insurance
- −$3,000
- − Repairs & maintenance
- −$4,524
- − Management
- −$4,524
- − Depreciation
- −$17,455
- Taxable loss
- −$9,234
- Est. tax savings @ 24.0%
- +$2,216
- After-tax cash flow
- $3,461/yr
For passive investors: Depreciation is non-cash, so a rental often shows a tax loss while cash-flowing — sheltering income. Rental losses are passive: they offset passive income freely, and up to $25,000/yr can offset ordinary (W-2) income if you actively participate and your MAGI is under $100k (phasing out to $0 by $150k); unused losses carry forward. On sale, claimed depreciation is recaptured at up to 25%, and gains may owe capital-gains tax (a 1031 exchange can defer both). Figures are a year-1 estimate at your 24.0% rate — not tax advice; consult a CPA.
Schools (NCES district)
No district data.
Livability — New York
- Score
- 75/100
- State rank
- #268
- US rank
- #4188
Category grades
Schools grade is shown separately in the Schools card above.
Census & demographics
- Census place
- New York, NY
- City population
- 7,731,280
- Population (ZIP)
- 41,350
Population outlook (Queens County) Hauer SSP2
- Today (2025)
- 2,546,320 people
- By 2030
- 2,643,059 · +3.8%
- By 2040
- 2,815,563 · +10.6%
- By 2050
- 2,944,423 · +15.6%
- By 2075
- 3,123,338 · +22.7%
- By 2100
- 3,098,688 · +21.7%
Race, ethnicity, and origin ACS 2023
- Neighborhood character
- Predominantly Black (78%)
- Race & ethnicity
- Black 78% Hispanic / Latino 9% Two or more races 5% Asian 4% White 1%
- Hispanic origin (detail)
- Puerto Rican 3% Dominican 2%
- Common ancestry
- Hispanic 7%
- Foreign-born
- 42% · Canada
- Languages at home
- 82% English-only · French/Haitian/Cajun 6% Spanish 6% Other Indo-European 3%
Political lean MEDSL · Queens
- 2024 margin
- Strong D (+24.6) · D 62.3% · R 37.7%
- 2008→2024 swing
- -26.2pp toward R · 2008: 50.8pp · 2024: 24.6pp
- All cycles
- 2024: D+24.6 2020: D+45.2 2016: D+53.4 2012: D+58.5 2008: D+50.8
Not yet ingested
- Civics
- —
Market trends
- HPI YoY
- ▼ -413.59%
- Current HPI
- 302.063
- Rent YoY
- —
- Metro
- —
- State GDP YoY
- ▲ 2.60%
- F500 in state
- 92
Industry mix (Fortune 500 HQ in NY)
| Industry | F500 HQs | Revenue |
|---|---|---|
| Financial Services | 10 | $950B |
|
||
| Consumer Goods | 9 | $162B |
|
||
| Insurance | 4 | $225B |
|
||
| Telecommunications | 2 | $144B |
|
||
| Pharmaceuticals | 2 | $112B |
|
||
| Media / Entertainment | 2 | $69B |
|
||
Price history
1 event — show timeline
- 2026-06-05 Listed $600,000 OneKey® MLS as Distributed by MLS Grid
Property tax history
+1.7%/yrLatest (2025): $2,667 · -49.6% YoY. Source: county tax records.
Cash-flow waterfall
monthlySold comps — $/sqft
last 12 mo · ≤1 miLoading sold comps…