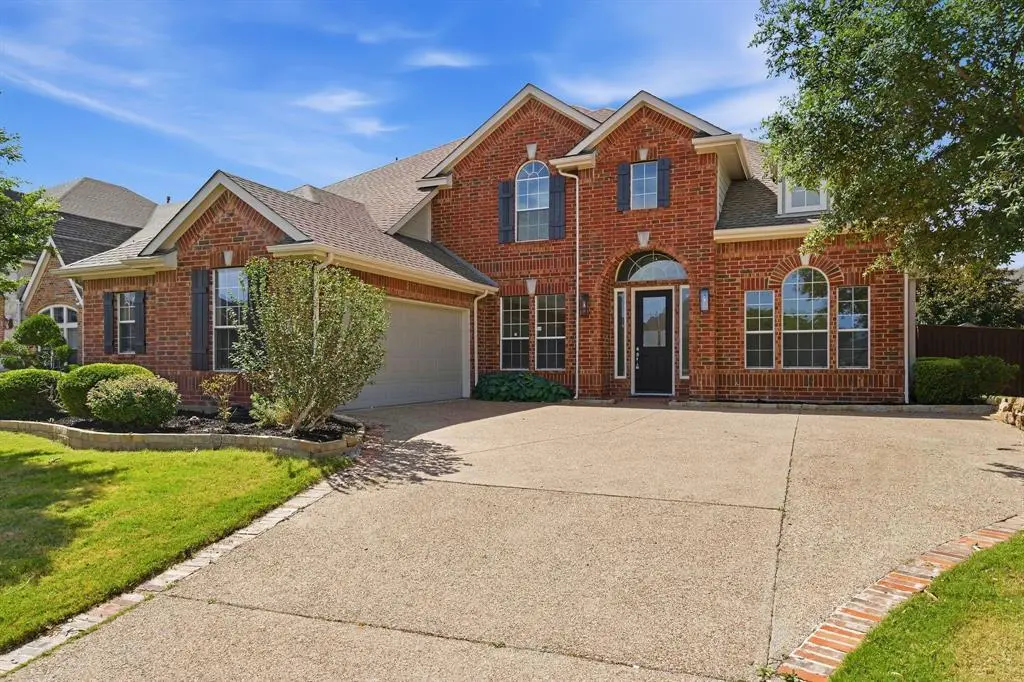
1913 Grand Park Place Ln · Flower Mound, TX
Flood risk 1/10 · Minimal
- FEMA flood zone
- X (unshaded)
- Chance of flooding over 30 yrs
- 0.0%
- Est. flood insurance / yr
- $507 – $1,088
Fire risk 1/10 · Minimal
- Est. fire insurance / yr
- $1,222 – $2,270
Heat risk 7/10 · Major
- Hot days now (above 110°F)
- 7 days/yr
- Hot days in 30 yrs
- 22 days/yr
Wind risk 4/10 · Minor
- Chance of severe wind over 30 yrs
- 22.0%
Air-quality risk 4/10 · Minor
- Unhealthy air days now
- 4 days/yr
- Unhealthy air days in 30 yrs
- 5 days/yr
Risk factors via First Street. Map © Google.
Why this score? — see what drove the F grade
The composite is a weighted blend of 9 inputs, each scored 0–100. Each bar is that input's sub-score; the figure is the points it added to the 100-point composite (weight × sub-score).
- ARV discount +5.1/15.0
- Schools +4.7/10.0
- Cash flow +3.8/30.0
- Livability +3.6/5.0
- Condition / age +2.5/5.0
- Rent growth +2.4/5.0
- 1% rule +0.2/10.0
- DSCR +0.0/10.0
- Appreciation +0.0/10.0
$699,900
🖨 Deal sheet 📄 Offer letter ✓ Due diligence
Listing remarks
Welcome home to this beautifully refined 5-bedroom 3.5-bathroom home in Grand Park Estates where comfort & lifestyle come together seamlessly. This architecturally designed home balances open concept living & intimate spaces together for inspired daily living. When you enter you feel the soaring ceilings & beautiful curves of the staircase showcased in the Grand Foyer. Perfectly placed windows throughout the home flood refreshing natural light on perfect display when you enter into the family room. The chef-inspired kitchen overlooks the family room keeping everyone connected, with plenty of space for daily family living, entertaining guests & includes
Key facts
- Freestanding tub
- Grand foyer
- Primary suite
Tags
Property features AI
Finance
- Other: Treat as clear loan type
- HOA & community: Mandatory association; Annual HOA fee of $500; HOA includes management fees; HOA management company: XYZ
Exterior
- Parking: Attached 2-car garage; 2 covered parking spaces; Driveway; Garage door opener; Lighted parking area; Concrete surfaces
- Security: Audio and video surveillance consent present
- Utilities: City water; City sewer; Electricity connected; Individual gas meter
- Home design: Single-family residence; Two levels; Built in 2004; Located in Grand Park Estates subdivision
- Construction: Year built 2004
- Exterior features: Lot smaller than 0.5 acre (approximately 0.231 acres); Concrete and curb improvements
Interior
- Kitchen: Dishwasher; Disposal; Electric oven; Gas cooktop; Microwave; Refrigerator; Plumbed for gas in kitchen
- Bedrooms: 5 bedrooms (primary bedroom on level 1)
- Bathrooms: 3 full bathrooms; 1 half bathroom; 4 total bathrooms
- Heating & cooling: Fireplace insert
- Interior features: Built-in features; Cable TV available; Chandelier and decorative lighting; Double vanities; Eat-in kitchen; Granite countertops; Kitchen island; Loft; Pantry; Walk-in closets; High-speed internet available
- Laundry & utility: Washer/dryer hookups (laundry/utility details not specified)
Neighborhood map
What this means for you Summary
Snapshot
- This is a 4-bed/3.5-bath single-family listed at $700k.
Deal economics
- At list price, monthly cash flow is $-2k ($-24k/yr) — negative.
- To cash-flow at today's rent, offer at most $343k (50.9% below list).
- To meet the 1% rule (rent ≥ 1% of price), the offer needs to be $366k (47.7% below list).
- Recommended offer: $343k (50.9% below list) — sets the bar for cash-flow.
Location & tenants
- Location reads 71/100 on livability (#317 in TX) — a middle-class / working-renter tenant base. Strengths: crime A+, employment A+, housing A+; Watch: amenities F, commute F, cost of living F.
- Lewisville ISD (suburban): math 49% / reading 54% proficiency, ranked #109 of 826 in TX (top 13%) — acceptable for families but not a draw, mixed tenant base, ~2y average lease.
- Zoned schools: Prairie Trail Elementary (math 57% / reading 64%, grade B-, #385 of 4,322 statewide, top 9%, 643 students, 25% FRL) — zoned schools at 25% FRL track the district average.
- Market conditions: Rents soft (-0.2%/yr); 270 active listings in the ZIP; 16 comparable units currently listed for rent nearby; rentals at typical pace (median 22d on market — plan ~3-4 weeks tenant-placement turnaround); high-income renter base; 10,531 units permitted in Denton County in 2024 (2,713 in 5+ unit buildings).
Forward outlook
- Local home prices are declining (-3.0%/yr); year-one equity from $5k of loan paydown is wiped out by about $21k of value loss. Plan a longer hold.
- Denton County population projected at +66% by 2050 — long-run rental-demand tailwind backs the buy-and-hold thesis.
Negotiation context
- It's been on market 27 days — a 2% lower offer ($689k) is reasonable based on typical stale-listing flexibility.
Risks & watch-outs
- Climate carrying-cost: extreme-heat days projected 7→22/yr by 2055 (HVAC capex compounding) — expect insurance premiums to compound above CPI over the hold.
Questions for the listing agent
- What do current leases actually rent for vs. the listed asking? Can we see a recent rent roll and the last 12 months of T-12 income?
- What does the HOA fee cover, when was the last increase, and are there any pending special assessments or reserve-fund shortfalls?
- Is there a deadline driving the sale (1031 exchange, divorce, estate, relocation)? That informs how much negotiation room exists.
- Schools are A-rated — typically a magnet for longer-tenancy family renters. What's the average tenant stay here, and is there a school-zone premium baked into asking?
- The area grade is low — what's the realistic commute time and amenity access for the typical tenant pool here? Any planned neighborhood developments (good or bad) we should know about?
- What's the average days-on-market for RENTAL listings here right now (not sales)? A rising rental-DOM trend means longer vacancies and softer asking-rent achievability than the comps imply.
- What's the recent tenant-quality profile in this submarket — average credit score on applications, eviction rate, late-payment / NSF rate, and stable-employment percentage? A property-management company in the area should have these aggregated.
- How much new for-sale + rental construction is in the pipeline within 1–3 miles? Heavy new supply typically softens prices + rents 12–24 months out; constrained supply supports both.
Investment metrics
- 1% rule
- 0.52% ✗
- Cap rate
- 2.83%
- Cash-on-cash
- -12.36%
- DSCR
- 0.45
- GRM
- 15.9
CMA / ARV
- ARV (median comp)
- $663,866
- List price
- $699,900
- Delta
- 5.43%
- Verdict
- FAIR
- Comps
- 20 within 1.0 mi
Show comp detail 12 sales within ~0.75 mi
| Address | Dist | Beds/Ba | Sqft | Sold | Price | $/sf | Match |
|---|---|---|---|---|---|---|---|
| 1812 Marble Pass Dr | 0.13mi | 5/4.5 (+1) | 3,454 (+2%) | 3mo | $759,000 | $220 | 78 |
| 1620 Harvest Glen Dr | 0.36mi | 4/3.5 | 3,293 (-2%) | 8mo | $660,000 | $200 | 73 |
| 1804 Morning Mist Trl | 0.41mi | 4/3.0 | 3,065 (-9%) | 2mo | $575,900 | $188 | 62 |
| 2132 Hardy Ln | 0.50mi | 4/3.5 | 3,133 (-7%) | 4mo | $705,000 | $225 | 61 |
| 1412 Big Falls Dr | 0.63mi | 5/3.0 (+1) | 3,341 (-1%) | 1mo | $663,000 | $198 | 61 |
| 6205 Prairie Hill Ln | 0.58mi | 4/3.0 | 3,600 (+7%) | 0mo | $924,000 | $257 | 59 |
| 6002 Valleywood Dr | 0.68mi | 4/3.5 | 3,229 (-4%) | 3mo | $700,000 | $217 | 59 |
| 1301 Glen Hollow Ln | 0.72mi | 4/3.0 | 3,173 (-6%) | 2mo | $655,000 | $206 | 53 |
| 1412 Wildflower Ln | 0.50mi | 4/2.5 | 3,012 (-11%) | 2mo | $629,000 | $209 | 53 |
| 6004 Windridge Ln | 0.73mi | 5/4.0 (+1) | 3,524 (+5%) | 1mo | $785,000 | $223 | 50 |
| 6109 Gateridge Dr | 0.65mi | 4/4.0 | 2,996 (-11%) | 2mo | $730,000 | $244 | 47 |
| 6000 Windridge Ln | 0.75mi | 4/3.5 | 3,724 (+10%) | 2mo | $765,000 | $205 | 46 |
Match score weights: distance 35% · size 25% · config 20% · recency 20%. Top-matched comps best support the ARV.
Projected returns pro-forma
-3.0% appreciation · 0.0% rent growth · sell at horizon
- IRR
- -42.5%
- Equity multiple
- -0.29×
- Total profit
- $-252,599
- Equity at exit
- $104,357
- IRR
- -94.4%
- Equity multiple
- -1.18×
- Total profit
- $-426,543
- Equity at exit
- $60,515
Cash invested: $195,972 (down + closing). Projections, not guarantees.
Landlord ↔ Tenant lean methodology
- Overall (STATE)
- 87 Strongly Landlord-Friendly
- State Texas
- 87 Strongly Landlord-Friendly · R+5
- County
- — inherits STATE
- City
- — inherits STATE
ZIP-level market 75028
- Home prices YoY
- -27.9%
- Rents YoY
- -0.2%
- Active inventory
- 270
- Price-to-rent
- 15.9×
Monthly cashflow live
- Estimated rent
- $3,660 high interval (Pro) →
- Mortgage (P&I)
- −$3,670
- Tax from tax record
- −$906 /mo · $10,870/yr
- Insurance
- −$292
- HOA
- −$42
- Vacancy / Maint / Mgmt
- −$769
- Net cashflow
- $-2,018
Break-even live
UW: 25.0% down · 7.5% · 30yr · 1.5% tax · 5.0% vac · 8.0% maint · 8.0% mgmt
Financing live
Cash to close
- Down payment
- $174,975
- Closing costs
- $20,997
- Reserves months
- —
- Total cash needed
- —
Loan-product check · same deal, 3 products live
Conventional
25% down · 7.5% · 30yr
- Down + closing
- —
- Monthly P&I
- —
- Monthly cashflow
- —
- DSCR
- —
- Eligible?
- —
Personal DTI + credit; lowest rate.
DSCR
20% down · 8.5% · 30yr
- Down + closing
- —
- Monthly P&I
- —
- Monthly cashflow
- —
- DSCR
- —
- Eligible?
- —
No personal income docs; deal must DSCR.
Hard money
10% down · 12.0% · 12mo
- Down + closing
- —
- Monthly P&I
- —
- Monthly cashflow
- —
- DSCR
- —
- Eligible?
- —
Short-term bridge; refi at stabilization.
Rent comps 16 comps
| Address | Beds | Baths | Sqft | Rent | $/sqft | DOM | Units | Dist |
|---|---|---|---|---|---|---|---|---|
| 1905 Devereux Ct Flower Mound, TX | 4.0 | 3.5 | 3640 | $4,225 | $1.16 | 2d | 1 | 0.05mi |
| 6008 Rock Ridge Dr Flower Mound, TX | 4.0 | 2.5 | 2502 | $3,290 | $1.31 | 7d | 1 | 0.17mi |
| 6205 Prairie Hill Ln Flower Mound, TX | 4.0 | 3.0 | 3600 | $4,250 | $1.18 | 3d | 1 | 0.60mi |
| 2509 Cross Haven Dr Flower Mound, TX | 4.0 | 2.0 | 2608 | $3,200 | $1.23 | 24d | 1 | 0.64mi |
| 2200 Glenbrook St Flower Mound, TX | 5.0 | 2.5 | 2806 | $9,750 | $3.47 | 44d | 1 | 0.78mi |
| 2200 Glenbrook St Unit 1019560P Flower Mound, TX | 5.0 | 2.5 | 2798 | $10,877 | $3.89 | 44d | 1 | 0.78mi |
| 568 Sellmeyer Ln Unit 1019575P Lewisville, TX | 4.0 | 2.5 | 2723 | $15,967 | $5.86 | 22d | 1 | 0.93mi |
| 568 Sellmeyer Ln Lewisville, TX | 4.0 | 2.5 | 2728 | $9,750 | $3.57 | 22d | 1 | 0.93mi |
| 1508 Gunnison Trl Lewisville, TX | 4.0 | 2.5 | 3085 | $3,050 | $0.99 | 24d | 1 | 1.23mi |
| 1101 Homestead St Unit 1514794P Flower Mound, TX | 4.0 | 2.5 | 2346 | $9,000 | $3.84 | 22d | 1 | 1.24mi |
| 401 Leigh Ct Lewisville, TX | 4.0 | 3.0 | 2981 | $3,995 | $1.34 | 44d | 1 | 1.31mi |
| 1460 Bristol Ln Lewisville, TX | 5.0 | 3.5 | 2698 | $7,500 | $2.78 | 10d | 1 | 1.37mi |
| 2657 Hillside Dr Lewisville, TX | 4.0 | 2.5 | 2764 | $3,190 | $1.15 | 1d | 1 | 1.43mi |
| 1233 Logan Dr Lewisville, TX | 4.0 | 2.0 | 2279 | $2,741 | $1.20 | 44d | 1 | 1.46mi |
| 1233 Logan Dr Lewisville, TX | 4.0 | 2.0 | 2279 | $2,475 | $1.09 | 7d | 1 | 1.46mi |
| 114 Sandy Hook Lewisville, TX | 5.0 | 3.5 | 2567 | $9,750 | $3.80 | 22d | 1 | 1.50mi |
HOA detail
- Monthly dues
- $42 · $504/yr
Listing history 11 events
-
2026-06-13statusdays on market $699,900 Pending 27 DOM
-
2026-06-09days on market $699,900 Active 26 DOM
-
2026-06-08days on market $699,900 Active 25 DOM
-
2026-06-07days on market $699,900 Active 24 DOM
-
2026-06-04days on market $699,900 Active 21 DOM
-
2026-06-03days on market $699,900 Active 20 DOM
-
2026-06-02days on market $699,900 Active 19 DOM
-
2026-06-01days on market $699,900 Active 18 DOM
-
2026-05-31days on market $699,900 Active 17 DOM
-
2026-05-12$699,900 Active 2077-char remark
-
2004-08-24soldstatus
ⓘ Source: listings_history table (triggers on properties + properties_extension) + one-shot
backfill from property_details.listing_events for pre-trigger history.
Tax reassessment forecast TX · Resets to sale price
- Current annual tax
- $10,870 · $906/mo
- Projected year-2 tax
- $12,808 · $1,067/mo
- Expected delta
- +$1,938/yr (+$161/mo · 17.8%)
ⓘ Screening estimate from a state-policy table — verify with the county assessor before closing.
Climate risk First Street
- Flood 1/10 Low FEMA zone X (unshaded) · 0% chance over 30 yrs
- Wildfire 1/10 Low
- Heat 7/10 Severe 7 d/yr ≥110°F today · 22 d/yr by 30 yrs out
- Wind 4/10 Moderate 22% chance of damaging wind over 30 yrs
- Air quality 4/10 Moderate 4 unhealthy d/yr today · 5 by 30 yrs out
Nearby sold comps map
Loading sold comps map…
Walkable amenities ~0.75 mi
Loading nearby amenities…
Taxation est. · year 1
- Rental income
- $43,919
- − Mortgage interest
- −$39,205
- − Property taxes
- −$10,870
- − Insurance
- −$3,500
- − Repairs & maintenance
- −$3,514
- − Management
- −$3,514
- − HOA
- −$504
- − Depreciation
- −$20,361
- Taxable loss
- −$37,548
- Est. tax savings @ 24.0%
- +$9,011
- After-tax cash flow
- $-15,210/yr
For passive investors: Depreciation is non-cash, so a rental often shows a tax loss while cash-flowing — sheltering income. Rental losses are passive: they offset passive income freely, and up to $25,000/yr can offset ordinary (W-2) income if you actively participate and your MAGI is under $100k (phasing out to $0 by $150k); unused losses carry forward. On sale, claimed depreciation is recaptured at up to 25%, and gains may owe capital-gains tax (a 1031 exchange can defer both). Figures are a year-1 estimate at your 24.0% rate — not tax advice; consult a CPA.
Schools (NCES district)
- District
- Lewisville ISD
- NCES district ID
- 4827300
- Math proficiency
- 49% ▼ -10.00%
- Reading proficiency
- 54% ▼ -4.00%
- Median HH income
- $82,351
- Composite
- 47.1/100
- National rank
- #2333
- State rank
- #109 of 826 in TX
Livability — Flower Mound
- Score
- 71/100
- State rank
- #317
- US rank
- #7074
Category grades
Schools grade is shown separately in the Schools card above.
Census & demographics
- Census place
- Flower Mound, TX
- County
- Denton County · 901,654 people
- City population
- 75,184
- Metro
- Dallas-Fort Worth-Arlington, TX
- Population (ZIP)
- 49,094
- Household income
- $149,436
- Rent vs Own
- Severe rent burden
- 779.0
Population outlook (Denton County) Hauer SSP2
- Today (2025)
- 1,053,010 people
- By 2030
- 1,192,269 · +13.2%
- By 2040
- 1,472,920 · +39.9%
- By 2050
- 1,746,506 · +65.9%
- By 2075
- 2,358,497 · +124.0%
- By 2100
- 2,779,183 · +163.9%
Race, ethnicity, and origin ACS 2023
- Neighborhood character
- Predominantly White (68%)
- Race & ethnicity
- White 68% Hispanic / Latino 12% Asian 12% Two or more races 10% Black 4%
- Hispanic origin (detail)
- Mexican 7%
- Common ancestry
- Romanian 3% Slovak 3% Serbian 3%
- Foreign-born
- 14% · Canada, South Korea, China
- Languages at home
- 81% English-only · Spanish 7% Other Asian/Pacific 4% Other Indo-European 3%
Political lean MEDSL · Denton
- 2024 margin
- R (+13.2) · D 42.7% · R 55.8% · Other 1.5%
- 2008→2024 swing
- +11.0pp toward D · 2008: -24.2pp · 2024: -13.2pp
- All cycles
- 2024: R+13.2 2020: R+8.1 2016: R+20.2 2012: R+31.7 2008: R+24.2
Not yet ingested
- Civics
- —
Market trends
- HPI YoY
- ▼ -107.51%
- Current HPI
- 277.7883
- Rent YoY
- ▼ -0.25%
- Metro
- Dallas-Fort Worth-Arlington, TX
- State GDP YoY
- ▲ 3.95%
- F500 in state
- 110
Industry mix (Fortune 500 HQ in TX)
| Industry | F500 HQs | Revenue |
|---|---|---|
| Energy | 16 | $1,198B |
|
||
| Technology | 5 | $198B |
|
||
| Engineering / Construction | 4 | $72B |
|
||
| Energy Services | 3 | $60B |
|
||
| Utilities | 3 | $41B |
|
||
| Healthcare | 2 | $330B |
|
||
Price history
3 events — show timeline
- 2026-06-11 Pending — NTREIS
- 2026-05-12 Listed $699,900 NTREIS
- 2004-08-24 Sold (Public Records) — Public Records
Property tax history
+3.4%/yrLatest (2025): $10,870 · +9.9% YoY. Source: county tax records.
Cash-flow waterfall
monthlySold comps — $/sqft
last 12 mo · ≤1 miLoading sold comps…