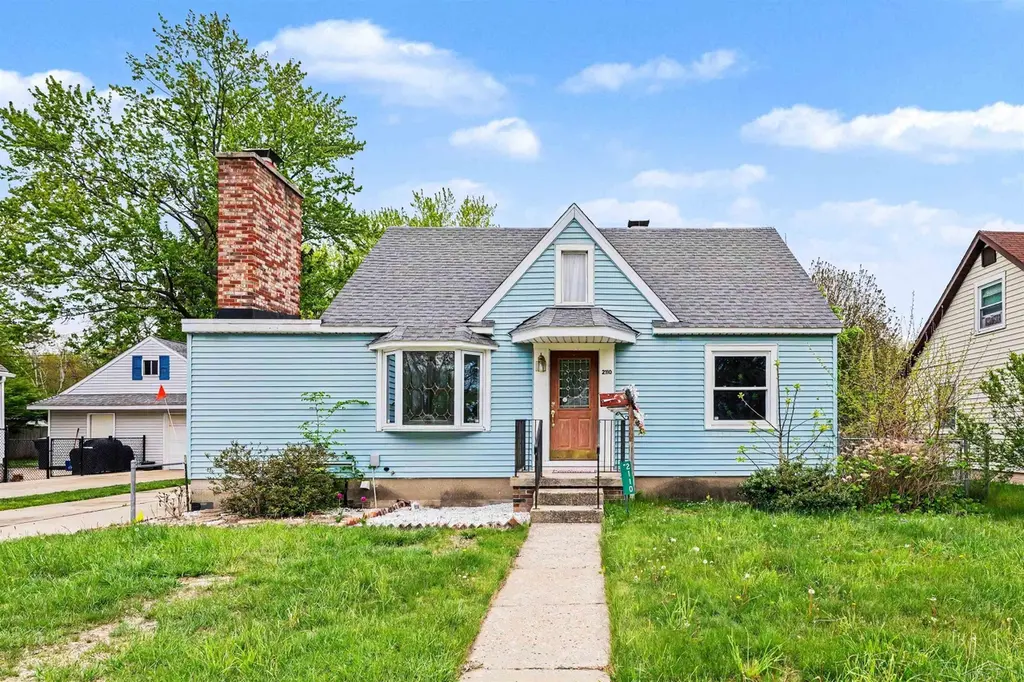
2110 Tennessee St · Midland, MI
Flood risk 1/10 · Minimal
- FEMA flood zone
- X (unshaded)
- Chance of flooding over 30 yrs
- 0.0%
- Est. flood insurance / yr
- $473 – $860
Fire risk 1/10 · Minimal
- Est. fire insurance / yr
- $784 – $1,456
Heat risk 2/10 · Minimal
- Hot days now (above 98°F)
- 7 days/yr
- Hot days in 30 yrs
- 14 days/yr
Wind risk 1/10 · Minimal
- Chance of severe wind over 30 yrs
- —
Air-quality risk 2/10 · Minimal
- Unhealthy air days now
- 1 days/yr
- Unhealthy air days in 30 yrs
- 1 days/yr
Risk factors via First Street. Map © Google.
Why this score? — see what drove the C- grade
The composite is a weighted blend of 9 inputs, each scored 0–100. Each bar is that input's sub-score; the figure is the points it added to the 100-point composite (weight × sub-score).
- ARV discount +14.6/15.0
- Cash flow +13.6/30.0
- Schools +4.9/10.0
- Livability +4.2/5.0
- DSCR +4.1/10.0
- 1% rule +3.7/10.0
- Rent growth +2.7/5.0
- Condition / age +2.5/5.0
- Appreciation +0.0/10.0
$179,900
🖨 Deal sheet 📄 Offer letter ✓ Due diligence
Listing remarks MLS
Spacious 1.5-story bungalow offering character, warmth, and flexible living space on a quiet neighborhood street that was repaved in recent years. The main floor features a large rear room currently used by the sellers as a primary bedroom with a separate entry, bay window, wood-hewn beams, barn siding wainscoting, and a brick hearth ready for a stove or wood-burning device with chimney access already in place. With its size and character, this versatile space could also serve as a cozy family room, gathering area, recreation room, or additional flex space depending on your needs. Just outside is a sitting room/flex space with reconditioned wood flooring that is ideal for an office, reading area, hobby space, nursery, or dressing room. Reconditioned wood floors run through the living room, kitchen, sitting room, and additional main floor bedroom, while the rear room features carpet for added comfort. Upstairs offers a unique knotty pine retreat complete with built-in bed frames, dresser storage, cabinets, shelving, and newer carpet — creating a cabin-like atmosphere full of character and nostalgia. The sliding door leads to a covered porch with composite decking overlooking the fenced backyard, offering a comfortable space to relax, entertain, or enjoy quiet evenings outdoors. Outside you’ll also find a detached 2.5-car garage and a large storage shed for additional storage and workspace. Appliances included are the refrigerator, stove/range, portable dishwasher, washer, and dryer. The basement provides abundant storage space along with an exterior access door. Additional updates include a roof approximately 4 years old, carpet approximately 3 years old, and new kitchen cabinet hardware.
Key facts
- 7,405 sq ft lot
- 2 garage spots
- Built 1947
Neighborhood map
What this means for you Summary
Snapshot
- This is a 2-bed/1.0-bath single-family listed at $180k.
Deal economics
- At list price, monthly cash flow is $10 ($119/yr) — positive.
- The deal already cash-flows at list — no discount required.
- To meet the 1% rule (rent ≥ 1% of price), the offer needs to be $156k (13.0% below list).
- Recommended offer: $156k (13.0% below list) — sets the bar for 1% rule.
- Cap rate 6.4% vs local median 4.4% in Midland — top-decile yield for the area; either an underpriced asset or a hidden risk that comps aren't pricing in. Stress-test before assuming the spread holds.
Location & tenants
- Location reads 85/100 on livability (#28 in MI, #578 nationally) — a professional / high-income tenant draw. Strengths: crime A+, cost of living A+, housing A+; Watch: commute F.
- Midland Public Schools (urban): math 49% / reading 64% proficiency, ranked #62 of 540 in MI (top 12%) — acceptable for families but not a draw, mixed tenant base, ~2y average lease.
- Market conditions: Rents flat; 95 active listings in the ZIP; solid renter incomes; 320 units permitted in Midland County in 2024 (204 in 5+ unit buildings).
Forward outlook
- Local home prices are declining (-3.0%/yr); year-one equity from $1k of loan paydown is wiped out by about $5k of value loss. Plan a longer hold.
- Midland County population projected to shrink 9% by 2050 — rents likely to lag national; underwrite the cash flow, not the appreciation.
Negotiation context
- Only 0 days on market — expect competitive offers; lowballing is unlikely to land.
- 3 sale attempts since 8y ago with the ask held roughly flat each time — persistent listings suggest the price (not the market) is what's stuck; bring a comps-based counter.
- Current owner paid $80k; list at $180k implies a 125% gain — meaningful room to come down on a strong offer.
Risks & watch-outs
- Watch-outs: built in 1947 — expect roof / HVAC / electrical / plumbing capex.
Questions for the listing agent
- Built in 1947 — when were the roof, HVAC, electrical panel, plumbing, and water heater last replaced?
- Is there a deadline driving the sale (1031 exchange, divorce, estate, relocation)? That informs how much negotiation room exists.
- Schools are A-rated — typically a magnet for longer-tenancy family renters. What's the average tenant stay here, and is there a school-zone premium baked into asking?
- What's the average days-on-market for RENTAL listings here right now (not sales)? A rising rental-DOM trend means longer vacancies and softer asking-rent achievability than the comps imply.
- What's the recent tenant-quality profile in this submarket — average credit score on applications, eviction rate, late-payment / NSF rate, and stable-employment percentage? A property-management company in the area should have these aggregated.
- How much new for-sale + rental construction is in the pipeline within 1–3 miles? Heavy new supply typically softens prices + rents 12–24 months out; constrained supply supports both.
Investment metrics
- 1% rule
- 0.87% ✗
- Cap rate
- 6.36%
- Cash-on-cash
- 0.24%
- DSCR
- 1.01
- GRM
- 9.6
CMA / ARV
- ARV (on-the-fly)
- $213,500
- Comps found
- 6
Show comp detail 6 sales within ~0.75 mi
| Address | Dist | Beds/Ba | Sqft | Sold | Price | $/sf | Match |
|---|---|---|---|---|---|---|---|
| 717 E Haley St | 0.55mi | 2/1.0 | 1,498 (-2%) | 3mo | $150,000 | $100 | 69 |
| 1824 E Ashman St | 0.65mi | 3/2.0 (+1) | 1,704 (+12%) | 7mo | $241,500 | $142 | 35 |
| 1318 E Ashman St | 0.65mi | 3/1.0 (+1) | 1,368 (-10%) | 15mo | $163,930 | $120 | 35 |
| 1020 Wyllys St | 0.67mi | 2/2.0 | 1,328 (-13%) | 11mo | $195,000 | $147 | 34 |
| 2301 Carol Ct | 0.74mi | 3/2.0 (+1) | 1,673 (+10%) | 14mo | $234,073 | $140 | 29 |
| 1904 Wyllys St | 0.61mi | 3/2.5 (+1) | 1,691 (+11%) | 23mo | $205,000 | $121 | 23 |
Match score weights: distance 35% · size 25% · config 20% · recency 20%. Top-matched comps best support the ARV.
Projected returns pro-forma
-3.0% appreciation · 0.6% rent growth · sell at horizon
- IRR
- -18.6%
- Equity multiple
- 0.36×
- Total profit
- $-32,195
- Equity at exit
- $26,824
- IRR
- -16.6%
- Equity multiple
- 0.17×
- Total profit
- $-41,597
- Equity at exit
- $15,554
Cash invested: $50,372 (down + closing). Projections, not guarantees.
Landlord ↔ Tenant lean methodology
- Overall (STATE)
- 62 Landlord-Friendly
- State Michigan
- 62 Landlord-Friendly · EVEN
- County
- — inherits STATE
- City
- — inherits STATE
ZIP-level market 48642
- Home prices YoY
- -31.4%
- Rents YoY
- 0.6%
- Active inventory
- 95
- Price-to-rent
- 9.6×
Monthly cashflow live
- Estimated rent
- $1,565 medium interval (Pro) →
- Mortgage (P&I)
- −$943
- Tax from tax record
- −$208 /mo · $2,493/yr
- Insurance
- −$75
- HOA
- −$0
- Vacancy / Maint / Mgmt
- −$329
- Net cashflow
- $10
Break-even live
UW: 25.0% down · 7.5% · 30yr · 1.5% tax · 5.0% vac · 8.0% maint · 8.0% mgmt
Financing live
Cash to close
- Down payment
- $44,975
- Closing costs
- $5,397
- Reserves months
- —
- Total cash needed
- —
Loan-product check · same deal, 3 products live
Conventional
25% down · 7.5% · 30yr
- Down + closing
- —
- Monthly P&I
- —
- Monthly cashflow
- —
- DSCR
- —
- Eligible?
- —
Personal DTI + credit; lowest rate.
DSCR
20% down · 8.5% · 30yr
- Down + closing
- —
- Monthly P&I
- —
- Monthly cashflow
- —
- DSCR
- —
- Eligible?
- —
No personal income docs; deal must DSCR.
Hard money
10% down · 12.0% · 12mo
- Down + closing
- —
- Monthly P&I
- —
- Monthly cashflow
- —
- DSCR
- —
- Eligible?
- —
Short-term bridge; refi at stabilization.
Listing history 2 events
-
2026-06-13remarks 699-char remark
-
2026-06-13$179,900 Pending
ⓘ Source: listings_history table (triggers on properties + properties_extension) + one-shot
backfill from property_details.listing_events for pre-trigger history.
Tax reassessment forecast MI · Partial reset (capped growth)
- Current annual tax
- $2,493 · $208/mo
- Projected year-2 tax
- $2,632 · $219/mo
- Expected delta
- +$139/yr (+$12/mo · 5.6%)
ⓘ Screening estimate from a state-policy table — verify with the county assessor before closing.
Climate risk First Street
- Flood 1/10 Low FEMA zone X (unshaded) · 0% chance over 30 yrs
- Wildfire 1/10 Low
- Heat 2/10 Low 7 d/yr ≥98°F today · 14 d/yr by 30 yrs out
- Wind 1/10 Low
- Air quality 2/10 Low 1 unhealthy d/yr today · 1 by 30 yrs out
Nearby sold comps map
Loading sold comps map…
Walkable amenities ~0.75 mi
Loading nearby amenities…
Taxation est. · year 1
- Rental income
- $18,776
- − Mortgage interest
- −$10,077
- − Property taxes
- −$2,493
- − Insurance
- −$900
- − Repairs & maintenance
- −$1,502
- − Management
- −$1,502
- − Depreciation
- −$5,233
- Taxable loss
- −$2,932
- Est. tax savings @ 24.0%
- +$704
- After-tax cash flow
- $823/yr
For passive investors: Depreciation is non-cash, so a rental often shows a tax loss while cash-flowing — sheltering income. Rental losses are passive: they offset passive income freely, and up to $25,000/yr can offset ordinary (W-2) income if you actively participate and your MAGI is under $100k (phasing out to $0 by $150k); unused losses carry forward. On sale, claimed depreciation is recaptured at up to 25%, and gains may owe capital-gains tax (a 1031 exchange can defer both). Figures are a year-1 estimate at your 24.0% rate — not tax advice; consult a CPA.
Schools (NCES district)
- District
- Midland Public Schools
- NCES district ID
- 2623820
- Math proficiency
- 49% ▼ -6.00%
- Reading proficiency
- 64% ▼ -3.00%
- Median HH income
- $55,844
- Composite
- 48.67/100
- National rank
- #2105
- State rank
- #62 of 540 in MI
Livability — Midland
- Score
- 85/100
- State rank
- #28
- US rank
- #578
Category grades
Schools grade is shown separately in the Schools card above.
Census & demographics
- Census place
- Midland, MI
- County
- Midland County · 66,531 people
- City population
- 66,531
- Metro
- Midland, MI
- Population (ZIP)
- 34,039
- Household income
- $77,847
- Rent vs Own
- Severe rent burden
- 935.0
Population outlook (Midland County) Hauer SSP2
- Today (2025)
- 83,968 people
- By 2030
- 83,368 · -0.7%
- By 2040
- 80,713 · -3.9%
- By 2050
- 76,698 · -8.7%
- By 2075
- 67,617 · -19.5%
- By 2100
- 57,529 · -31.5%
Race, ethnicity, and origin ACS 2023
- Neighborhood character
- Predominantly White (88%)
- Race & ethnicity
- White 88% Hispanic / Latino 4% Asian 4% Two or more races 3% Black 2%
- Common ancestry
- Romanian 8% Lithuanian 5% Italian 3%
- Foreign-born
- 5% · Canada, China, Vietnam
- Languages at home
- 95% English-only · Other Indo-European 1% Spanish 1% Chinese 1%
Political lean MEDSL · Midland
- 2024 margin
- R (+15.2) · D 41.6% · R 56.8% · Other 1.6%
- 2008→2024 swing
- -11.6pp toward R · 2008: -3.6pp · 2024: -15.2pp
- All cycles
- 2024: R+15.2 2020: R+14.6 2016: R+19.4 2012: R+15.5 2008: R+3.6
Not yet ingested
- Civics
- —
Market trends
- HPI YoY
- ▼ -87.89%
- Current HPI
- 192.0812
- Rent YoY
- ▲ 0.60%
- Metro
- Midland, MI
- State GDP YoY
- ▲ 1.37%
- F500 in state
- 28
Industry mix (Fortune 500 HQ in MI)
| Industry | F500 HQs | Revenue |
|---|---|---|
| Automotive Parts | 3 | $48B |
|
||
| Automotive | 2 | $372B |
|
||
| Chemicals | 1 | $45B |
|
||
| Automotive Retail | 1 | $29B |
|
||
| Healthcare / Medical Devices | 1 | $23B |
|
||
| Automotive Technology | 1 | $20B |
|
||
Price history
+82.6% since first listed7 events — show timeline
- 2026-05-24 Listing Removed — REALCOMP
- 2026-05-24 Listing Removed — MiRealSource-MiMLS
- 2026-05-18 Listed $179,900 REALCOMP
- 2026-05-18 Listed $179,900 MiRealSource-MiMLS
- 2021-10-11 Sold (Public Records) $80,000 Public Records
- 2019-02-11 Listing Removed — MiRealSource-MiMLS
- 2018-08-10 Listed $98,500 MiRealSource-MiMLS
Property tax history
+4.6%/yrLatest (2024): $2,493 · +4.9% YoY. Source: county tax records.
Cash-flow waterfall
monthlySold comps — $/sqft
last 12 mo · ≤1 miLoading sold comps…