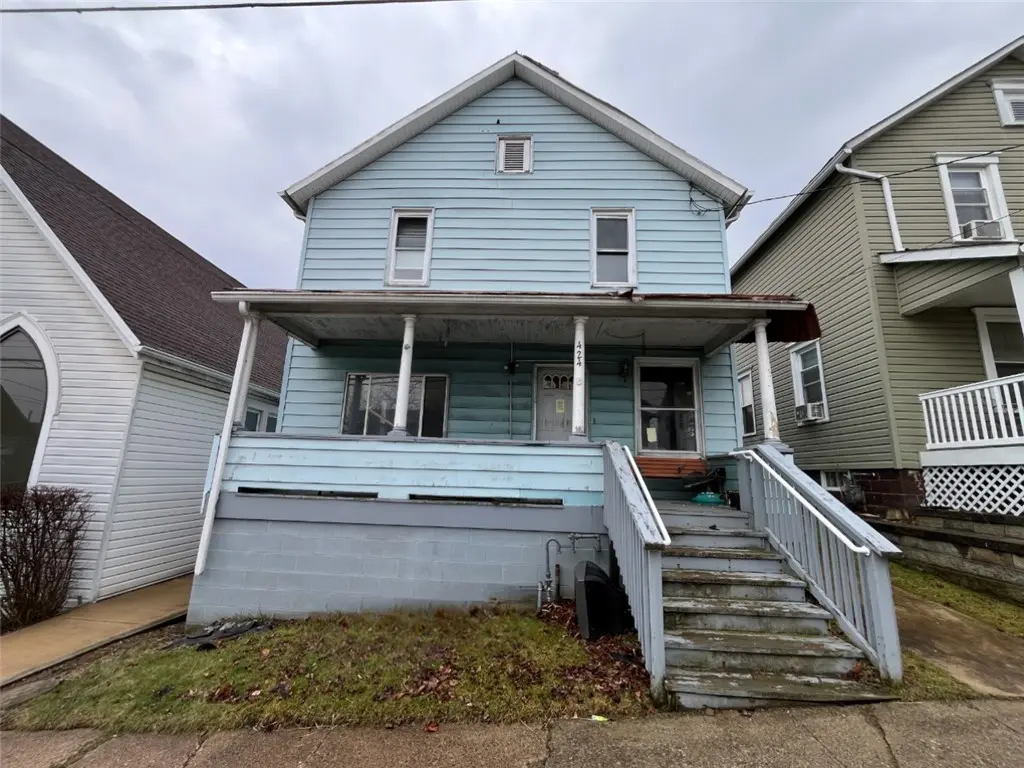
424 Church St · Indiana, PA
Flood risk 1/10 · Minimal
- FEMA flood zone
- X (unshaded)
- Chance of flooding over 30 yrs
- 0.0%
- Est. flood insurance / yr
- $473 – $860
Fire risk 1/10 · Minimal
- Est. fire insurance / yr
- $511 – $949
Heat risk 4/10 · Minor
- Hot days now (above 95°F)
- 7 days/yr
- Hot days in 30 yrs
- 18 days/yr
Wind risk 2/10 · Minimal
- Chance of severe wind over 30 yrs
- —
Air-quality risk 3/10 · Minor
- Unhealthy air days now
- 2 days/yr
- Unhealthy air days in 30 yrs
- 3 days/yr
Risk factors via First Street. Map © Google.
Why this score? — see what drove the B grade
The composite is a weighted blend of 9 inputs, each scored 0–100. Each bar is that input's sub-score; the figure is the points it added to the 100-point composite (weight × sub-score).
- Cash flow +30.0/30.0
- 1% rule +10.0/10.0
- DSCR +10.0/10.0
- ARV discount +7.5/15.0
- Schools +4.8/10.0
- Livability +3.8/5.0
- Rent growth +2.5/5.0
- Condition / age +2.5/5.0
- Appreciation +0.0/10.0
$49,900
🖨 Deal sheet 📄 Offer letter ✓ Due diligence
Listing remarks MLS
Welcome to this 2-story, 4-Bedroom, 2 FULL Bath home situated on a quiet residential street in Indiana, Pennsylvania. Just two blocks from the vibrant downtown area, this property offers the perfect blend with convenient access to shopping, dining, and everyday amenities. Whether you're relaxing indoors or enjoying the charm of the neighborhood, this home delivers both location and livability. A great opportunity to own a property close to everything Indiana has to offer!
Key facts
- 5,662 sq ft lot
- Built 1895
- Listed 79 days
Tags
Neighborhood map
What this means for you Summary
Snapshot
- This is a 4-bed/2.0-bath single-family listed at $50k.
Deal economics
- At list price, monthly cash flow is $505 ($6k/yr) — positive.
- The deal already cash-flows at list — no discount required.
- Meets the 1% rule at list price ($1k rent vs $50k).
- Recommended offer: $47k (6.0% below list) — sets the bar for market timing.
- Cap rate 18.4% vs local median 2.2% in Indiana — top-decile yield for the area; either an underpriced asset or a hidden risk that comps aren't pricing in. Stress-test before assuming the spread holds.
Location & tenants
- Location reads 75/100 on livability (#429 in PA, #3,920 nationally) — a middle-class / working-renter tenant base. Strengths: schools A+, crime A+, cost of living A+; Watch: amenities F, commute F, employment F.
- Indiana Area SD (town): math 49% / reading 67% proficiency, ranked #96 of 539 in PA (top 18%) — acceptable for families but not a draw, mixed tenant base, ~2y average lease.
- Market conditions: 94 active listings in the ZIP; 3 comparable units currently listed for rent nearby; rentals lingering (median 44d on market — plan ~5-8 weeks vacancy on turnover, expect pricing pressure); 100% of comp listings sitting > 30 days — soft ceiling on asking rent; 44 units permitted in Indiana County in 2024 (0 in 5+ unit buildings).
Forward outlook
- Local home prices are declining (-3.0%/yr); year-one equity from $345 of loan paydown is wiped out by about $1k of value loss. Plan a longer hold.
- Indiana County population projected at -18% by 2050 — secular population decline; favor cash flow + early exit over multi-decade hold.
- At projected returns (-3.0% appreciation + 3.0% rent growth), your $14k cash investment doubles in ~3 years — after that, you're playing with house money.
Negotiation context
- It's been on market 80 days — a 6% lower offer ($47k) is reasonable based on typical stale-listing flexibility.
Risks & watch-outs
- Watch-outs: built in 1895 — expect roof / HVAC / electrical / plumbing capex.
Questions for the listing agent
- It's been on market 80 days. Have you received any prior offers? Is the seller open to a 6% concession, seller financing, or rate buy-down credit?
- Built in 1895 — when were the roof, HVAC, electrical panel, plumbing, and water heater last replaced?
- Why hasn't it sold? Are there any deal-killer items the seller is aware of (foundation, flood, title, zoning, code violations)?
- Is there a deadline driving the sale (1031 exchange, divorce, estate, relocation)? That informs how much negotiation room exists.
- Schools are A-rated — typically a magnet for longer-tenancy family renters. What's the average tenant stay here, and is there a school-zone premium baked into asking?
- What's the average days-on-market for RENTAL listings here right now (not sales)? A rising rental-DOM trend means longer vacancies and softer asking-rent achievability than the comps imply.
- What's the recent tenant-quality profile in this submarket — average credit score on applications, eviction rate, late-payment / NSF rate, and stable-employment percentage? A property-management company in the area should have these aggregated.
- How much new for-sale + rental construction is in the pipeline within 1–3 miles? Heavy new supply typically softens prices + rents 12–24 months out; constrained supply supports both.
Investment metrics
- 1% rule
- 2.16% ✓
- Cap rate
- 18.44%
- Cash-on-cash
- 43.40%
- DSCR
- 2.93
- GRM
- 3.9
CMA / ARV
- ARV (median comp)
- $145,209
- List price
- $49,900
- Delta
- -65.64%
- Verdict
- UNDERPRICED
- Comps
- 20 within 1.0 mi
Show comp detail 12 sales within ~0.75 mi
| Address | Dist | Beds/Ba | Sqft | Sold | Price | $/sf | Match |
|---|---|---|---|---|---|---|---|
| 366 Walnut St | 0.30mi | 3/1.0 (-1) | 1,589 (+2%) | 5mo | $35,000 | $22 | 70 |
| 598 S 6th St | 0.56mi | 4/1.0 | 1,578 (+1%) | 0mo | $130,000 | $82 | 68 |
| 515 Locust St | 0.26mi | 3/1.5 (-1) | 1,628 (+4%) | 7mo | $197,000 | $121 | 68 |
| 628 South Ave | 0.41mi | 4/1.5 | 1,520 (-3%) | 7mo | $174,000 | $114 | 68 |
| 116 Philadelphia St | 0.39mi | 4/1.5 | 1,680 (+7%) | 6mo | $85,500 | $51 | 63 |
| 367 Washington St | 0.13mi | 3/1.5 (-1) | 1,344 (-14%) | 4mo | $169,000 | $126 | 60 |
| 250 Grant St | 0.46mi | 3/3.0 (-1) | 1,638 (+5%) | 8mo | $264,000 | $161 | 55 |
| 528 S 6th St | 0.48mi | 3/2.5 (-1) | 1,690 (+8%) | 8mo | $210,000 | $124 | 51 |
| 634 Maple St | 0.61mi | 4/2.0 | 1,704 (+9%) | 10mo | $236,000 | $138 | 49 |
| 395 Maple St | 0.50mi | 3/1.5 (-1) | 1,772 (+13%) | 0mo | $232,000 | $131 | 47 |
| 265 Charles St | 0.61mi | 4/3.0 | 1,431 (-9%) | 7mo | $202,000 | $141 | 47 |
| 22 Stevenson Ave | 0.56mi | 3/2.0 (-1) | 1,372 (-12%) | 9mo | $221,450 | $161 | 40 |
Match score weights: distance 35% · size 25% · config 20% · recency 20%. Top-matched comps best support the ARV.
Projected returns pro-forma
-3.0% appreciation · 3.0% rent growth · sell at horizon
- IRR
- 40.3%
- Equity multiple
- 2.73×
- Total profit
- $24,112
- Equity at exit
- $7,440
- IRR
- 46.6%
- Equity multiple
- 5.47×
- Total profit
- $62,501
- Equity at exit
- $4,314
Cash invested: $13,972 (down + closing). Projections, not guarantees.
Landlord ↔ Tenant lean methodology
- Overall (STATE)
- 62 Landlord-Friendly
- State Pennsylvania
- 62 Landlord-Friendly · EVEN
- County
- — inherits STATE
- City
- — inherits STATE
ZIP-level market 15701
- Home prices YoY
- -26.2%
- Active inventory
- 94
- Price-to-rent
- 3.9×
Monthly cashflow live
- Estimated rent
- $1,076 medium interval (Pro) →
- Mortgage (P&I)
- −$262
- Tax est. 1.5%
- −$62 /mo · $748/yr
- Insurance
- −$21
- HOA
- −$0
- Vacancy / Maint / Mgmt
- −$226
- Net cashflow
- $505
Break-even live
UW: 25.0% down · 7.5% · 30yr · 1.5% tax · 5.0% vac · 8.0% maint · 8.0% mgmt
Financing live
Cash to close
- Down payment
- $12,475
- Closing costs
- $1,497
- Reserves months
- —
- Total cash needed
- —
Loan-product check · same deal, 3 products live
Conventional
25% down · 7.5% · 30yr
- Down + closing
- —
- Monthly P&I
- —
- Monthly cashflow
- —
- DSCR
- —
- Eligible?
- —
Personal DTI + credit; lowest rate.
DSCR
20% down · 8.5% · 30yr
- Down + closing
- —
- Monthly P&I
- —
- Monthly cashflow
- —
- DSCR
- —
- Eligible?
- —
No personal income docs; deal must DSCR.
Hard money
10% down · 12.0% · 12mo
- Down + closing
- —
- Monthly P&I
- —
- Monthly cashflow
- —
- DSCR
- —
- Eligible?
- —
Short-term bridge; refi at stabilization.
Rent comps 3 comps
| Address | Beds | Baths | Sqft | Rent | $/sqft | DOM | Units | Dist |
|---|---|---|---|---|---|---|---|---|
| 561 Water St Unit First Floor Indiana, PA | 4.0 | 1.0 | 1200 | $1,200 | $1.00 | 43d | 1 | 0.32mi |
| 245 S 7th St Indiana, PA | 3.0 | 1.0 | 1080 | $839 | $0.78 | 43d | 1 | 0.39mi |
| 1227 W Maple St Indiana, PA | 2.0–5.0 | 1.0–2.5 | 990 | $500 | $0.51 | 43d | 1 | 1.04mi |
Listing history 16 events
-
2026-06-19days on market $49,900 Active 80 DOM
-
2026-06-18days on market $49,900 Active 79 DOM
-
2026-06-17days on market $49,900 Active 78 DOM
-
2026-06-16days on market $49,900 Active 77 DOM
-
2026-06-15days on market $49,900 Active 76 DOM
-
2026-06-14days on market $49,900 Active 74 DOM
-
2026-06-12days on market $49,900 Active 73 DOM
-
2026-06-09days on market $49,900 Active 70 DOM
-
2026-06-08days on market $49,900 Active 69 DOM
-
2026-06-07pricedays on market $49,900 Active 68 DOM
-
2026-06-02days on market $59,900 Active 63 DOM
-
2026-06-01days on market $59,900 Active 62 DOM
-
2026-05-31days on market $59,900 Active 61 DOM
-
2026-05-30days on market $59,900 Active 60 DOM
-
2026-05-04price $59,900 476-char remark
Show marketing remark (476 chars)
Welcome to this 2-story, 4-Bedroom, 2 FULL Bath home situated on a quiet residential street in Indiana, Pennsylvania. Just two blocks from the vibrant downtown area, this property offers the perfect blend with convenient access to shopping, dining, and everyday amenities. Whether you're relaxing indoors or enjoying the charm of the neighborhood, this home delivers both location and livability. A great opportunity to own a property close to everything Indiana has to offer!
-
2026-03-30$64,900 Active 476-char remark
Show marketing remark (476 chars)
Welcome to this 2-story, 4-Bedroom, 2 FULL Bath home situated on a quiet residential street in Indiana, Pennsylvania. Just two blocks from the vibrant downtown area, this property offers the perfect blend with convenient access to shopping, dining, and everyday amenities. Whether you're relaxing indoors or enjoying the charm of the neighborhood, this home delivers both location and livability. A great opportunity to own a property close to everything Indiana has to offer!
ⓘ Source: listings_history table (triggers on properties + properties_extension) + one-shot
backfill from property_details.listing_events for pre-trigger history.
Climate risk First Street
- Flood 1/10 Low FEMA zone X (unshaded) · 0% chance over 30 yrs
- Wildfire 1/10 Low
- Heat 4/10 Moderate 7 d/yr ≥95°F today · 18 d/yr by 30 yrs out
- Wind 2/10 Low
- Air quality 3/10 Moderate 2 unhealthy d/yr today · 3 by 30 yrs out
Nearby sold comps map
Loading sold comps map…
Walkable amenities ~0.75 mi
Loading nearby amenities…
Taxation est. · year 1
- Rental income
- $12,913
- − Mortgage interest
- −$2,795
- − Property taxes
- −$748
- − Insurance
- −$250
- − Repairs & maintenance
- −$1,033
- − Management
- −$1,033
- − Depreciation
- −$1,452
- Taxable income
- $5,602
- Est. tax owed @ 24.0%
- −$1,345
- After-tax cash flow
- $4,719/yr
For passive investors: Depreciation is non-cash, so a rental often shows a tax loss while cash-flowing — sheltering income. Rental losses are passive: they offset passive income freely, and up to $25,000/yr can offset ordinary (W-2) income if you actively participate and your MAGI is under $100k (phasing out to $0 by $150k); unused losses carry forward. On sale, claimed depreciation is recaptured at up to 25%, and gains may owe capital-gains tax (a 1031 exchange can defer both). Figures are a year-1 estimate at your 24.0% rate — not tax advice; consult a CPA.
Schools (NCES district)
- District
- Indiana Area SD
- NCES district ID
- 4212150
- Math proficiency
- 49% ▼ -9.00%
- Reading proficiency
- 67% ▼ -8.00%
- Median HH income
- $40,558
- Composite
- 48.44/100
- National rank
- #2133
- State rank
- #96 of 539 in PA
Livability — Indiana
- Score
- 75/100
- State rank
- #429
- US rank
- #3920
Category grades
Schools grade is shown separately in the Schools card above.
Census & demographics
- Census place
- Indiana, PA
- County
- Indiana County · 31,269 people
- City population
- 31,269
- Metro
- Indiana, PA
- Population (ZIP)
- 31,269
- Household income
- $56,311
- Rent vs Own
- Severe rent burden
- 1590.0
Population outlook (Indiana County) Hauer SSP2
- Today (2025)
- 84,294 people
- By 2030
- 81,773 · -3.0%
- By 2040
- 75,213 · -10.8%
- By 2050
- 69,348 · -17.7%
- By 2075
- 57,951 · -31.3%
- By 2100
- 47,313 · -43.9%
Race, ethnicity, and origin ACS 2023
- Neighborhood character
- Predominantly White (89%)
- Race & ethnicity
- White 89% Black 4% Two or more races 3% Hispanic / Latino 2% Asian 2%
- Common ancestry
- Romanian 7% Serbian 3% Italian 2%
- Foreign-born
- 4% · Canada
- Languages at home
- 94% English-only · Other Indo-European 2% Arabic 1% French/Haitian/Cajun 1%
Political lean MEDSL · Indiana
- 2024 margin
- Solid R (+39.1) · D 30.1% · R 69.2%
- 2008→2024 swing
- -32.0pp toward R · 2008: -7.1pp · 2024: -39.1pp
- All cycles
- 2024: R+39.1 2020: R+37.5 2016: R+35.6 2012: R+18.8 2008: R+7.1
Not yet ingested
- Civics
- —
Market trends
- HPI YoY
- ▼ -59.33%
- Current HPI
- 167.0982
- Rent YoY
- —
- Metro
- Indiana, PA
- State GDP YoY
- ▲ 1.68%
- F500 in state
- 34
Industry mix (Fortune 500 HQ in PA)
| Industry | F500 HQs | Revenue |
|---|---|---|
| Healthcare | 2 | $309B |
|
||
| Insurance | 2 | $27B |
|
||
| Telecommunications / Media | 1 | $124B |
|
||
| Industrial Distribution | 1 | $22B |
|
||
| Financial Services | 1 | $20B |
|
||
| Chemicals / Materials | 1 | $18B |
|
||
Price history
-7.7% since first listed2 events — show timeline
- 2026-05-04 Price Changed $59,900 West Penn MLS
- 2026-03-30 Listed $64,900 West Penn MLS
Property tax history
+5.3%/yrLatest (2026): $3,056 · +1.7% YoY. Source: county tax records.
Cash-flow waterfall
monthlySold comps — $/sqft
last 12 mo · ≤1 miLoading sold comps…