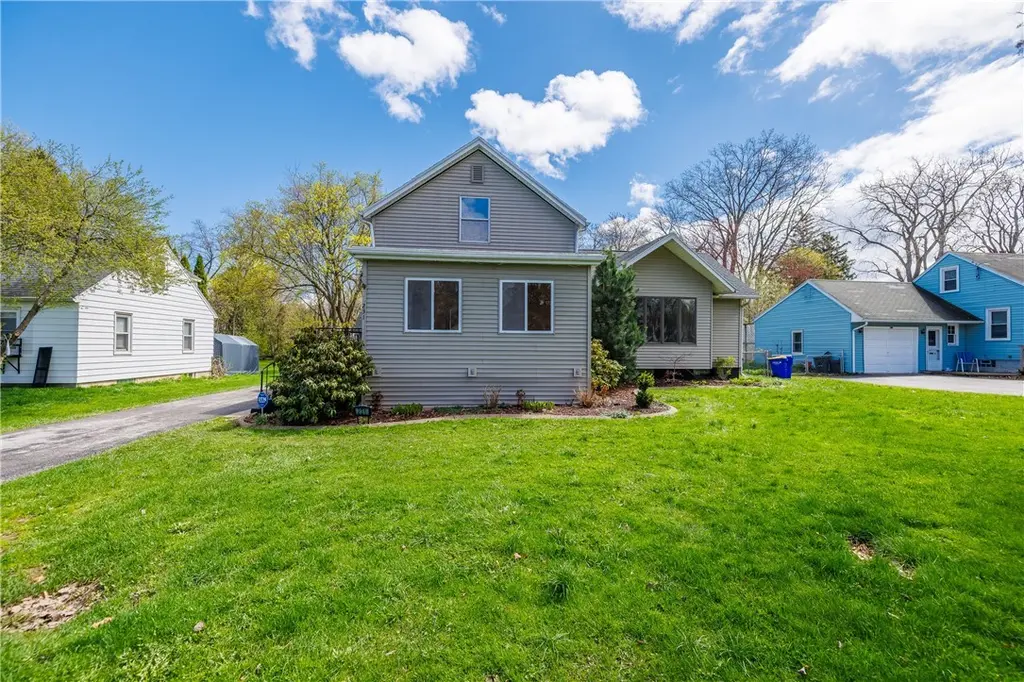
231 Hampton Blvd · Rochester, NY
Flood risk 1/10 · Minimal
- FEMA flood zone
- X (unshaded)
- Chance of flooding over 30 yrs
- 0.0%
- Est. flood insurance / yr
- $473 – $860
Fire risk 1/10 · Minimal
- Est. fire insurance / yr
- $691 – $1,283
Heat risk 2/10 · Minimal
- Hot days now (above 95°F)
- 7 days/yr
- Hot days in 30 yrs
- 16 days/yr
Wind risk 1/10 · Minimal
- Chance of severe wind over 30 yrs
- 0.0%
Air-quality risk 2/10 · Minimal
- Unhealthy air days now
- 1 days/yr
- Unhealthy air days in 30 yrs
- 2 days/yr
Risk factors via First Street. Map © Google.
Why this score? — see what drove the C+ grade
The composite is a weighted blend of 9 inputs, each scored 0–100. Each bar is that input's sub-score; the figure is the points it added to the 100-point composite (weight × sub-score).
- Cash flow +19.1/30.0
- ARV discount +15.0/15.0
- 1% rule +7.4/10.0
- DSCR +6.0/10.0
- Rent growth +3.8/5.0
- Livability +3.8/5.0
- Schools +3.2/10.0
- Condition / age +2.5/5.0
- Appreciation +0.0/10.0
$150,000
🖨 Deal sheet (PDF) 📄 Offer letter ✓ Due diligence
Listing remarks MLS
A Hidden Gem! A Complete Renovation throughout, including Huge Eat-In Kitchen w/ tile floor, Lg Cathedral Ceiling Living Rm is 20x20 w/ Skylights, Oversized Bath w/ new tile. One of the Largest Lots on the Street w/ 3 Car Garage! This home is part of 100% Money Back Guarantee Program. 1st Open House is Sunday Jan 17 1-2!
Key facts
- Oak cabinetry
- Eat-in kitchen
- Skylights
Tags
Neighborhood map
What this means for you Summary
Snapshot
- This is a 3-bed/2.5-bath single-family listed at $150k.
Deal economics
- At list price, monthly cash flow is $159 ($2k/yr) — positive.
- The deal already cash-flows at list — no discount required.
- Meets the 1% rule at list price ($2k rent vs $150k).
Location & tenants
- Location reads 76/100 on livability (#222 in NY, #3,482 nationally) — a middle-class / working-renter tenant base. Strengths: commute A+, cost of living A+, housing A+; Watch: schools D+, crime F, employment F.
- Greece Central School District (suburban): math 35% / reading 39% proficiency, ranked #544 of 590 in NY (top 92%) — families likely to look elsewhere, expect single-tenant / working-renter base with shorter leases.
- Market conditions: Rents rising fast (+5.4%/yr); 130 active listings in the ZIP; 12 comparable units currently listed for rent nearby; rentals lingering (median 46d on market — plan ~5-8 weeks vacancy on turnover, expect pricing pressure); 50% of comp listings sitting > 30 days — soft ceiling on asking rent; solid renter incomes; 1,169 units permitted in Monroe County in 2024 (591 in 5+ unit buildings).
Forward outlook
- Local home prices are declining (-3.0%/yr); year-one equity from $1k of loan paydown is wiped out by about $4k of value loss. Plan a longer hold.
- Monroe County population projected to shrink 6% by 2050 — rents likely to lag national; underwrite the cash flow, not the appreciation.
Negotiation context
- Only 7 days on market — expect competitive offers; lowballing is unlikely to land.
- 4 sale attempts since 13y ago with the ask held roughly flat each time — persistent listings suggest the price (not the market) is what's stuck; bring a comps-based counter.
- Current owner paid $125k; 20% above their basis — modest negotiation headroom, anchor on the comps not their cost.
Risks & watch-outs
- Watch-outs: property tax is 3.7% of price; built in 1905 — expect roof / HVAC / electrical / plumbing capex.
Questions for the listing agent
- Built in 1905 — when were the roof, HVAC, electrical panel, plumbing, and water heater last replaced?
- Property tax is high relative to price — has the assessment been appealed recently, and will the sale trigger a re-assessment?
- Is there a deadline driving the sale (1031 exchange, divorce, estate, relocation)? That informs how much negotiation room exists.
- Schools are D-rated, which usually means shorter tenancies and higher turnover. Who's the typical renter profile here, and what's been the actual vacancy rate?
- Crime grade is F in this area — have there been break-ins, vandalism, or insurance claims at this property in the last 3 years? What carrier currently insures it and at what premium?
- What's the average days-on-market for RENTAL listings here right now (not sales)? A rising rental-DOM trend means longer vacancies and softer asking-rent achievability than the comps imply.
- What's the recent tenant-quality profile in this submarket — average credit score on applications, eviction rate, late-payment / NSF rate, and stable-employment percentage? A property-management company in the area should have these aggregated.
- How much new for-sale + rental construction is in the pipeline within 1–3 miles? Heavy new supply typically softens prices + rents 12–24 months out; constrained supply supports both.
Investment metrics
- 1% rule
- 1.24% ✓
- Cap rate
- 7.56%
- Cash-on-cash
- 4.54%
- DSCR
- 1.20
- GRM
- 6.7
CMA / ARV
- ARV (on-the-fly)
- $260,064
- Comps found
- 12
Show comp detail 12 sales within ~0.75 mi
| Address | Dist | Beds/Ba | Sqft | Sold | Price | $/sf | Match |
|---|---|---|---|---|---|---|---|
| 231 Hampton Blvd | 0.00mi | 2/2.5 (-1) | 1,548 (0%) | 0mo | $260,000 | $168 | 95 |
| 522 Latta Rd | 0.48mi | 2/2.0 (-1) | 1,515 (-2%) | 4mo | $250,000 | $165 | 64 |
| 43 Armstrong Rd | 0.38mi | 3/2.0 | 1,720 (+11%) | 9mo | $156,000 | $91 | 54 |
| 95 Ripplewood Dr | 0.49mi | 4/2.0 (+1) | 1,400 (-10%) | 2mo | $290,000 | $207 | 52 |
| 966 Latta Rd | 0.64mi | 3/1.5 | 1,440 (-7%) | 5mo | $260,000 | $181 | 51 |
| 43 Sandalwood Dr | 0.63mi | 4/2.0 (+1) | 1,432 (-8%) | 1mo | $253,000 | $177 | 50 |
| 311 Chesterfield Dr | 0.52mi | 4/2.0 (+1) | 1,710 (+10%) | 7mo | $250,000 | $146 | 46 |
| 182 Chesterfield Dr | 0.70mi | 3/1.0 | 1,415 (-9%) | 5mo | $200,000 | $141 | 42 |
| 1060 Latta Rd | 0.74mi | 4/1.5 (+1) | 1,632 (+5%) | 7mo | $267,500 | $164 | 42 |
| 245 Pebbleview Dr | 0.73mi | 4/2.5 (+1) | 1,674 (+8%) | 8mo | $320,000 | $191 | 41 |
| 53 Howedale Dr | 0.65mi | 4/2.0 (+1) | 1,381 (-11%) | 9mo | $240,000 | $174 | 37 |
| 25 Meech Park | 0.74mi | 3/1.0 | 1,368 (-12%) | 9mo | $160,000 | $117 | 33 |
Match score weights: distance 35% · size 25% · config 20% · recency 20%. Top-matched comps best support the ARV.
Projected returns pro-forma
-3.0% appreciation · 5.37% rent growth · sell at horizon
- IRR
- -5.9%
- Equity multiple
- 0.77×
- Total profit
- $-9,454
- Equity at exit
- $22,365
- IRR
- 7.0%
- Equity multiple
- 1.60×
- Total profit
- $25,146
- Equity at exit
- $12,969
Cash invested: $42,000 (down + closing). Projections, not guarantees.
Landlord ↔ Tenant lean methodology
- Overall (STATE)
- 15 Strongly Tenant-Friendly
- State New York
- 15 Strongly Tenant-Friendly · D+10
- County
- — inherits STATE
- City
- — inherits STATE
ZIP-level market 14612
- Home prices YoY
- -33.0%
- Rents YoY
- 5.4%
- Active inventory
- 130
- Price-to-rent
- 6.7×
Monthly cashflow live
- Estimated rent
- $1,860 high interval (Pro) →
- Mortgage (P&I)
- −$787
- Tax from tax record
- −$461 /mo · $5,535/yr
- Insurance
- −$62
- HOA
- −$0
- Vacancy / Maint / Mgmt
- −$391
- Net cashflow
- $159
Break-even live
Sensitivity live
| Price | -10% $244 | -5% $201 | +0% $159 | +5% $116 | +10% $74 |
|---|---|---|---|---|---|
| Rent | -10% $12 | -5% $85 | +0% $159 | +5% $232 | +10% $306 |
| Rate | -1.0pp $234 | -0.5pp $197 | base $159 | +0.5pp $120 | +1.0pp $80 |
UW: 25.0% down · 7.5% · 30yr · 1.5% tax · 5.0% vac · 8.0% maint · 8.0% mgmt
Financing live
Cash to close
- Down payment
- $37,500
- Closing costs
- $4,500
- Reserves months
- —
- Total cash needed
- —
Loan-product check · same deal, 3 products live
Conventional
25% down · 7.5% · 30yr
- Down + closing
- —
- Monthly P&I
- —
- Monthly cashflow
- —
- DSCR
- —
- Eligible?
- —
Personal DTI + credit; lowest rate.
DSCR
20% down · 8.5% · 30yr
- Down + closing
- —
- Monthly P&I
- —
- Monthly cashflow
- —
- DSCR
- —
- Eligible?
- —
No personal income docs; deal must DSCR.
Hard money
10% down · 12.0% · 12mo
- Down + closing
- —
- Monthly P&I
- —
- Monthly cashflow
- —
- DSCR
- —
- Eligible?
- —
Short-term bridge; refi at stabilization.
Rent comps 12 comps
| Address | Beds | Baths | Sqft | Rent | $/sqft | DOM | Units | Dist |
|---|---|---|---|---|---|---|---|---|
| 125 Windsor Rd Rochester, NY | 2.0 | 1.0 | 1142 | $1,700 | $1.49 | 4d | 1 | 0.19mi |
| 500 Greenleaf Rd Rochester, NY | 1.0–2.0 | 1.0 | 1176 | $1,650 | $1.40 | 4d | 1 | 0.70mi |
| 3677 Lake Ave Rochester, NY | 2.0 | 1.0 | 1088 | $1,200 | $1.10 | 45d | 1 | 0.71mi |
| 4302 Lake Ave Unit 1 Rochester, NY | 3.0 | 1.5 | 1600 | $3,000 | $1.88 | 45d | 1 | 0.73mi |
| 123 Spanish Trl Rochester, NY | 1.0–2.0 | 1.0–1.5 | 945 | $1,775 | $1.88 | 4d | 1 | 0.77mi |
| 108 Glenbrook Rd Rochester, NY | 3.0 | 1.0 | 1088 | $1,850 | $1.70 | 25d | 1 | 0.79mi |
| 304 Bakerdale Rd Rochester, NY | 3.0 | 1.0 | 1256 | $1,650 | $1.31 | 46d | 1 | 0.99mi |
| 704 Rumson Rd Rochester, NY | 3.0 | 1.0 | 1100 | $1,950 | $1.77 | 5d | 1 | 1.08mi |
| 37 Linda Dr Unit 1 Rochester, NY | 3.0 | 2.0 | 1600 | $2,100 | $1.31 | 45d | 1 | 1.17mi |
| 130 N Park Dr Rochester, NY | 3.0 | 1.5 | 1120 | $2,000 | $1.79 | 45d | 1 | 1.22mi |
| 37 Oakmount Dr Rochester, NY | 4.0 | 2.0 | 1368 | $2,500 | $1.83 | 16d | 1 | 1.29mi |
| 175 English Rd Rochester, NY | 3.0 | 1.5 | 1194 | $1,975 | $1.65 | 45d | 1 | 1.31mi |
Listing history 9 events
-
2026-04-28status Pending
-
2026-04-21$150,000 Active
-
2019-05-17soldstatus $125,000
-
2016-04-14soldstatus $110,000 Closed Sale or Rented 322-char remark
Show marketing remark (322 chars)
A Hidden Gem! A Complete Renovation throughout, including Huge Eat-In Kitchen w/ tile floor, Lg Cathedral Ceiling Living Rm is 20x20 w/ Skylights, Oversized Bath w/ new tile. One of the Largest Lots on the Street w/ 3 Car Garage! This home is part of 100% Money Back Guarantee Program. 1st Open House is Sunday Jan 17 1-2!
-
2016-04-14soldstatus $110,000
Show marketing remark (322 chars)
A Hidden Gem! A Complete Renovation throughout, including Huge Eat-In Kitchen w/ tile floor, Lg Cathedral Ceiling Living Rm is 20x20 w/ Skylights, Oversized Bath w/ new tile. One of the Largest Lots on the Street w/ 3 Car Garage! This home is part of 100% Money Back Guarantee Program. 1st Open House is Sunday Jan 17 1-2!
-
2016-01-25status Pending Sale 322-char remark
Show marketing remark (322 chars)
A Hidden Gem! A Complete Renovation throughout, including Huge Eat-In Kitchen w/ tile floor, Lg Cathedral Ceiling Living Rm is 20x20 w/ Skylights, Oversized Bath w/ new tile. One of the Largest Lots on the Street w/ 3 Car Garage! This home is part of 100% Money Back Guarantee Program. 1st Open House is Sunday Jan 17 1-2!
-
2016-01-13$114,900 Active 322-char remark
Show marketing remark (322 chars)
A Hidden Gem! A Complete Renovation throughout, including Huge Eat-In Kitchen w/ tile floor, Lg Cathedral Ceiling Living Rm is 20x20 w/ Skylights, Oversized Bath w/ new tile. One of the Largest Lots on the Street w/ 3 Car Garage! This home is part of 100% Money Back Guarantee Program. 1st Open House is Sunday Jan 17 1-2!
-
2013-06-27$109,900
-
2013-03-24$114,900
ⓘ Source: listings_history table (triggers on properties + properties_extension) + one-shot
backfill from property_details.listing_events for pre-trigger history.
Tax reassessment forecast NY · Partial reset (capped growth)
- Current annual tax
- $5,535 · $461/mo
- Projected year-2 tax
- $5,535 · $461/mo
- Expected delta
- $0/yr ($0/mo · 0.0%)
ⓘ Screening estimate from a state-policy table — verify with the county assessor before closing.
Climate risk First Street
- Flood 1/10 Low FEMA zone X (unshaded) · 0% chance over 30 yrs
- Wildfire 1/10 Low
- Heat 2/10 Low 7 d/yr ≥95°F today · 16 d/yr by 30 yrs out
- Wind 1/10 Low 0% chance of damaging wind over 30 yrs
- Air quality 2/10 Low 1 unhealthy d/yr today · 2 by 30 yrs out
Nearby sold comps map
Loading sold comps map…
Walkable amenities ~0.75 mi
Loading nearby amenities…
Taxation est. · year 1
- Rental income
- $22,317
- − Mortgage interest
- −$8,402
- − Property taxes
- −$5,535
- − Insurance
- −$750
- − Repairs & maintenance
- −$1,785
- − Management
- −$1,785
- − Depreciation
- −$4,364
- Taxable loss
- −$305
- Est. tax savings @ 24.0%
- +$73
- After-tax cash flow
- $1,979/yr
For passive investors: Depreciation is non-cash, so a rental often shows a tax loss while cash-flowing — sheltering income. Rental losses are passive: they offset passive income freely, and up to $25,000/yr can offset ordinary (W-2) income if you actively participate and your MAGI is under $100k (phasing out to $0 by $150k); unused losses carry forward. On sale, claimed depreciation is recaptured at up to 25%, and gains may owe capital-gains tax (a 1031 exchange can defer both). Figures are a year-1 estimate at your 24.0% rate — not tax advice; consult a CPA.
Schools (NCES district)
- District
- Greece Central School District
- NCES district ID
- 3612630
- Math proficiency
- 35% ▼ -14.00%
- Reading proficiency
- 39% ▼ -3.00%
- Median HH income
- $52,718
- Composite
- 32.26/100
- National rank
- #5761
- State rank
- #544 of 590 in NY
Livability — Rochester
- Score
- 76/100
- State rank
- #222
- US rank
- #3482
Category grades
Schools grade is shown separately in the Schools card above.
Census & demographics
- County
- Monroe County · 674,131 people
- City population
- 432,803
- Metro
- Rochester, NY
- Population (ZIP)
- 35,152
- Household income
- $82,800
- Rent vs Own
- Severe rent burden
- 1063.0
Population outlook (Monroe County) Hauer SSP2
- Today (2025)
- 759,460 people
- By 2030
- 757,154 · -0.3%
- By 2040
- 740,644 · -2.5%
- By 2050
- 714,443 · -5.9%
- By 2075
- 645,883 · -15.0%
- By 2100
- 547,084 · -28.0%
Race, ethnicity, and origin ACS 2023
- Neighborhood character
- Predominantly White (78%)
- Race & ethnicity
- White 78% Black 9% Hispanic / Latino 7% Two or more races 6%
- Hispanic origin (detail)
- Puerto Rican 5%
- Common ancestry
- Romanian 4% Lithuanian 3% Slovak 2%
- Foreign-born
- 5% · Canada
- Languages at home
- 93% English-only · Spanish 4% Other Indo-European 1% Russian/Polish/Slavic 1%
Political lean MEDSL · Monroe
- 2024 margin
- D (+19.1) · D 59.5% · R 40.5%
- 2008→2024 swing
- +1.4pp toward D · 2008: 17.7pp · 2024: 19.1pp
- All cycles
- 2024: D+19.1 2020: D+21.0 2016: D+14.1 2012: D+17.4 2008: D+17.7
Not yet ingested
- Civics
- —
Market trends
- HPI YoY
- ▼ -124.89%
- Current HPI
- 254.157
- Rent YoY
- ▲ 5.37%
- Metro
- Rochester, NY
- State GDP YoY
- ▲ 2.60%
- F500 in state
- 92
Industry mix (Fortune 500 HQ in NY)
| Industry | F500 HQs | Revenue |
|---|---|---|
| Financial Services | 10 | $950B |
|
||
| Consumer Goods | 9 | $162B |
|
||
| Insurance | 4 | $225B |
|
||
| Telecommunications | 2 | $144B |
|
||
| Pharmaceuticals | 2 | $112B |
|
||
| Media / Entertainment | 2 | $69B |
|
||
Price history
+30.5% since first listed9 events — show timeline
- 2026-04-28 Pending — UNYREIS
- 2026-04-21 Listed $150,000 UNYREIS
- 2019-05-17 Sold (Public Records) $125,000 Public Records
- 2016-04-14 Sold (Public Records) $110,000 Public Records
- 2016-04-14 Sold (MLS) $110,000 UNYREIS
- 2016-01-25 Pending — UNYREIS
- 2016-01-13 Listed $114,900 UNYREIS
- 2013-06-27 Listed $109,900 UNYREIS
- 2013-03-24 Listed $114,900 UNYREIS
Property tax history
+4.0%/yrLatest (2025): $5,535 · +0.5% YoY. Source: county tax records.
Cash-flow waterfall
monthlySold comps — $/sqft
last 12 mo · ≤1 miLoading sold comps…