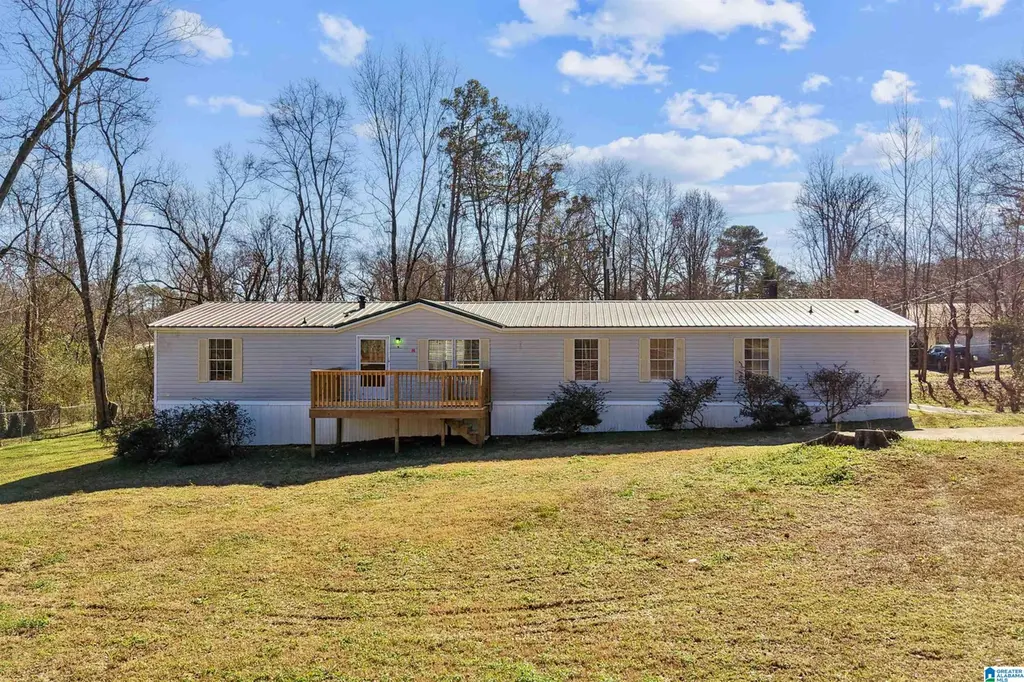
1401 Winfield Dr · Hoover, AL
Flood risk 1/10 · Minimal
- FEMA flood zone
- X (unshaded)
- Chance of flooding over 30 yrs
- 0.0%
- Est. flood insurance / yr
- $507 – $1,088
Fire risk 3/10 · Minor
- Est. fire insurance / yr
- $916 – $1,700
Heat risk 6/10 · Moderate
- Hot days now (above 106°F)
- 7 days/yr
- Hot days in 30 yrs
- 19 days/yr
Wind risk 6/10 · Moderate
- Chance of severe wind over 30 yrs
- 27.0%
Air-quality risk 3/10 · Minor
- Unhealthy air days now
- 2 days/yr
- Unhealthy air days in 30 yrs
- 5 days/yr
Risk factors via First Street. Map © Google.
Why this score? — see what drove the B grade
The composite is a weighted blend of 9 inputs, each scored 0–100. Each bar is that input's sub-score; the figure is the points it added to the 100-point composite (weight × sub-score).
- Cash flow +30.0/30.0
- 1% rule +10.0/10.0
- DSCR +10.0/10.0
- ARV discount +7.5/15.0
- Rent growth +5.0/5.0
- Livability +4.2/5.0
- Condition / age +2.5/5.0
- Schools +1.8/10.0
- Appreciation +0.0/10.0
$194,000
🖨 Deal sheet (PDF) 📄 Offer letter ✓ Due diligence
Listing remarks MLS
Welcome home to this 1999 manufactured home. This home boasts 4 bedrooms and 2 baths and has not one but 2 living areas to enjoy. Located in Shannon Alabama this home is convenient to downtown and Ross Bridge. Come see what this home has to offer with a . 75 acre fully fenced in yard. Metal roof was installed in 2014
Key facts
- Metal roof
- 2 living areas
- Fully fenced in yard
Tags
Neighborhood map
What this means for you Summary
Snapshot
- This is a 4-bed/2.0-bath single-family listed at $194k.
Deal economics
- At list price, monthly cash flow is $1k ($14k/yr) — positive.
- The deal already cash-flows at list — no discount required.
- Meets the 1% rule at list price ($3k rent vs $194k).
- Recommended offer: $171k (12.0% below list) — sets the bar for market timing.
- Cap rate 13.4% vs local median 2.4% in Hoover — top-decile yield for the area; either an underpriced asset or a hidden risk that comps aren't pricing in. Stress-test before assuming the spread holds.
Location & tenants
- Location reads 84/100 on livability (#1 in AL, #630 nationally) — a professional / high-income tenant draw. Strengths: crime A+, employment A+, housing A+.
- Jefferson County (suburban): math 9% / reading 32% proficiency, ranked #104 of 129 in AL (top 81%) — low school quality limits family demand, transient renter base, plan for 1-2y turnover.
- Market conditions: Rents rising fast (+14.8%/yr); 311 active listings in the ZIP; 4 comparable units currently listed for rent nearby; rentals at typical pace (median 16d on market — plan ~3-4 weeks tenant-placement turnaround); solid renter incomes; 2,114 units permitted in Jefferson County in 2024 (556 in 5+ unit buildings).
- This rent runs 43% of the median local income ($82k/yr) — at the standard rent-burdened threshold; future hikes will face affordability resistance.
Forward outlook
- Local home prices are declining (-3.0%/yr); year-one equity from $1k of loan paydown is wiped out by about $6k of value loss. Plan a longer hold.
- Jefferson County population projected to shrink 4% by 2050 — rents likely to lag national; underwrite the cash flow, not the appreciation.
- At projected returns (-3.0% appreciation + 8.0% rent growth), your $54k cash investment doubles in ~5 years — after that, you're playing with house money.
Negotiation context
- It's been on market 140 days — a 12% lower offer ($171k) is reasonable based on typical stale-listing flexibility.
- Current owner paid $10k; list at $194k implies a 1942% gain — meaningful room to come down on a strong offer.
Risks & watch-outs
- Climate carrying-cost: major wind risk, 27% chance of damaging wind over 30y; extreme-heat days projected 7→19/yr by 2055 (HVAC capex compounding) — expect insurance premiums to compound above CPI over the hold.
Questions for the listing agent
- It's been on market 140 days. Have you received any prior offers? Is the seller open to a 12% concession, seller financing, or rate buy-down credit?
- Why hasn't it sold? Are there any deal-killer items the seller is aware of (foundation, flood, title, zoning, code violations)?
- Is there a deadline driving the sale (1031 exchange, divorce, estate, relocation)? That informs how much negotiation room exists.
- Schools are A-rated — typically a magnet for longer-tenancy family renters. What's the average tenant stay here, and is there a school-zone premium baked into asking?
- What's the average days-on-market for RENTAL listings here right now (not sales)? A rising rental-DOM trend means longer vacancies and softer asking-rent achievability than the comps imply.
- What's the recent tenant-quality profile in this submarket — average credit score on applications, eviction rate, late-payment / NSF rate, and stable-employment percentage? A property-management company in the area should have these aggregated.
- How much new for-sale + rental construction is in the pipeline within 1–3 miles? Heavy new supply typically softens prices + rents 12–24 months out; constrained supply supports both.
Investment metrics
- 1% rule
- 1.50% ✓
- Cap rate
- 13.40%
- Cash-on-cash
- 25.38%
- DSCR
- 2.13
- GRM
- 5.6
CMA / ARV
- ARV (on-the-fly)
- $512,960
- Comps found
- 12
Show comp detail 12 sales within ~0.75 mi
| Address | Dist | Beds/Ba | Sqft | Sold | Price | $/sf | Match |
|---|---|---|---|---|---|---|---|
| 3135 Sawyer Dr | 0.69mi | 4/3.5 | 2,304 (+3%) | 2mo | $487,500 | $212 | 55 |
| 3287 Sawyer Dr | 0.70mi | 4/3.5 | 2,412 (+8%) | 1mo | $515,000 | $214 | 48 |
| 3159 Sawyer Dr | 0.65mi | 4/3.5 | 2,045 (-9%) | 8mo | $485,000 | $237 | 42 |
| 3275 Sawyer Dr | 0.70mi | 3/2.5 (-1) | 2,110 (-6%) | 11mo | $480,500 | $228 | 42 |
| 3345 Sawyer Dr | 0.64mi | 4/3.0 | 2,436 (+9%) | 13mo | $470,000 | $193 | 41 |
| 3221 Sawyer Dr | 0.65mi | 4/3.5 | 2,400 (+7%) | 15mo | $490,000 | $204 | 40 |
| 3130 Sawyer Dr | 0.70mi | 3/2.5 (-1) | 2,027 (-10%) | 8mo | $470,000 | $232 | 38 |
| 3447 Sawyer Dr | 0.66mi | 3/2.5 (-1) | 1,920 (-14%) | 3mo | $440,000 | $229 | 36 |
| 3455 Sawyer Dr | 0.67mi | 3/2.5 (-1) | 1,920 (-14%) | 3mo | $469,000 | $244 | 35 |
| 3466 Sawyer Dr | 0.67mi | 3/2.5 (-1) | 1,920 (-14%) | 4mo | $440,000 | $229 | 35 |
| 3469 Sawyer Dr | 0.69mi | 3/2.5 (-1) | 1,920 (-14%) | 16mo | $461,000 | $240 | 23 |
| 3127 Sawyer Dr | 0.71mi | 3/2.5 (-1) | 1,920 (-14%) | 16mo | $453,000 | $236 | 23 |
Match score weights: distance 35% · size 25% · config 20% · recency 20%. Top-matched comps best support the ARV.
Projected returns pro-forma
-3.0% appreciation · 8.0% rent growth · sell at horizon
- IRR
- 24.0%
- Equity multiple
- 2.05×
- Total profit
- $57,006
- Equity at exit
- $28,926
- IRR
- 34.7%
- Equity multiple
- 4.93×
- Total profit
- $213,440
- Equity at exit
- $16,774
Cash invested: $54,320 (down + closing). Projections, not guarantees.
Landlord ↔ Tenant lean methodology
- Overall (STATE)
- 90 Strongly Landlord-Friendly
- State Alabama
- 90 Strongly Landlord-Friendly · R+15
- County
- — inherits STATE
- City
- — inherits STATE
ZIP-level market 35022
- Home prices YoY
- -20.2%
- Rents YoY
- 14.8%
- Active inventory
- 311
- Price-to-rent
- 5.6×
Monthly cashflow live
- Estimated rent
- $2,906 medium interval (Pro) →
- Mortgage (P&I)
- −$1,017
- Tax from tax record
- −$49 /mo · $587/yr
- Insurance
- −$81
- HOA
- −$0
- Vacancy / Maint / Mgmt
- −$610
- Net cashflow
- $1,149
Break-even live
Sensitivity live
| Price | -10% $1,258 | -5% $1,204 | +0% $1,149 | +5% $1,094 | +10% $1,039 |
|---|---|---|---|---|---|
| Rent | -10% $919 | -5% $1,034 | +0% $1,149 | +5% $1,263 | +10% $1,378 |
| Rate | -1.0pp $1,246 | -0.5pp $1,198 | base $1,149 | +0.5pp $1,098 | +1.0pp $1,047 |
UW: 25.0% down · 7.5% · 30yr · 1.5% tax · 5.0% vac · 8.0% maint · 8.0% mgmt
Financing live
Cash to close
- Down payment
- $48,500
- Closing costs
- $5,820
- Reserves months
- —
- Total cash needed
- —
Loan-product check · same deal, 3 products live
Conventional
25% down · 7.5% · 30yr
- Down + closing
- —
- Monthly P&I
- —
- Monthly cashflow
- —
- DSCR
- —
- Eligible?
- —
Personal DTI + credit; lowest rate.
DSCR
20% down · 8.5% · 30yr
- Down + closing
- —
- Monthly P&I
- —
- Monthly cashflow
- —
- DSCR
- —
- Eligible?
- —
No personal income docs; deal must DSCR.
Hard money
10% down · 12.0% · 12mo
- Down + closing
- —
- Monthly P&I
- —
- Monthly cashflow
- —
- DSCR
- —
- Eligible?
- —
Short-term bridge; refi at stabilization.
Rent comps 4 comps
| Address | Beds | Baths | Sqft | Rent | $/sqft | DOM | Units | Dist |
|---|---|---|---|---|---|---|---|---|
| 100 Birchall Ln Hoover, AL | 1.0–3.0 | 1.0–2.0 | 1194 | $2,343 | $1.96 | 2d | 13 | 0.71mi |
| 2197 Samuel Pass Hoover, AL | 4.0 | 3.0 | 2050 | $3,450 | $1.68 | 15d | 1 | 0.77mi |
| 1819 Winnepeg Cir Bessemer, AL | 4.0 | 3.0 | 2638 | $2,906 | $1.10 | 2d | 1 | 1.04mi |
| 2460 Mountain Dr Hoover, AL | 4.0 | 2.5 | 2318 | $2,499 | $1.08 | 44d | 1 | 1.49mi |
Listing history 16 events
-
2026-06-18days on market $194,000 Active 140 DOM
-
2026-06-17days on market $194,000 Active 139 DOM
-
2026-06-16days on market $194,000 Active 138 DOM
-
2026-06-15days on market $194,000 Active 137 DOM
-
2026-06-13days on market $194,000 Active 135 DOM
-
2026-06-10days on market $194,000 Active 132 DOM
-
2026-06-09days on market $194,000 Active 131 DOM
-
2026-06-08days on market $194,000 Active 130 DOM
-
2026-06-07days on market $194,000 Active 129 DOM
-
2026-06-03days on market $194,000 Active 125 DOM
-
2026-06-02days on market $194,000 Active 124 DOM
-
2026-06-01days on market $194,000 Active 123 DOM
-
2026-05-31days on market $194,000 Active 122 DOM
-
2026-04-01price $194,000 318-char remark
Show marketing remark (318 chars)
Welcome home to this 1999 manufactured home. This home boasts 4 bedrooms and 2 baths and has not one but 2 living areas to enjoy. Located in Shannon Alabama this home is convenient to downtown and Ross Bridge. Come see what this home has to offer with a . 75 acre fully fenced in yard. Metal roof was installed in 2014
-
2026-01-29$200,000 Active 318-char remark
Show marketing remark (318 chars)
Welcome home to this 1999 manufactured home. This home boasts 4 bedrooms and 2 baths and has not one but 2 living areas to enjoy. Located in Shannon Alabama this home is convenient to downtown and Ross Bridge. Come see what this home has to offer with a . 75 acre fully fenced in yard. Metal roof was installed in 2014
-
2005-09-21soldstatus $9,500
ⓘ Source: listings_history table (triggers on properties + properties_extension) + one-shot
backfill from property_details.listing_events for pre-trigger history.
Tax reassessment forecast AL · Resets to sale price
- Current annual tax
- $587 · $49/mo
- Projected year-2 tax
- $795 · $66/mo
- Expected delta
- +$208/yr (+$17/mo · 35.5%)
ⓘ Screening estimate from a state-policy table — verify with the county assessor before closing.
Climate risk First Street
- Flood 1/10 Low FEMA zone X (unshaded) · 0% chance over 30 yrs
- Wildfire 3/10 Moderate
- Heat 6/10 Major 7 d/yr ≥106°F today · 19 d/yr by 30 yrs out
- Wind 6/10 Major 27% chance of damaging wind over 30 yrs
- Air quality 3/10 Moderate 2 unhealthy d/yr today · 5 by 30 yrs out
Nearby sold comps map
Loading sold comps map…
Walkable amenities ~0.75 mi
Loading nearby amenities…
Taxation est. · year 1
- Rental income
- $34,873
- − Mortgage interest
- −$10,867
- − Property taxes
- −$587
- − Insurance
- −$970
- − Repairs & maintenance
- −$2,790
- − Management
- −$2,790
- − Depreciation
- −$5,644
- Taxable income
- $11,225
- Est. tax owed @ 24.0%
- −$2,694
- After-tax cash flow
- $11,090/yr
For passive investors: Depreciation is non-cash, so a rental often shows a tax loss while cash-flowing — sheltering income. Rental losses are passive: they offset passive income freely, and up to $25,000/yr can offset ordinary (W-2) income if you actively participate and your MAGI is under $100k (phasing out to $0 by $150k); unused losses carry forward. On sale, claimed depreciation is recaptured at up to 25%, and gains may owe capital-gains tax (a 1031 exchange can defer both). Figures are a year-1 estimate at your 24.0% rate — not tax advice; consult a CPA.
Schools (NCES district)
- District
- Jefferson County
- NCES district ID
- 0101920
- Math proficiency
- 9% ▼ -24.00%
- Reading proficiency
- 32% ▼ -5.00%
- Median HH income
- $51,712
- Composite
- 18.4/100
- National rank
- #8937
- State rank
- #104 of 129 in AL
Livability — Hoover
- Score
- 84/100
- State rank
- #1
- US rank
- #630
Category grades
Schools grade is shown separately in the Schools card above.
Census & demographics
- County
- Jefferson County · 527,445 people
- City population
- 76,805
- Metro
- Birmingham-Hoover, AL
- Population (ZIP)
- 23,126
- Household income
- $81,846
- Rent vs Own
- Severe rent burden
- 554.0
Population outlook (Jefferson County) Hauer SSP2
- Today (2025)
- 669,185 people
- By 2030
- 669,694 · +0.1%
- By 2040
- 661,388 · -1.2%
- By 2050
- 643,086 · -3.9%
- By 2075
- 577,267 · -13.7%
- By 2100
- 474,758 · -29.1%
Race, ethnicity, and origin ACS 2023
- Neighborhood character
- Diverse neighborhood (Simpson 0.56)
- Race & ethnicity
- Black 53% White 41% Hispanic / Latino 3% Two or more races 2% Asian 1%
- Common ancestry
- Italian 1% Slovak 1% Iranian 1%
- Foreign-born
- 4% · Canada, China
- Languages at home
- 96% English-only · Spanish 3% Chinese 1%
Political lean MEDSL · Jefferson
- 2024 margin
- D (+10.4) · D 54.6% · R 44.2% · Other 1.2%
- 2008→2024 swing
- +5.4pp toward D · 2008: 5.1pp · 2024: 10.4pp
- All cycles
- 2024: D+10.4 2020: D+13.2 2016: D+7.2 2012: D+6.0 2008: D+5.1
Not yet ingested
- Civics
- —
Market trends
- HPI YoY
- ▼ -55.40%
- Current HPI
- 219.3839
- Rent YoY
- ▲ 14.80%
- Metro
- Birmingham-Hoover, AL
- State GDP YoY
- ▲ 2.94%
- F500 in state
- 4
Industry mix (Fortune 500 HQ in AL)
| Industry | F500 HQs | Revenue |
|---|---|---|
| Financial Services | 1 | $8B |
|
||
| Healthcare | 1 | $5B |
|
||
Price history
+1942.1% since first listed3 events — show timeline
- 2026-04-01 Price Changed $194,000 Greater Alabama MLS
- 2026-01-29 Listed $200,000 Greater Alabama MLS
- 2005-09-21 Sold (Public Records) $9,500 Public Records
Property tax history
+7.0%/yrLatest (2025): $587 · +0.0% YoY. Source: county tax records.
Cash-flow waterfall
monthlySold comps — $/sqft
last 12 mo · ≤1 miLoading sold comps…