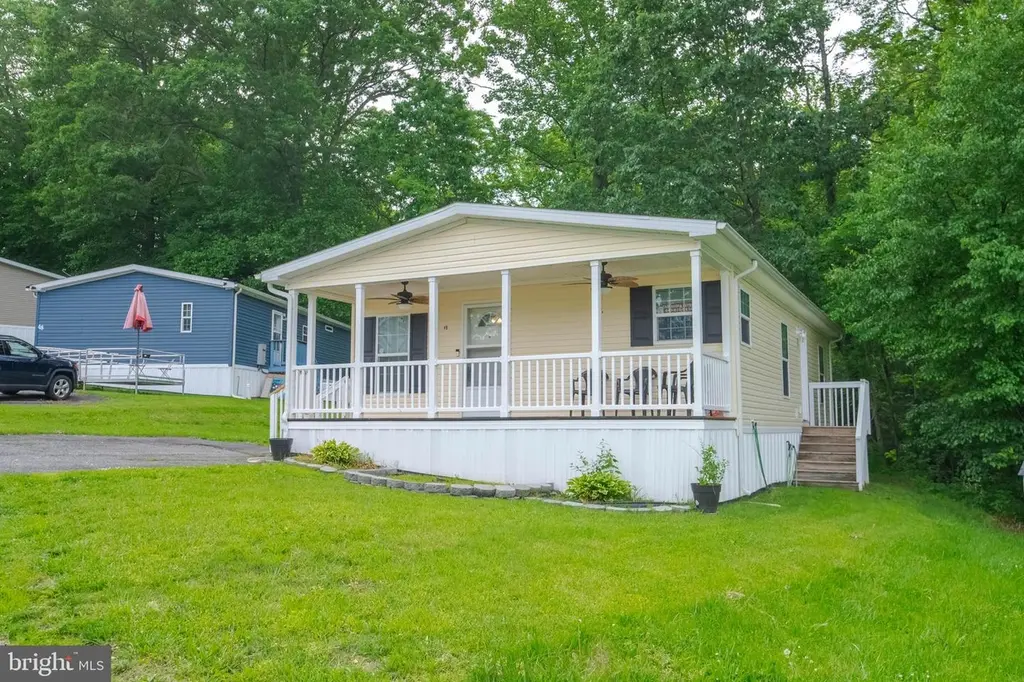
46 Walnut St · Aberdeen, MD
Flood risk No data
- FEMA flood zone
- —
- Chance of flooding over 30 yrs
- —
- Est. flood insurance / yr
- —
Fire risk No data
- Est. fire insurance / yr
- —
Heat risk No data
- Hot days now (above threshold)
- —
- Hot days in 30 yrs
- —
Wind risk No data
- Chance of severe wind over 30 yrs
- —
Air-quality risk No data
- Unhealthy air days now
- —
- Unhealthy air days in 30 yrs
- —
Risk factors via First Street. Map © Google.
Why this score? — see what drove the B grade
The composite is a weighted blend of 9 inputs, each scored 0–100. Each bar is that input's sub-score; the figure is the points it added to the 100-point composite (weight × sub-score).
- Cash flow +30.0/30.0
- 1% rule +10.0/10.0
- DSCR +10.0/10.0
- ARV discount +7.3/15.0
- Livability +4.0/5.0
- Condition / age +3.8/5.0
- Schools +2.9/10.0
- Rent growth +2.5/5.0
- Appreciation +0.0/10.0
$55,000
🖨 Deal sheet 📄 Offer letter ✓ Due diligence
Listing remarks
Beautiful 2018 manufactured home in the sought-after Swan Harbour Dell community. This home features 2 bedrooms, 1 full bathroom, an open-concept living area with fireplace, and a kitchen with a sit-at breakfast bar/island. Relax on your spacious front porch with 2 ceiling fans. Enjoy the serene creek that flows right in your back yard and a view of it from the 2nd bedroom window. Lot rent is $780/month and includes water, sewer, and trash. Community allows 1 pet, 25 lbs and under. Buyer to verify community requirements.
Key facts
- Front porch
- Ceiling fans
- Serene creek
Tags
Property features AI
Finance
- Other: Property manager present; Ownership is ground rent
- Financial info: Ground rent exists and is paid monthly
Exterior
- Parking: Off-street parking via driveway; Two driveway spaces (total 2 parking spaces)
- Utilities: Public water; Public sewer; Propane available
- Home design: Manufactured double-wide home; Building not winterized; Excellent condition; Estimated year built
- Construction: Vinyl siding construction; Double-wide mobile home (24 ft x 38 ft); Make: SKYL
- Exterior features: Vinyl siding; Above-grade other structures; Water-oriented property on a creek
Interior
- Bedrooms: Two bedrooms on the main level
- Bathrooms: One full bathroom on the main level
- Heating & cooling: Heat pump(s); Propane (leased) heating fuel; Central air conditioning (electric); Electric hot water
- Interior features: Estimated living area; One fireplace
Neighborhood map
What this means for you Summary
Snapshot
- This is a 2-bed/1.0-bath single-family listed at $55k. Condition is rated good.
Deal economics
- At list price, monthly cash flow is $879 ($11k/yr) — positive.
- The deal already cash-flows at list — no discount required.
- Meets the 1% rule at list price ($2k rent vs $55k).
- Cap rate 25.5% vs local median 4.9% in Aberdeen — top-decile yield for the area; either an underpriced asset or a hidden risk that comps aren't pricing in. Stress-test before assuming the spread holds.
Location & tenants
- Location reads 81/100 on livability (#42 in MD, #1,545 nationally) — a professional / high-income tenant draw. Strengths: commute A+, housing A+, health & safety A+; Watch: schools C-, crime F.
- Harford County Public Schools (suburban): math 22% / reading 39% proficiency, ranked #9 of 24 in MD (top 38%) — families likely to look elsewhere, expect single-tenant / working-renter base with shorter leases.
- Market conditions: 174 active listings in the ZIP; 3 comparable units currently listed for rent nearby; rentals lingering (median 44d on market — plan ~5-8 weeks vacancy on turnover, expect pricing pressure); 67% of comp listings sitting > 30 days — soft ceiling on asking rent; solid renter incomes; 803 units permitted in Harford County in 2024 (26 in 5+ unit buildings).
- This rent is only 18% of the median local income ($107k/yr) — well below the 30% rent-burden line; pricing power to push rent on renewal without tenant pushback.
Forward outlook
- Local home prices are declining (-3.0%/yr); year-one equity from $380 of loan paydown is wiped out by about $2k of value loss. Plan a longer hold.
- At projected returns (-3.0% appreciation + 3.0% rent growth), your $15k cash investment doubles in ~2 years — after that, you're playing with house money.
Negotiation context
- Only 13 days on market — expect competitive offers; lowballing is unlikely to land.
Questions for the listing agent
- Is there a deadline driving the sale (1031 exchange, divorce, estate, relocation)? That informs how much negotiation room exists.
- Crime grade is F in this area — have there been break-ins, vandalism, or insurance claims at this property in the last 3 years? What carrier currently insures it and at what premium?
- What's the average days-on-market for RENTAL listings here right now (not sales)? A rising rental-DOM trend means longer vacancies and softer asking-rent achievability than the comps imply.
- What's the recent tenant-quality profile in this submarket — average credit score on applications, eviction rate, late-payment / NSF rate, and stable-employment percentage? A property-management company in the area should have these aggregated.
- How much new for-sale + rental construction is in the pipeline within 1–3 miles? Heavy new supply typically softens prices + rents 12–24 months out; constrained supply supports both.
Investment metrics
- 1% rule
- 2.90% ✓
- Cap rate
- 25.46%
- Cash-on-cash
- 68.46%
- DSCR
- 4.05
- GRM
- 2.9
CMA / ARV
- ARV (on-the-fly)
- $54,720
- Comps found
- 3
Show comp detail 3 sales within ~0.75 mi
| Address | Dist | Beds/Ba | Sqft | Sold | Price | $/sf | Match |
|---|---|---|---|---|---|---|---|
| 46 Walnut St | 0.00mi | 2/1.0 | 912 (0%) | 0mo | $55,000 | $60 | 100 |
| 37 Pine St | 0.09mi | 3/2.0 (+1) | 1,000 (+10%) | 9mo | $46,000 | $46 | 63 |
| 2225 Williams Dr | 0.57mi | 3/1.0 (+1) | 1,001 (+10%) | 0mo | $165,000 | $165 | 52 |
Match score weights: distance 35% · size 25% · config 20% · recency 20%. Top-matched comps best support the ARV.
Projected returns pro-forma
-3.0% appreciation · 3.0% rent growth · sell at horizon
- IRR
- 67.9%
- Equity multiple
- 4.06×
- Total profit
- $47,067
- Equity at exit
- $8,201
- IRR
- 72.0%
- Equity multiple
- 8.35×
- Total profit
- $113,134
- Equity at exit
- $4,755
Cash invested: $15,400 (down + closing). Projections, not guarantees.
Landlord ↔ Tenant lean methodology
- Overall (STATE)
- 27 Tenant-Leaning
- State Maryland
- 27 Tenant-Leaning · D+14
- County
- — inherits STATE
- City
- — inherits STATE
ZIP-level market 21078
- Home prices YoY
- -33.4%
- Active inventory
- 174
- Price-to-rent
- 2.9×
Monthly cashflow live
- Estimated rent
- $1,593 medium interval (Pro) →
- Mortgage (P&I)
- −$288
- Tax est. 1.5%
- −$69 /mo · $825/yr
- Insurance
- −$23
- HOA
- −$0
- Vacancy / Maint / Mgmt
- −$335
- Net cashflow
- $879
Break-even live
UW: 25.0% down · 7.5% · 30yr · 1.5% tax · 5.0% vac · 8.0% maint · 8.0% mgmt
Financing live
Cash to close
- Down payment
- $13,750
- Closing costs
- $1,650
- Reserves months
- —
- Total cash needed
- —
Loan-product check · same deal, 3 products live
Conventional
25% down · 7.5% · 30yr
- Down + closing
- —
- Monthly P&I
- —
- Monthly cashflow
- —
- DSCR
- —
- Eligible?
- —
Personal DTI + credit; lowest rate.
DSCR
20% down · 8.5% · 30yr
- Down + closing
- —
- Monthly P&I
- —
- Monthly cashflow
- —
- DSCR
- —
- Eligible?
- —
No personal income docs; deal must DSCR.
Hard money
10% down · 12.0% · 12mo
- Down + closing
- —
- Monthly P&I
- —
- Monthly cashflow
- —
- DSCR
- —
- Eligible?
- —
Short-term bridge; refi at stabilization.
Rent comps 3 comps
| Address | Beds | Baths | Sqft | Rent | $/sqft | DOM | Units | Dist |
|---|---|---|---|---|---|---|---|---|
| 6 Post Rd Apt E Aberdeen, MD | 1.0 | 1.0 | 900 | $1,300 | $1.44 | 20d | 1 | 1.48mi |
| 27 E Bel Air Ave Unit 1 Aberdeen, MD | 3.0 | 1.0 | 923 | $1,750 | $1.90 | 43d | 1 | 1.50mi |
| 27 E Bel Air Ave Apt 2 Aberdeen, MD | 3.0 | 1.0 | 944 | $1,550 | $1.64 | 43d | 1 | 1.50mi |
Listing history 9 events
-
2026-06-09days on market $55,000 Active 13 DOM
-
2026-06-08days on market $55,000 Active 12 DOM
-
2026-06-07days on market $55,000 Active 11 DOM
-
2026-06-04days on market $55,000 Active 8 DOM
-
2026-06-03days on market $55,000 Active 7 DOM
-
2026-06-02days on market $55,000 Active 6 DOM
-
2026-06-01days on market $55,000 Active 5 DOM
-
2026-05-31days on market $55,000 Active 4 DOM
-
2026-05-27$55,000 Active
ⓘ Source: listings_history table (triggers on properties + properties_extension) + one-shot
backfill from property_details.listing_events for pre-trigger history.
Nearby sold comps map
Loading sold comps map…
Walkable amenities ~0.75 mi
Loading nearby amenities…
Taxation est. · year 1
- Rental income
- $19,119
- − Mortgage interest
- −$3,081
- − Property taxes
- −$825
- − Insurance
- −$275
- − Repairs & maintenance
- −$1,529
- − Management
- −$1,529
- − Depreciation
- −$1,600
- Taxable income
- $10,279
- Est. tax owed @ 24.0%
- −$2,467
- After-tax cash flow
- $8,076/yr
For passive investors: Depreciation is non-cash, so a rental often shows a tax loss while cash-flowing — sheltering income. Rental losses are passive: they offset passive income freely, and up to $25,000/yr can offset ordinary (W-2) income if you actively participate and your MAGI is under $100k (phasing out to $0 by $150k); unused losses carry forward. On sale, claimed depreciation is recaptured at up to 25%, and gains may owe capital-gains tax (a 1031 exchange can defer both). Figures are a year-1 estimate at your 24.0% rate — not tax advice; consult a CPA.
Condition & rehab AI · 12 photos
This 2018 manufactured home in Swan Harbour Dell is in good condition with fresh paint and carpet. It offers a spacious front porch and serene creek view. Minor updates like painting and replacing carpet can significantly increase its value.
Value-add opportunities
- Both Paint exterior — Fresh paint enhances curb appeal and value
- Both Replace carpet — Carpet can be replaced with hardwood or tile for a modern look
- Both Replace ceiling fans — Ceiling fans can be replaced with energy-efficient LED lights
Renovation cost estimate screening
Value-add ROI direction
- Both Paint exterior — Fresh paint enhances curb appeal and value ↑
- Both Replace carpet — Carpet can be replaced with hardwood or tile for a modern look ↑
- Both Replace ceiling fans — Ceiling fans can be replaced with energy-efficient LED lights ↑
ⓘ Cost ranges are severity-bucket heuristics (US national rule-of-thumb). Get contractor quotes + a written scope before underwriting a rehab budget.
Schools (NCES district)
- District
- Harford County Public Schools
- NCES district ID
- 2400390
- Math proficiency
- 22% ▼ -23.00%
- Reading proficiency
- 39% ▼ -12.00%
- Median HH income
- $79,569
- Composite
- 29.38/100
- National rank
- #6527
- State rank
- #9 of 24 in MD
Livability — Aberdeen
- Score
- 81/100
- State rank
- #42
- US rank
- #1545
Category grades
Schools grade is shown separately in the Schools card above.
Census & demographics
- County
- Harford County · 198,512 people
- City population
- 27,168
- Metro
- Baltimore-Columbia-Towson, MD
- Population (ZIP)
- 20,030
- Household income
- $106,667
- Rent vs Own
- Severe rent burden
- 327.0
Population outlook (Harford County) Hauer SSP2
- Today (2025)
- 262,292 people
- By 2030
- 266,437 · +1.6%
- By 2040
- 269,954 · +2.9%
- By 2050
- 265,659 · +1.3%
- By 2075
- 252,886 · -3.6%
- By 2100
- 224,014 · -14.6%
Race, ethnicity, and origin ACS 2023
- Neighborhood character
- Predominantly White (75%)
- Race & ethnicity
- White 75% Black 12% Two or more races 7% Hispanic / Latino 5% Asian 3%
- Hispanic origin (detail)
- Mexican 2%
- Common ancestry
- Romanian 5% Slovak 3% Lithuanian 3%
- Foreign-born
- 6% · Canada
- Languages at home
- 95% English-only · Spanish 2% Tagalog/Filipino 1% German/W. Germanic 1%
Political lean MEDSL · Harford
- 2024 margin
- R (+13.8) · D 41.9% · R 55.7% · Other 2.4%
- 2008→2024 swing
- +5.0pp toward D · 2008: -18.8pp · 2024: -13.8pp
- All cycles
- 2024: R+13.8 2020: R+12.0 2016: R+24.5 2012: R+19.5 2008: R+18.8
Not yet ingested
- Civics
- —
Market trends
- HPI YoY
- ▼ -119.95%
- Current HPI
- 239.1951
- Rent YoY
- —
- Metro
- Baltimore-Columbia-Towson, MD
- State GDP YoY
- ▲ 2.97%
- F500 in state
- 12
Industry mix (Fortune 500 HQ in MD)
| Industry | F500 HQs | Revenue |
|---|---|---|
| Aerospace / Defense | 1 | $71B |
|
||
| Utilities | 1 | $25B |
|
||
| Hotels | 1 | $24B |
|
||
| Consumer Goods | 1 | $7B |
|
||
| Real Estate | 1 | $6B |
|
||
| Chemicals | 1 | $2B |
|
||
Price history
1 event — show timeline
- 2026-05-27 Listed $55,000 BRIGHT MLS
Cash-flow waterfall
monthlySold comps — $/sqft
last 12 mo · ≤1 miLoading sold comps…