215 E 81st St Unit 5E · New York, NY
Flood risk 1/10 · Minimal
- FEMA flood zone
- X (unshaded)
- Chance of flooding over 30 yrs
- 0.0%
- Est. flood insurance / yr
- $507 – $1,088
Fire risk 1/10 · Minimal
- Est. fire insurance / yr
- $691 – $1,283
Heat risk 6/10 · Moderate
- Hot days now (above 99°F)
- 7 days/yr
- Hot days in 30 yrs
- 15 days/yr
Wind risk 6/10 · Moderate
- Chance of severe wind over 30 yrs
- 27.0%
Air-quality risk 4/10 · Minor
- Unhealthy air days now
- 5 days/yr
- Unhealthy air days in 30 yrs
- 6 days/yr
Risk factors via First Street. Map © Google.
Why this score? — see what drove the D grade
The composite is a weighted blend of 9 inputs, each scored 0–100. Each bar is that input's sub-score; the figure is the points it added to the 100-point composite (weight × sub-score).
- Appreciation +10.0/10.0
- ARV discount +7.5/15.0
- Cash flow +5.5/30.0
- Schools +5.0/10.0
- Rent growth +4.0/5.0
- Livability +3.8/5.0
- Condition / age +2.5/5.0
- 1% rule +2.2/10.0
- DSCR +0.0/10.0
$750,000
🖨 Deal sheet 📄 Offer letter ✓ Due diligence
Listing remarks
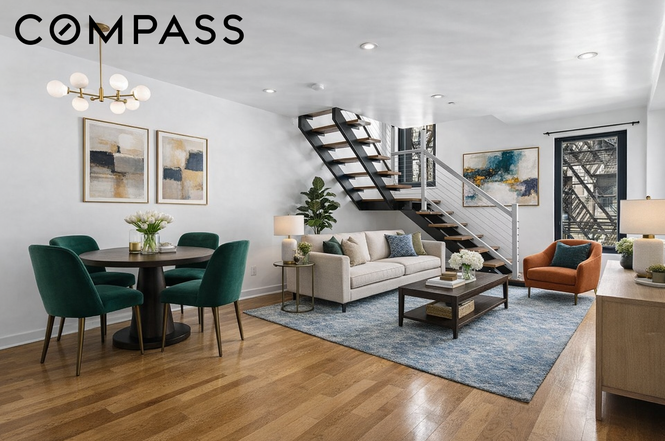
* * Some Photos virtually staged Residence 5E at 215 East 81st Street is a spacious one-bedroom duplex (amongst the largest 1br in the building) offering a functional sense of scale within a full-service Upper East Side condominium. At approximately 742 square feet, the home stands among the larger one-bedroom layouts in the building, with a thoughtful separation between living and private spaces. The lower level is dedicated to living and entertaining, with an open layout that comfortably accommodates both seating and dining. Two Juliet balconies bring in natural light and add an element of openness, while recessed lighting and double-pane windows support a quiet, comfortable environment
Key facts
- Spacious duplex
- Open layout
- Two juliet balconies
Tags
Property features AI
Finance
- HOA & community: Monthly association fee of $923; Building amenities include elevator(s) and recreation room
Exterior
- Security: Concierge
- Home design: Condo unit in an 8-story building; Entry level: 5
- Construction: Building name: The Duplex Condos
- Exterior features: Juliet balcony; Private outdoor space (under 60 sqft); Patio; Terrace; North exposures
Interior
- Kitchen: Dishwasher; Refrigerator; Stainless steel appliances
- Bedrooms: 2 total rooms (includes bedrooms and living areas)
- Bathrooms: 1 full bathroom; 1 half bathroom
- Interior features: Unfurnished; Recessed lighting
- Laundry & utility: Common laundry on the floor / in common area
Neighborhood map
What this means for you Summary
Snapshot
- This is a 1-bed/1.5-bath condo listed at $750k.
Deal economics
- At list price, monthly cash flow is $-2k ($-19k/yr) — negative.
- To cash-flow at today's rent, offer at most $465k (37.9% below list).
- To meet the 1% rule (rent ≥ 1% of price), the offer needs to be $542k (27.8% below list).
- Recommended offer: $465k (37.9% below list) — sets the bar for cash-flow.
- Cap rate 3.7% vs local median 2.6% in New York — top-decile yield for the area; either an underpriced asset or a hidden risk that comps aren't pricing in. Stress-test before assuming the spread holds.
Location & tenants
- Location reads 75/100 on livability (#268 in NY, #4,188 nationally) — a middle-class / working-renter tenant base. Strengths: amenities A+, commute A+, health & safety A; Watch: crime F, cost of living F.
- Market conditions: Rents rising fast (+6.2%/yr); 276 active listings in the ZIP; 40 comparable units currently listed for rent nearby; rentals leasing fast (median 8d on market — plan ~1-2 weeks tenant-placement turnaround); high-income renter base; 4,467 units permitted in New York County in 2024 (4,463 in 5+ unit buildings).
- This rent runs 37% of the median local income ($175k/yr) — at the standard rent-burdened threshold; future hikes will face affordability resistance.
Forward outlook
- In year one you build about $80k of equity ($5k loan paydown + $75k appreciation (10.0% local appreciation)).
- New York County population projected at +21% by 2050 — long-run rental-demand tailwind backs the buy-and-hold thesis.
- By year 2, paydown + projected appreciation supports a ~$129k cash-out refi (75% LTV) — recoverable capital for the next deal without selling this one.
Negotiation context
- Only 7 days on market — expect competitive offers; lowballing is unlikely to land.
- 8 sale attempts since 10y ago with the ask held roughly flat each time — persistent listings suggest the price (not the market) is what's stuck; bring a comps-based counter.
Risks & watch-outs
- Climate carrying-cost: major wind risk, 27% chance of damaging wind over 30y; extreme-heat days projected 7→15/yr by 2055 (HVAC capex compounding) — expect insurance premiums to compound above CPI over the hold.
Questions for the listing agent
- What do current leases actually rent for vs. the listed asking? Can we see a recent rent roll and the last 12 months of T-12 income?
- Built in 1974 — when were the roof, HVAC, electrical panel, plumbing, and water heater last replaced?
- What does the HOA fee cover, when was the last increase, and are there any pending special assessments or reserve-fund shortfalls?
- Any open or pending special assessments — roof, HVAC, plumbing, elevator, façade? What's the per-unit balance and payoff schedule, and is the seller paying it off at close or rolling it to the buyer?
- Is there a deadline driving the sale (1031 exchange, divorce, estate, relocation)? That informs how much negotiation room exists.
- Schools are B-rated — typically a magnet for longer-tenancy family renters. What's the average tenant stay here, and is there a school-zone premium baked into asking?
- Crime grade is F in this area — have there been break-ins, vandalism, or insurance claims at this property in the last 3 years? What carrier currently insures it and at what premium?
- The area grade is low — what's the realistic commute time and amenity access for the typical tenant pool here? Any planned neighborhood developments (good or bad) we should know about?
- What's the average days-on-market for RENTAL listings here right now (not sales)? A rising rental-DOM trend means longer vacancies and softer asking-rent achievability than the comps imply.
- What's the recent tenant-quality profile in this submarket — average credit score on applications, eviction rate, late-payment / NSF rate, and stable-employment percentage? A property-management company in the area should have these aggregated.
- How much new apartment / multifamily construction is in the pipeline within 1–3 miles? Heavy new supply (>2% of stock underway) typically softens rents 12–24 months out; light construction supports rent growth.
Investment metrics
- 1% rule
- 0.72% ✗
- Cap rate
- 3.72%
- Cash-on-cash
- -9.21%
- DSCR
- 0.59
- GRM
- 11.5
CMA / ARV
No comps found within radius.
Projected returns pro-forma
10.0% appreciation · 6.16% rent growth · sell at horizon
- IRR
- 18.8%
- Equity multiple
- 2.54×
- Total profit
- $324,155
- Equity at exit
- $675,659
- IRR
- 18.1%
- Equity multiple
- 6.13×
- Total profit
- $1,077,245
- Equity at exit
- $1,457,085
Cash invested: $210,000 (down + closing). Projections, not guarantees.
Landlord ↔ Tenant lean methodology
- Overall (CITY)
- 0 Strongly Tenant-Friendly
- State New York
- 15 Strongly Tenant-Friendly · D+10
- County
- — inherits STATE
- City New York
- 0 Strongly Tenant-Friendly · D+34
ZIP-level market 10028
- Home prices YoY
- 3.7%
- Rents YoY
- 6.2%
- Active inventory
- 276
- Price-to-rent
- 11.5×
Monthly cashflow live
- Estimated rent
- $5,417 high interval (Pro) →
- Mortgage (P&I)
- −$3,933
- Tax from tax record
- −$722 /mo · $8,661/yr
- Insurance
- −$312
- HOA
- −$923
- Vacancy / Maint / Mgmt
- −$1,138
- Net cashflow
- $-1,611
Break-even live
UW: 25.0% down · 7.5% · 30yr · 1.5% tax · 5.0% vac · 8.0% maint · 8.0% mgmt
Financing live
Cash to close
- Down payment
- $187,500
- Closing costs
- $22,500
- Reserves months
- —
- Total cash needed
- —
Loan-product check · same deal, 3 products live
Conventional
25% down · 7.5% · 30yr
- Down + closing
- —
- Monthly P&I
- —
- Monthly cashflow
- —
- DSCR
- —
- Eligible?
- —
Personal DTI + credit; lowest rate.
DSCR
20% down · 8.5% · 30yr
- Down + closing
- —
- Monthly P&I
- —
- Monthly cashflow
- —
- DSCR
- —
- Eligible?
- —
No personal income docs; deal must DSCR.
Hard money
10% down · 12.0% · 12mo
- Down + closing
- —
- Monthly P&I
- —
- Monthly cashflow
- —
- DSCR
- —
- Eligible?
- —
Short-term bridge; refi at stabilization.
Rent comps 40 comps
| Address | Beds | Baths | Sqft | Rent | $/sqft | DOM | Units | Dist |
|---|---|---|---|---|---|---|---|---|
| 200 E 82nd St #505 New York, NY | 2.0 | 1.0 | 636 | $6,715 | $10.55 | 1d | 3 | 0.07mi |
| 301 E 79th St Unit 28P New York, NY | 1.0 | 1.0 | 700 | $5,500 | $7.86 | 24d | 1 | 0.12mi |
| 315 E 78th St Unit 1021894P New York, NY | 1.0 | 1.0 | 548 | $5,643 | $10.30 | 22d | 1 | 0.18mi |
| 315 E 78th St Unit 1021994P New York, NY | 1.0 | 1.0 | 441 | $5,037 | $11.42 | 20d | 1 | 0.18mi |
| 315 E 78th St Unit 1021847P New York, NY | 1.0 | 1.0 | 516 | $4,880 | $9.46 | 20d | 1 | 0.18mi |
| 308 E 78th St #2024 New York, NY | 1.0–2.0 | 1.0 | 550 | $4,610 | $8.38 | 24d | 2 | 0.19mi |
| 347 E 78th St Unit 1460467P New York, NY | 2.0 | 1.0 | 645 | $7,606 | $11.79 | 24d | 1 | 0.21mi |
| 347 E 78th St Unit 1530420P New York, NY | 2.0 | 1.0 | 645 | $6,270 | $9.72 | 22d | 1 | 0.21mi |
| 231 E 76th St #1530 New York, NY | 1.0 | 1.0 | 650 | $6,470 | $9.95 | 20d | 1 | 0.24mi |
| 244 E 86th St #604 New York, NY | 1.0–2.0 | 1.0–2.0 | 950 | $4,920 | $5.18 | 3d | 2 | 0.25mi |
| 420 E 80th St #198 New York, NY | 1.0 | 1.0 | 623 | $4,760 | $7.64 | 18d | 1 | 0.28mi |
| 201 E 86th St #298 New York, NY | 1.0–2.0 | 1.0–1.5 | 700 | $7,210 | $10.30 | 3d | 2 | 0.29mi |
| 315 E 86th St Unit 1327 New York, NY | 1.0 | 2.0 | 726 | $6,460 | $8.90 | 24d | 1 | 0.30mi |
| 240e E 75th St Unit 1021876P New York, NY | — | 1.0 | 441 | $5,981 | $13.56 | 7d | 1 | 0.31mi |
| 240e E 75th St Unit 1021873P New York, NY | — | 1.0 | 441 | $5,227 | $11.85 | 5d | 1 | 0.31mi |
| 1567 York Ave Unit 1021866P New York, NY | 2.0 | 1.0 | 742 | $5,910 | $7.96 | 22d | 1 | 0.33mi |
| 501 1/2 E 83rd St #1998 New York, NY | 2.0 | 1.0 | 525 | $4,710 | $8.97 | 24d | 2 | 0.37mi |
| 160 E 88th St #1332 New York, NY | 1.0 | 1.0 | 560 | $5,670 | $10.12 | 6d | 1 | 0.38mi |
| 200 E 89th St Unit 12G New York, NY | 1.0 | 1.0 | 650 | $5,000 | $7.69 | 18d | 1 | 0.40mi |
| 1373 1st Ave Unit 1952 New York, NY | 2.0 | 2.0 | 650 | $7,260 | $11.17 | 24d | 1 | 0.41mi |
| 235 E 89th St Unit 1495783P New York, NY | 2.0 | 1.0 | 699 | $7,443 | $10.65 | 20d | 1 | 0.42mi |
| 1001 5th Ave Unit 3 New York, NY | 1.0 | 1.0 | 450 | $5,400 | $12.00 | 24d | 1 | 0.45mi |
| 515 E 86th St Unit 589 New York, NY | 1.0 | 1.0 | 695 | $6,070 | $8.73 | 20d | 1 | 0.46mi |
| 515 E 86th St Unit 1760 New York, NY | 1.0 | 1.0 | 485 | $5,420 | $11.18 | 3d | 1 | 0.46mi |
| 501 E 87th St #2094 New York, NY | 1.0 | 1.0 | 618 | $7,890 | $12.77 | 1d | 2 | 0.48mi |
| 952 5th Ave #998 New York, NY | 1.0–2.0 | 1.0 | 800 | $6,740 | $8.43 | 1d | 2 | 0.51mi |
| 7 E 75th St #1615 New York, NY | 1.0–3.0 | 1.0–2.0 | 656 | $4,850 | $7.39 | 3d | 3 | 0.51mi |
| 354 E 91st St #648 New York, NY | 1.0–2.0 | 1.0 | 692 | $5,600 | $8.09 | 1d | 2 | 0.53mi |
| 515 E 72nd St Unit 17D New York, NY | 1.0 | 1.0 | 687 | $5,500 | $8.01 | 24d | 1 | 0.59mi |
| 1310 2nd Ave Unit 1224958P New York, NY | 1.0–2.0 | 1.0 | 699 | $5,450 | $7.80 | 1d | 2 | 0.62mi |
| 1290 1st Ave #1499 New York, NY | 2.0 | 1.0 | 671 | $6,100 | $9.09 | 2d | 2 | 0.63mi |
| 403 E 69th St #1518 New York, NY | 1.0–3.0 | 1.0 | 745 | $3,990 | $5.36 | 24d | 3 | 0.64mi |
| 345 E 94th St #1470 New York, NY | 2.0 | 1.0–2.0 | 710 | $5,645 | $7.95 | 3d | 3 | 0.69mi |
| 888 Main St New York, NY | 1.0–3.0 | 1.0–2.0 | 963 | $4,431 | $4.60 | 6d | 7 | 0.72mi |
| 215 E 95th St #1293 New York, NY | 1.0–2.0 | 1.0–1.5 | 740 | $5,520 | $7.46 | 1d | 2 | 0.73mi |
| 215 E 96th St Unit 688 New York, NY | 1.0 | 1.0 | 717 | $7,960 | $11.10 | 3d | 1 | 0.78mi |
| 175 E 96th St Unit 1251683P New York, NY | 2.0 | 1.0 | 600 | $5,305 | $8.84 | 2d | 2 | 0.78mi |
| 400 E 66th St Unit 1016404P New York, NY | 1.0–2.0 | 1.0–2.0 | 791 | $10,597 | $13.40 | 3d | 2 | 0.81mi |
| 1501 Lexington Ave #932 New York, NY | 1.0 | 1.0 | 583 | $5,580 | $9.56 | 3d | 2 | 0.82mi |
| 220 E 65th St New York, NY | 1.0 | 1.0 | 700 | $5,950 | $8.50 | 2d | 1 | 0.84mi |
HOA detail condo
- Monthly dues
- $923 · $11,076/yr
- Assessments
- None detected in remarks — confirm with the listing agent.
Listing history 6 events
-
2026-06-18days on market $750,000 Active 7 DOM
-
2026-06-17days on market $750,000 Active 6 DOM
-
2026-06-16days on market $750,000 Active 5 DOM
-
2026-06-15days on market $750,000 Active 4 DOM
-
2026-06-13remarks 699-char remark
-
2026-06-13$750,000 Active 2 DOM
ⓘ Source: listings_history table (triggers on properties + properties_extension) + one-shot
backfill from property_details.listing_events for pre-trigger history.
Tax reassessment forecast NY · Partial reset (capped growth)
- Current annual tax
- $8,661 · $722/mo
- Projected year-2 tax
- $10,668 · $889/mo
- Expected delta
- +$2,007/yr (+$167/mo · 23.2%)
ⓘ Screening estimate from a state-policy table — verify with the county assessor before closing.
Climate risk First Street
- Flood 1/10 Low FEMA zone X (unshaded) · 0% chance over 30 yrs
- Wildfire 1/10 Low
- Heat 6/10 Major 7 d/yr ≥99°F today · 15 d/yr by 30 yrs out
- Wind 6/10 Major 27% chance of damaging wind over 30 yrs
- Air quality 4/10 Moderate 5 unhealthy d/yr today · 6 by 30 yrs out
Nearby sold comps map
Loading sold comps map…
Walkable amenities ~0.75 mi
Loading nearby amenities…
Taxation est. · year 1
- Rental income
- $65,003
- − Mortgage interest
- −$42,012
- − Property taxes
- −$8,661
- − Insurance
- −$3,750
- − Repairs & maintenance
- −$5,200
- − Management
- −$5,200
- − HOA
- −$11,076
- − Depreciation
- −$21,818
- Taxable loss
- −$32,714
- Est. tax savings @ 24.0%
- +$7,851
- After-tax cash flow
- $-11,480/yr
For passive investors: Depreciation is non-cash, so a rental often shows a tax loss while cash-flowing — sheltering income. Rental losses are passive: they offset passive income freely, and up to $25,000/yr can offset ordinary (W-2) income if you actively participate and your MAGI is under $100k (phasing out to $0 by $150k); unused losses carry forward. On sale, claimed depreciation is recaptured at up to 25%, and gains may owe capital-gains tax (a 1031 exchange can defer both). Figures are a year-1 estimate at your 24.0% rate — not tax advice; consult a CPA.
Schools (NCES district)
No district data.
Livability — New York
- Score
- 75/100
- State rank
- #268
- US rank
- #4188
Category grades
Schools grade is shown separately in the Schools card above.
Census & demographics
- Census place
- New York, NY
- County
- New York County · 1,599,927 people
- City population
- 7,731,280
- Metro
- New York-Newark-Jersey City, NY-NJ-PA
- Population (ZIP)
- 49,077
- Household income
- $175,121
- Rent vs Own
- Severe rent burden
- 3381.0
Population outlook (New York County) Hauer SSP2
- Today (2025)
- 1,825,725 people
- By 2030
- 1,904,611 · +4.3%
- By 2040
- 2,052,719 · +12.4%
- By 2050
- 2,206,601 · +20.9%
- By 2075
- 2,509,427 · +37.4%
- By 2100
- 2,702,933 · +48.0%
Race, ethnicity, and origin ACS 2023
- Neighborhood character
- Predominantly White (82%)
- Race & ethnicity
- White 82% Asian 7% Hispanic / Latino 6% Two or more races 5% Black 2%
- Hispanic origin (detail)
- Mexican 1% Puerto Rican 2%
- Common ancestry
- Scotch-Irish 7% Romanian 6% Italian 5%
- Foreign-born
- 16% · Canada, China, Jamaica
- Languages at home
- 81% English-only · Other Indo-European 6% Spanish 4% French/Haitian/Cajun 2%
Political lean MEDSL · New York
- 2024 margin
- Solid D (+64.8) · D 82.4% · R 17.6%
- 2008→2024 swing
- -7.4pp toward R · 2008: 72.2pp · 2024: 64.8pp
- All cycles
- 2024: D+64.8 2020: D+74.5 2016: D+77.2 2012: D+69.6 2008: D+72.2
Not yet ingested
- Civics
- —
Market trends
- HPI YoY
- ▲ 12.13%
- Current HPI
- 341.1676
- Rent YoY
- ▲ 6.16%
- Metro
- New York-Newark-Jersey City, NY-NJ-PA
- State GDP YoY
- ▲ 2.60%
- F500 in state
- 92
Industry mix (Fortune 500 HQ in NY)
| Industry | F500 HQs | Revenue |
|---|---|---|
| Financial Services | 10 | $950B |
|
||
| Consumer Goods | 9 | $162B |
|
||
| Insurance | 4 | $225B |
|
||
| Telecommunications | 2 | $144B |
|
||
| Pharmaceuticals | 2 | $112B |
|
||
| Media / Entertainment | 2 | $69B |
|
||
Price history
+7.3% since first listed14 events — show timeline
- 2026-04-19 Listed $750,000 RLS at REBNY
- 2018-07-11 Sold (Public Records) $700,000 Public Records
- 2018-06-29 Price Changed $700,000 RLS at REBNY
- 2018-02-16 Price Changed $750,000 RLS at REBNY
- 2017-12-27 Price Changed $775,000 RLS at REBNY
- 2017-11-16 Listed $750,000 RLS at REBNY
- 2017-11-16 Listed $799,000 RLS at REBNY
- 2017-11-16 Listed $700,000 RLS at REBNY
- 2017-11-16 Listed $700,000 RLS at REBNY
- 2017-11-16 Listed $740,000 RLS at REBNY
- 2016-11-16 Price Changed $779,000 RLS at REBNY
- 2016-05-06 Listed $610,000 RLS at REBNY
- 2016-05-06 Listed $700,000 RLS at REBNY
- 2009-12-09 Sold (Public Records) $699,000 Public Records
Property tax history
+1.7%/yrLatest (2025): $8,661 · -27.2% YoY. Source: county tax records.
Cash-flow waterfall
monthlySold comps — $/sqft
last 12 mo · ≤1 miLoading sold comps…