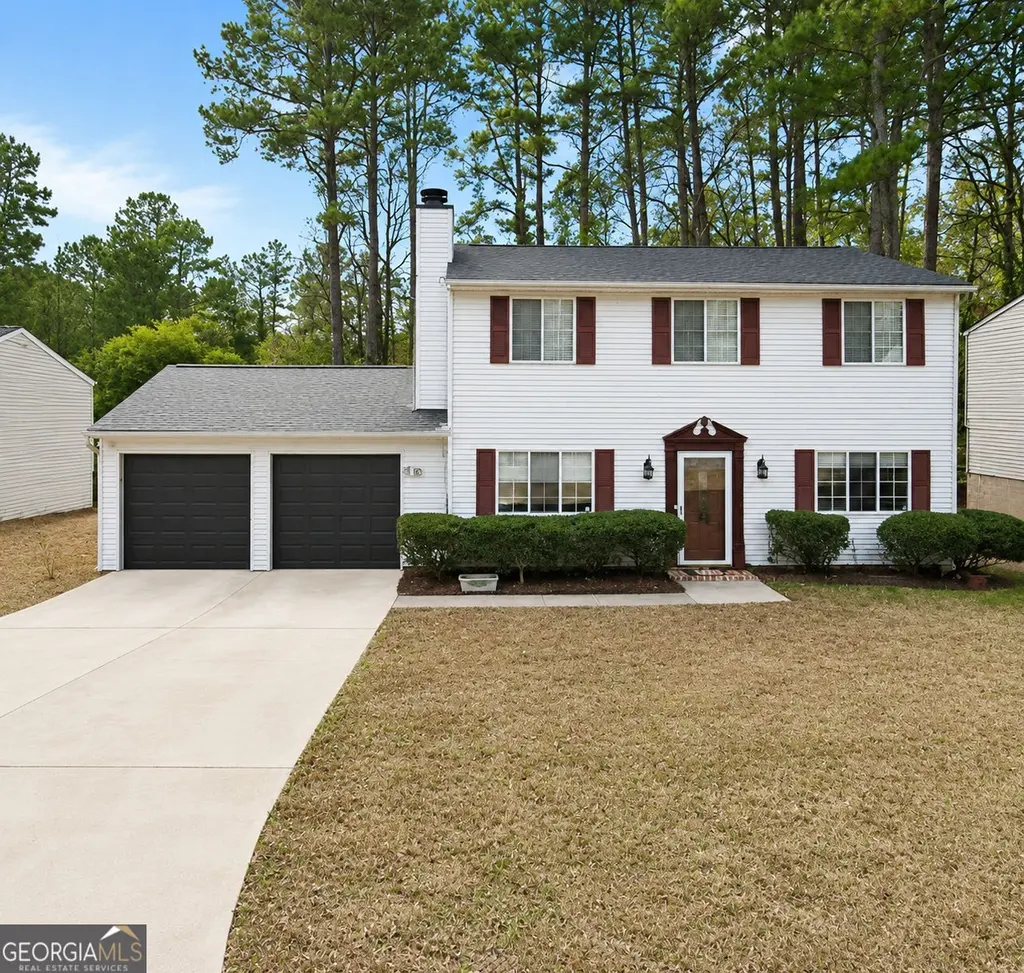
4759 White Oak Trl · Redan, GA
Flood risk 1/10 · Minimal
- FEMA flood zone
- X (unshaded)
- Chance of flooding over 30 yrs
- 0.0%
- Est. flood insurance / yr
- $507 – $1,088
Fire risk 1/10 · Minimal
- Est. fire insurance / yr
- $963 – $1,789
Heat risk 5/10 · Moderate
- Hot days now (above 104°F)
- 7 days/yr
- Hot days in 30 yrs
- 18 days/yr
Wind risk 6/10 · Moderate
- Chance of severe wind over 30 yrs
- 27.0%
Air-quality risk 6/10 · Moderate
- Unhealthy air days now
- 8 days/yr
- Unhealthy air days in 30 yrs
- 11 days/yr
Risk factors via First Street. Map © Google.
Why this score? — see what drove the D grade
The composite is a weighted blend of 9 inputs, each scored 0–100. Each bar is that input's sub-score; the figure is the points it added to the 100-point composite (weight × sub-score).
- Cash flow +16.3/30.0
- ARV discount +8.7/15.0
- DSCR +5.0/10.0
- Rent growth +3.4/5.0
- 1% rule +3.2/10.0
- Livability +3.2/5.0
- Condition / age +2.5/5.0
- Schools +2.1/10.0
- Appreciation +0.0/10.0
$230,000
🖨 Deal sheet (PDF) 📄 Offer letter ✓ Due diligence
Listing remarks MLS
Welcome home to 4759 White Oak Trail in Stone Mountain! This spacious 3-bedroom, 2.5-bath traditional home offers approximately 1,920 square feet of comfortable living space with a functional layout perfect for everyday living and entertaining. Built in 1983, this home features a versatile bonus room ideal for a home office, playroom, media room, or flex space to fit your needs. Recent improvements include a brand-new roof installed in 2025, along with minor upgrades to the bathrooms and updated flooring, offering a great blend of charm and modern touches. The home provides generous living space, a welcoming exterior, and endless potential for a buyer looking to personalize and make it their own. Conveniently located in Stone Mountain with easy access to shopping, dining, schools, parks, and major highways. Don't miss this opportunity to own a well-maintained home with valuable updates in an established neighborhood. Schedule your showing today!
Key facts
- Bonus room
- Updated flooring
- New roof
Tags
Property features AI
Exterior
- Parking: Garage parking (2 spaces total)
- Utilities: Public water; Public sewer; 220 volts electric; Cable available; Electricity available; Natural gas available; Phone available; Underground utilities
- Home design: Two levels; Resale property
- Construction: Frame and other construction materials; Composition roof; Combination and slab foundation; Built as existing (resale)
- Exterior features: Patio; Other exterior features
Interior
- Kitchen: Eat-in kitchen; Dishwasher; Disposal; Gas cooktop; Refrigerator
- Bedrooms: Three upper-level bedrooms; Bedroom features: Other
- Flooring: Carpet; Wood; Hardwood
- Bathrooms: Two full bathrooms; One half bathroom; Master bath with double vanity and shower only
- Heating & cooling: Central heating; Central air
- Interior features: One fireplace with gas log and gas starter; fire pit and family room access; Insulated windows; No common walls; Other interior features
- Laundry & utility: Electric dryer hookup; Other laundry features
Neighborhood map
What this means for you Summary
Snapshot
- This is a 3-bed/2.5-bath single-family listed at $230k.
Deal economics
- At list price, monthly cash flow is $125 ($1k/yr) — positive.
- The deal already cash-flows at list — no discount required.
- To meet the 1% rule (rent ≥ 1% of price), the offer needs to be $188k (18.2% below list).
- Recommended offer: $188k (18.2% below list) — sets the bar for 1% rule.
- Cap rate 6.9% vs local median 5.3% in Redan — top-decile yield for the area; either an underpriced asset or a hidden risk that comps aren't pricing in. Stress-test before assuming the spread holds.
Location & tenants
- Location reads 64/100 on livability (#274 in GA) — a middle-class / working-renter tenant base. Strengths: cost of living A+, housing A+; Watch: crime D, amenities F, commute F.
- Dekalb County (suburban): math 19% / reading 28% proficiency, ranked #125 of 174 in GA (top 72%) — low school quality limits family demand, transient renter base, plan for 1-2y turnover; 68% free/reduced lunch — lower-income household profile, screen leases tightly.
- Zoned schools: Woodridge Elementary School (math 8% / reading 12%, grade F, #1,092 of 1,228 statewide, top 91%, 475 students, 97% FRL); Miller Grove Middle School (math 8% / reading 18%, grade F, #410 of 470 statewide, top 87%, 722 students, 100% FRL); Miller Grove High School (math 5% / reading 5%, grade F, #394 of 424 statewide, top 97%, 1,188 students, 100% FRL) — zoned schools average 99% FRL vs 68% district-wide (32 pts higher); higher-poverty schools than district average — tighter screening recommended.
- Zoned-school proficiency averages 9% at this address vs 24% district-wide (-14 pts) — the specific schools serving this property underperform the Dekalb County average; the district grade overstates school quality for this exact location.
- Market conditions: Rents rising (+3.7%/yr); 220 active listings in the ZIP; 37 comparable units currently listed for rent nearby; rentals at typical pace (median 15d on market — plan ~3-4 weeks tenant-placement turnaround); 1,240 units permitted in DeKalb County in 2024 (385 in 5+ unit buildings).
- This rent runs 32% of the median local income ($70k/yr) — at the standard rent-burdened threshold; future hikes will face affordability resistance.
Forward outlook
- Local home prices are declining (-3.0%/yr); year-one equity from $2k of loan paydown is wiped out by about $7k of value loss. Plan a longer hold.
- DeKalb County population projected at +28% by 2050 — long-run rental-demand tailwind backs the buy-and-hold thesis.
Negotiation context
- Only 9 days on market — expect competitive offers; lowballing is unlikely to land.
- 2 sale attempts with the ask held roughly flat each time — persistent listings suggest the price (not the market) is what's stuck; bring a comps-based counter.
- Current owner paid $68k; list at $230k implies a 237% gain — meaningful room to come down on a strong offer.
Risks & watch-outs
- Climate carrying-cost: major wind risk, 27% chance of damaging wind over 30y; extreme-heat days projected 7→18/yr by 2055 (HVAC capex compounding) — expect insurance premiums to compound above CPI over the hold.
Questions for the listing agent
- Is there a deadline driving the sale (1031 exchange, divorce, estate, relocation)? That informs how much negotiation room exists.
- Schools are B-rated — typically a magnet for longer-tenancy family renters. What's the average tenant stay here, and is there a school-zone premium baked into asking?
- Crime grade is D in this area — have there been break-ins, vandalism, or insurance claims at this property in the last 3 years? What carrier currently insures it and at what premium?
- The area grade is low — what's the realistic commute time and amenity access for the typical tenant pool here? Any planned neighborhood developments (good or bad) we should know about?
- What's the average days-on-market for RENTAL listings here right now (not sales)? A rising rental-DOM trend means longer vacancies and softer asking-rent achievability than the comps imply.
- What's the recent tenant-quality profile in this submarket — average credit score on applications, eviction rate, late-payment / NSF rate, and stable-employment percentage? A property-management company in the area should have these aggregated.
- How much new for-sale + rental construction is in the pipeline within 1–3 miles? Heavy new supply typically softens prices + rents 12–24 months out; constrained supply supports both.
Investment metrics
- 1% rule
- 0.82% ✗
- Cap rate
- 6.94%
- Cash-on-cash
- 2.32%
- DSCR
- 1.10
- GRM
- 10.2
CMA / ARV
- ARV (on-the-fly)
- $236,160
- Comps found
- 12
Show comp detail 12 sales within ~0.75 mi
| Address | Dist | Beds/Ba | Sqft | Sold | Price | $/sf | Match |
|---|---|---|---|---|---|---|---|
| 4828 White Oak Tree | 0.17mi | 3/2.0 | 1,757 (-8%) | 4mo | $160,000 | $91 | 73 |
| 4436 Cypress Ridge Ln | 0.66mi | 3/2.0 | 1,928 (+0%) | 2mo | $162,000 | $84 | 65 |
| 4859 Terrace Green Trce | 0.58mi | 3/2.0 | 1,833 (-4%) | 1mo | $245,000 | $134 | 63 |
| 4541 Mercer Rd | 0.56mi | 4/2.5 (+1) | 2,024 (+5%) | 2mo | $295,500 | $146 | 58 |
| 4641 Wendover Dr | 0.35mi | 4/2.5 (+1) | 2,130 (+11%) | 5mo | $242,500 | $114 | 57 |
| 4670 Wendover Dr | 0.27mi | 4/3.0 (+1) | 2,193 (+14%) | 3mo | $270,000 | $123 | 54 |
| 1373 To Lani Farm Rd | 0.72mi | 3/2.0 | 1,844 (-4%) | 7mo | $174,000 | $94 | 52 |
| 4840 Terrace Green Trce | 0.55mi | 4/3.0 (+1) | 2,142 (+12%) | 1mo | $240,000 | $112 | 47 |
| 1381 To Lani Farm Rd | 0.72mi | 3/2.0 | 1,726 (-10%) | 1mo | $289,000 | $167 | 47 |
| 1556 Linksview Close | 0.54mi | 3/2.5 | 2,190 (+14%) | 6mo | $260,000 | $119 | 46 |
| 4792 Terrace Green Trce | 0.69mi | 3/2.0 | 2,146 (+12%) | 4mo | $345,000 | $161 | 43 |
| 1219 To Lani Dr | 0.71mi | 3/2.5 | 1,670 (-13%) | 5mo | $225,000 | $135 | 41 |
Match score weights: distance 35% · size 25% · config 20% · recency 20%. Top-matched comps best support the ARV.
Projected returns pro-forma
-3.0% appreciation · 3.72% rent growth · sell at horizon
- IRR
- -12.0%
- Equity multiple
- 0.56×
- Total profit
- $-28,068
- Equity at exit
- $34,294
- IRR
- -2.0%
- Equity multiple
- 0.86×
- Total profit
- $-8,956
- Equity at exit
- $19,886
Cash invested: $64,400 (down + closing). Projections, not guarantees.
Landlord ↔ Tenant lean methodology
- Overall (STATE)
- 90 Strongly Landlord-Friendly
- State Georgia
- 90 Strongly Landlord-Friendly · R+3
- County
- — inherits STATE
- City
- — inherits STATE
ZIP-level market 30088
- Rents YoY
- 3.7%
- Active inventory
- 220
- Price-to-rent
- 10.2×
Monthly cashflow live
- Estimated rent
- $1,881 high interval (Pro) →
- Mortgage (P&I)
- −$1,206
- Tax from tax record
- −$59 /mo · $711/yr
- Insurance
- −$96
- HOA
- −$0
- Vacancy / Maint / Mgmt
- −$395
- Net cashflow
- $125
Break-even live
Sensitivity live
| Price | -10% $255 | -5% $190 | +0% $125 | +5% $60 | +10% $-6 |
|---|---|---|---|---|---|
| Rent | -10% $-24 | -5% $50 | +0% $125 | +5% $199 | +10% $273 |
| Rate | -1.0pp $241 | -0.5pp $183 | base $125 | +0.5pp $65 | +1.0pp $4 |
UW: 25.0% down · 7.5% · 30yr · 1.5% tax · 5.0% vac · 8.0% maint · 8.0% mgmt
Financing live
Cash to close
- Down payment
- $57,500
- Closing costs
- $6,900
- Reserves months
- —
- Total cash needed
- —
Loan-product check · same deal, 3 products live
Conventional
25% down · 7.5% · 30yr
- Down + closing
- —
- Monthly P&I
- —
- Monthly cashflow
- —
- DSCR
- —
- Eligible?
- —
Personal DTI + credit; lowest rate.
DSCR
20% down · 8.5% · 30yr
- Down + closing
- —
- Monthly P&I
- —
- Monthly cashflow
- —
- DSCR
- —
- Eligible?
- —
No personal income docs; deal must DSCR.
Hard money
10% down · 12.0% · 12mo
- Down + closing
- —
- Monthly P&I
- —
- Monthly cashflow
- —
- DSCR
- —
- Eligible?
- —
Short-term bridge; refi at stabilization.
Rent comps 37 comps
| Address | Beds | Baths | Sqft | Rent | $/sqft | DOM | Units | Dist |
|---|---|---|---|---|---|---|---|---|
| 1420 S Hairston Rd Stone Mountain, GA | 1.0–2.0 | 1.0–2.5 | 1011 | $1,358 | $1.34 | 21d | 31 | 0.17mi |
| 1576 Canberra Dr Stone Mountain, GA | 3.0 | 2.0 | 1850 | $1,000 | $0.54 | 6d | 1 | 0.32mi |
| 1576 Canberra Dr Stone Mountain, GA | 3.0 | 2.0 | 1850 | $1,900 | $1.03 | 4d | 1 | 0.32mi |
| 4852 Lost Colony Ct Stone Mountain, GA | 4.0 | 3.0 | 1694 | $1,775 | $1.05 | 26d | 1 | 0.32mi |
| 1600 Devon Ct Stone Mountain, GA | 4.0 | 3.0 | 2100 | $2,145 | $1.02 | 26d | 1 | 0.41mi |
| 4169 Cedar Ridge Trl Stone Mountain, GA | 3.0 | 2.0 | 1591 | $1,870 | $1.18 | 7d | 1 | 0.60mi |
| 4073 Cedar Ridge Trl Stone Mountain, GA | 4.0 | 2.5 | 2100 | $1,761 | $0.84 | 45d | 1 | 0.66mi |
| 4935 Millstone Walk Stone Mountain, GA | 3.0 | 2.5 | 1248 | $1,950 | $1.56 | 7d | 1 | 0.66mi |
| 1183 Mill Lake Cir Stone Mountain, GA | 3.0 | 2.0 | 1373 | $1,751 | $1.28 | 7d | 1 | 0.74mi |
| 1373 Mill Lake Cir Stone Mountain, GA | 3.0 | 2.0 | 1296 | $1,738 | $1.34 | 1d | 1 | 0.75mi |
| 1401 Mill Lake Cir Stone Mountain, GA | 3.0 | 2.0 | 1320 | $1,675 | $1.27 | 14d | 1 | 0.75mi |
| 1338 Mill Lake Cir Stone Mountain, GA | 3.0 | 2.0 | 1844 | $1,900 | $1.03 | 3d | 1 | 0.76mi |
| 1299 To Lani Path Stone Mountain, GA | 3.0 | 2.0 | 1507 | $1,675 | $1.11 | 14d | 1 | 0.78mi |
| 1228 Mill Lake Cir Stone Mountain, GA | 3.0 | 2.0 | 1344 | $1,645 | $1.22 | 45d | 1 | 0.80mi |
| 1217 To Lani Path Stone Mountain, GA | 3.0 | 2.5 | 1404 | $1,754 | $1.25 | 3d | 1 | 0.83mi |
| 4939 Clubgreen Smt Stone Mountain, GA | 4.0 | 2.5 | 2156 | $2,139 | $0.99 | 45d | 1 | 0.84mi |
| 5118 Rocky Gln Stone Mountain, GA | 4.0 | 2.0 | 1932 | $2,100 | $1.09 | 45d | 1 | 0.85mi |
| 1406 High Meadow Dr Stone Mountain, GA | 3.0 | 2.0 | 1621 | $1,625 | $1.00 | 14d | 1 | 0.92mi |
| 1406 High Meadow Dr Stone Mountain, GA | 3.0 | 2.0 | 1621 | $900 | $0.56 | 24d | 1 | 0.92mi |
| 1563 Pine Glen Cir Decatur, GA | 3.0 | 2.0 | 1608 | $1,695 | $1.05 | 7d | 1 | 0.98mi |
| 1102 Cherokee Hts Stone Mountain, GA | 4.0 | 2.5 | 1867 | $2,140 | $1.15 | 13d | 1 | 1.02mi |
| 1127 Cherokee Hts Stone Mountain, GA | 4.0 | 3.0 | 2184 | $1,831 | $0.84 | 14d | 1 | 1.02mi |
| 1922 Manhattan Pkwy Decatur, GA | 2.0 | 2.5 | 1814 | $2,000 | $1.10 | 7d | 1 | 1.06mi |
| 4336 Glenhaven Dr Decatur, GA | 4.0 | 3.0 | 2100 | $2,500 | $1.19 | 45d | 1 | 1.13mi |
| 2014 Manhattan Pkwy Decatur, GA | 3.0 | 2.5 | 1620 | $1,956 | $1.21 | 7d | 1 | 1.14mi |
| 4612 Grand Central Pkwy Decatur, GA | 2.0 | 2.5 | 1328 | $2,100 | $1.58 | 26d | 1 | 1.18mi |
| 1380 Colony Hill Ct Stone Mountain, GA | 4.0 | 4.5 | 1350 | $1,690 | $1.25 | 14d | 1 | 1.20mi |
| 1380 Colony Hill Ct Stone Mountain, GA | 3.0 | 1.5 | 1350 | $1,500 | $1.11 | 12d | 1 | 1.20mi |
| 924 Lake Drive Ter Stone Mountain, GA | 3.0 | 2.0 | 1380 | $1,670 | $1.21 | 45d | 1 | 1.20mi |
| 1859 Broadway St Decatur, GA | 3.0 | 2.5 | 1620 | $2,200 | $1.36 | 5d | 1 | 1.21mi |
| 1076 Martin Rd Stone Mountain, GA | 4.0 | 2.0 | 1760 | $2,011 | $1.14 | 18d | 1 | 1.26mi |
| 1467 Muirfield Dr Stone Mountain, GA | 3.0 | 2.0 | 1630 | $1,870 | $1.15 | 24d | 1 | 1.30mi |
| 867 Oakhill Ct Stone Mountain, GA | 3.0 | 2.5 | 1556 | $1,850 | $1.19 | 45d | 1 | 1.33mi |
| 869 Heritage Oaks Dr Stone Mountain, GA | 3.0 | 2.5 | 1400 | $1,199 | $0.86 | 1d | 1 | 1.34mi |
| 841 Arbor Ct Stone Mountain, GA | 3.0 | 2.0 | 1448 | $1,845 | $1.27 | 24d | 1 | 1.38mi |
| 1168 Perry Way Stone Mountain, GA | 4.0 | 3.0 | 2100 | $1,200 | $0.57 | 3d | 1 | 1.44mi |
| 887 Ellis Rd Stone Mountain, GA | 3.0 | 2.0 | 1778 | $1,923 | $1.08 | 26d | 1 | 1.47mi |
Listing history 8 events
-
2026-06-13statusdays on market $230,000 Pending 9 DOM
-
2026-06-09days on market $230,000 Active 8 DOM
-
2026-06-08days on market $230,000 Active 7 DOM
-
2026-06-07days on market $230,000 Active 6 DOM
-
2026-06-04days on market $230,000 Active 3 DOM
-
2026-06-03days on market $230,000 Active 2 DOM
-
2026-06-01remarks 699-char remark
-
2026-06-01$230,000 Active 1 DOM
ⓘ Source: listings_history table (triggers on properties + properties_extension) + one-shot
backfill from property_details.listing_events for pre-trigger history.
Tax reassessment forecast GA · Resets to sale price
- Current annual tax
- $711 · $59/mo
- Projected year-2 tax
- $2,116 · $176/mo
- Expected delta
- +$1,405/yr (+$117/mo · 197.5%)
ⓘ Screening estimate from a state-policy table — verify with the county assessor before closing.
Climate risk First Street
- Flood 1/10 Low FEMA zone X (unshaded) · 0% chance over 30 yrs
- Wildfire 1/10 Low
- Heat 5/10 Major 7 d/yr ≥104°F today · 18 d/yr by 30 yrs out
- Wind 6/10 Major 27% chance of damaging wind over 30 yrs
- Air quality 6/10 Major 8 unhealthy d/yr today · 11 by 30 yrs out
Nearby sold comps map
Loading sold comps map…
Walkable amenities ~0.75 mi
Loading nearby amenities…
Taxation est. · year 1
- Rental income
- $22,571
- − Mortgage interest
- −$12,884
- − Property taxes
- −$711
- − Insurance
- −$1,150
- − Repairs & maintenance
- −$1,806
- − Management
- −$1,806
- − Depreciation
- −$6,691
- Taxable loss
- −$2,476
- Est. tax savings @ 24.0%
- +$594
- After-tax cash flow
- $2,090/yr
For passive investors: Depreciation is non-cash, so a rental often shows a tax loss while cash-flowing — sheltering income. Rental losses are passive: they offset passive income freely, and up to $25,000/yr can offset ordinary (W-2) income if you actively participate and your MAGI is under $100k (phasing out to $0 by $150k); unused losses carry forward. On sale, claimed depreciation is recaptured at up to 25%, and gains may owe capital-gains tax (a 1031 exchange can defer both). Figures are a year-1 estimate at your 24.0% rate — not tax advice; consult a CPA.
Schools (NCES district)
- District
- Dekalb County
- NCES district ID
- 1301740
- Math proficiency
- 19% ▼ -12.00%
- Reading proficiency
- 28% ▼ -7.00%
- Median HH income
- $51,448
- Composite
- 20.92/100
- National rank
- #8482
- State rank
- #125 of 174 in GA
Livability — Redan
- Score
- 64/100
- State rank
- #274
- US rank
- #14766
Category grades
Schools grade is shown separately in the Schools card above.
Census & demographics
- Census place
- Redan, GA
- County
- Dekalb County · 782,738 people
- City population
- 29,279
- Metro
- Atlanta-Sandy Springs-Alpharetta, GA
- Population (ZIP)
- 29,240
- Household income
- $70,325
- Rent vs Own
- Severe rent burden
- 1106.0
Population outlook (DeKalb County) Hauer SSP2
- Today (2025)
- 839,977 people
- By 2030
- 891,768 · +6.2%
- By 2040
- 988,894 · +17.7%
- By 2050
- 1,074,583 · +27.9%
- By 2075
- 1,245,026 · +48.2%
- By 2100
- 1,303,135 · +55.1%
Race, ethnicity, and origin ACS 2023
- Neighborhood character
- Predominantly Black (84%)
- Race & ethnicity
- Black 84% White 5% Hispanic / Latino 5% Two or more races 5%
- Common ancestry
- Swedish 1% Russian 1%
- Foreign-born
- 11% · Canada
- Languages at home
- 90% English-only · Spanish 4% French/Haitian/Cajun 1% Other Indo-European 1%
Political lean MEDSL · DeKalb
- 2024 margin
- Solid D (+64.8) · D 81.9% · R 17.1% · Other 1.0%
- 2008→2024 swing
- +6.1pp toward D · 2008: 58.6pp · 2024: 64.8pp
- All cycles
- 2024: D+64.8 2020: D+67.4 2016: D+64.8 2012: D+56.8 2008: D+58.6
Not yet ingested
- Civics
- —
Market trends
- HPI YoY
- ▼ -169.92%
- Current HPI
- 206.5421
- Rent YoY
- ▲ 3.72%
- Metro
- Atlanta-Sandy Springs-Alpharetta, GA
- State GDP YoY
- ▲ 2.66%
- F500 in state
- 28
Industry mix (Fortune 500 HQ in GA)
| Industry | F500 HQs | Revenue |
|---|---|---|
| Paper / Packaging | 2 | $29B |
|
||
| Retail | 1 | $160B |
|
||
| Transportation / Logistics | 1 | $91B |
|
||
| Airlines | 1 | $62B |
|
||
| Consumer Goods | 1 | $47B |
|
||
| Utilities | 1 | $25B |
|
||
Price history
+206.7% since first listed5 events — show timeline
- 2026-05-31 Listed $230,000 FMLS
- 2026-05-31 Listed $230,000 GAMLS
- 1991-01-07 Sold (Public Records) $68,185 Public Records
- 1990-12-01 Sold (Public Records) $68,100 Public Records
- 1988-11-07 Sold (Public Records) $75,000 Public Records
Property tax history
-2.7%/yrLatest (2025): $711 · -4.3% YoY. Source: county tax records.
Cash-flow waterfall
monthlySold comps — $/sqft
last 12 mo · ≤1 miLoading sold comps…