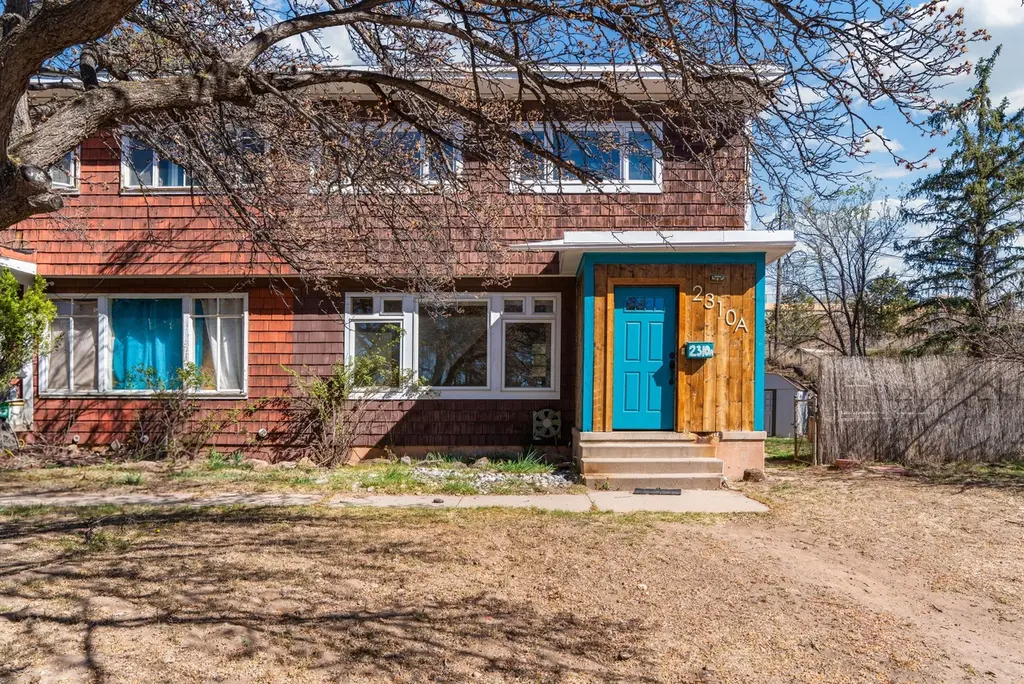
2310 39th Unit A · Los Alamos, NM
Flood risk 1/10 · Minimal
- FEMA flood zone
- X (unshaded)
- Chance of flooding over 30 yrs
- 0.0%
- Est. flood insurance / yr
- $507 – $1,088
Fire risk 5/10 · Moderate
- Est. fire insurance / yr
- $706 – $1,312
Heat risk 2/10 · Minimal
- Hot days now (above 86°F)
- 8 days/yr
- Hot days in 30 yrs
- 23 days/yr
Wind risk 1/10 · Minimal
- Chance of severe wind over 30 yrs
- —
Air-quality risk 6/10 · Moderate
- Unhealthy air days now
- 11 days/yr
- Unhealthy air days in 30 yrs
- 13 days/yr
Risk factors via First Street. Map © Google.
Why this score? — see what drove the C grade
The composite is a weighted blend of 9 inputs, each scored 0–100. Each bar is that input's sub-score; the figure is the points it added to the 100-point composite (weight × sub-score).
- Cash flow +21.5/30.0
- ARV discount +7.5/15.0
- DSCR +6.9/10.0
- Schools +6.4/10.0
- 1% rule +4.6/10.0
- Livability +4.0/5.0
- Rent growth +2.5/5.0
- Condition / age +2.5/5.0
- Appreciation +0.0/10.0
$345,000
🖨 Deal sheet (PDF) 📄 Offer letter ✓ Due diligence
Listing remarks
Seller offering up $8000 credit with an acceptable. Located on a quiet cul-de-sac in Los Alamos, this end-unit quad offers a convenient location close to many local amenities. The home is situated approximately 2 miles from the LANL badge office and about 1 mile from the Los Alamos Golf Course, with Little Forest Playschool nearby. The property features a spacious fenced yard with fruit trees, providing outdoor space for gardening, relaxing, or entertaining. Inside, the kitchen has been expanded and updated, creating a more open and functional space. A half bath has been added off the kitchen, and the upstairs bathroom has been updated. The property also includes two off-street parking spac
Key facts
- Spacious fenced yard
- Quiet cul-de-sac
- Updated half bath
Tags
Property features AI
Finance
- HOA & community: Homeowners association present
Exterior
- Utilities: Electricity available; Public water; Public sewer
- Home design: 2-story property; Flat roof
- Construction: Year built per public records
- Exterior features: Flat lot (0.14 acres)
Interior
- Bathrooms: 1 full bathroom; 1 half bathroom
- Heating & cooling: Forced air heating
- Interior features: Interior steps; Not ADA compliant
Neighborhood map
What this means for you Summary
Snapshot
- This is a 3-bed/1.0-bath condo listed at $345k.
Deal economics
- At list price, monthly cash flow is $519 ($6k/yr) — positive.
- The deal already cash-flows at list — no discount required.
- To meet the 1% rule (rent ≥ 1% of price), the offer needs to be $330k (4.4% below list).
- Recommended offer: $324k (6.0% below list) — sets the bar for market timing.
Location & tenants
- Location reads 81/100 on livability (#2 in NM, #1,377 nationally) — a professional / high-income tenant draw. Strengths: crime A+, employment A+, housing A+; Watch: amenities F, commute F.
- Los Alamos Public Schools (town): math 61% / reading 78% proficiency, ranked #2 of 29 in NM (top 7%) — acceptable for families but not a draw, mixed tenant base, ~2y average lease; only 10% free/reduced lunch — higher-income household profile.
- Market conditions: 46 active listings in the ZIP; 3 comparable units currently listed for rent nearby; rentals leasing fast (median 3d on market — plan ~1-2 weeks tenant-placement turnaround); high-income renter base; 14 units permitted in Los Alamos County in 2024 (0 in 5+ unit buildings).
Forward outlook
- Local home prices are declining (-3.0%/yr); year-one equity from $2k of loan paydown is wiped out by about $10k of value loss. Plan a longer hold.
- Los Alamos County population projected at +12% by 2050 — modest demand growth; plan on rents tracking national, not racing it.
Negotiation context
- It's been on market 87 days — a 6% lower offer ($324k) is reasonable based on typical stale-listing flexibility.
- 3 sale attempts since 7y ago with the ask held roughly flat each time — persistent listings suggest the price (not the market) is what's stuck; bring a comps-based counter.
Risks & watch-outs
- Watch-outs: built in 1952 — expect roof / HVAC / electrical / plumbing capex.
- Climate carrying-cost: moderate wildfire risk — expect insurance premiums to compound above CPI over the hold.
Questions for the listing agent
- It's been on market 87 days. Have you received any prior offers? Is the seller open to a 6% concession, seller financing, or rate buy-down credit?
- Built in 1952 — when were the roof, HVAC, electrical panel, plumbing, and water heater last replaced?
- Any open or pending special assessments — roof, HVAC, plumbing, elevator, façade? What's the per-unit balance and payoff schedule, and is the seller paying it off at close or rolling it to the buyer?
- Why hasn't it sold? Are there any deal-killer items the seller is aware of (foundation, flood, title, zoning, code violations)?
- Is there a deadline driving the sale (1031 exchange, divorce, estate, relocation)? That informs how much negotiation room exists.
- Schools are B-rated — typically a magnet for longer-tenancy family renters. What's the average tenant stay here, and is there a school-zone premium baked into asking?
- What's the average days-on-market for RENTAL listings here right now (not sales)? A rising rental-DOM trend means longer vacancies and softer asking-rent achievability than the comps imply.
- What's the recent tenant-quality profile in this submarket — average credit score on applications, eviction rate, late-payment / NSF rate, and stable-employment percentage? A property-management company in the area should have these aggregated.
- How much new apartment / multifamily construction is in the pipeline within 1–3 miles? Heavy new supply (>2% of stock underway) typically softens rents 12–24 months out; light construction supports rent growth.
Investment metrics
- 1% rule
- 0.96% ✗
- Cap rate
- 8.10%
- Cash-on-cash
- 6.45%
- DSCR
- 1.29
- GRM
- 8.7
CMA / ARV
No comps found within radius.
Projected returns pro-forma
-3.0% appreciation · 3.0% rent growth · sell at horizon
- IRR
- -6.4%
- Equity multiple
- 0.76×
- Total profit
- $-22,954
- Equity at exit
- $51,441
- IRR
- 3.2%
- Equity multiple
- 1.23×
- Total profit
- $22,069
- Equity at exit
- $29,829
Cash invested: $96,600 (down + closing). Projections, not guarantees.
Landlord ↔ Tenant lean methodology
- Overall (STATE)
- 55 Moderately Landlord-Leaning
- State New Mexico
- 55 Moderately Landlord-Leaning · D+3
- County
- — inherits STATE
- City
- — inherits STATE
ZIP-level market 87544
- Active inventory
- 46
- Price-to-rent
- 8.7×
Monthly cashflow live
- Estimated rent
- $3,297 medium interval (Pro) →
- Mortgage (P&I)
- −$1,809
- Tax from tax record
- −$132 /mo · $1,585/yr
- Insurance
- −$144
- HOA
- −$0
- Vacancy / Maint / Mgmt
- −$692
- Net cashflow
- $519
Break-even live
Sensitivity live
| Price | -10% $715 | -5% $617 | +0% $519 | +5% $422 | +10% $324 |
|---|---|---|---|---|---|
| Rent | -10% $259 | -5% $389 | +0% $519 | +5% $650 | +10% $780 |
| Rate | -1.0pp $693 | -0.5pp $607 | base $519 | +0.5pp $430 | +1.0pp $339 |
UW: 25.0% down · 7.5% · 30yr · 1.5% tax · 5.0% vac · 8.0% maint · 8.0% mgmt
Financing live
Cash to close
- Down payment
- $86,250
- Closing costs
- $10,350
- Reserves months
- —
- Total cash needed
- —
Loan-product check · same deal, 3 products live
Conventional
25% down · 7.5% · 30yr
- Down + closing
- —
- Monthly P&I
- —
- Monthly cashflow
- —
- DSCR
- —
- Eligible?
- —
Personal DTI + credit; lowest rate.
DSCR
20% down · 8.5% · 30yr
- Down + closing
- —
- Monthly P&I
- —
- Monthly cashflow
- —
- DSCR
- —
- Eligible?
- —
No personal income docs; deal must DSCR.
Hard money
10% down · 12.0% · 12mo
- Down + closing
- —
- Monthly P&I
- —
- Monthly cashflow
- —
- DSCR
- —
- Eligible?
- —
Short-term bridge; refi at stabilization.
Rent comps 3 comps
| Address | Beds | Baths | Sqft | Rent | $/sqft | DOM | Units | Dist |
|---|---|---|---|---|---|---|---|---|
| 141 36th St Los Alamos, NM | 2.0–3.0 | 2.0 | 1241 | $4,625 | $3.73 | 2d | 89 | 1.21mi |
| 1926 24th St Los Alamos, NM | 2.0 | 1.0 | 900 | $1,920 | $2.13 | 2d | 1 | 1.33mi |
| 505 Oppenheimer Dr #212 Los Alamos, NM | 2.0 | 2.0 | 972 | $2,450 | $2.52 | 44d | 1 | 1.46mi |
HOA detail condo
- Monthly dues
- $0 · $0/yr
- Assessments
- None detected in remarks — confirm with the listing agent.
Listing history 25 events
-
2026-06-21days on market $345,000 Active 87 DOM
-
2026-06-19days on market $345,000 Active 85 DOM
-
2026-06-18days on market $345,000 Active 84 DOM
-
2026-06-17days on market $345,000 Active 83 DOM
-
2026-06-16days on market $345,000 Active 82 DOM
-
2026-06-15days on market $345,000 Active 81 DOM
-
2026-06-14days on market $345,000 Active 79 DOM
-
2026-06-12days on market $345,000 Active 78 DOM
-
2026-06-09days on market $345,000 Active 75 DOM
-
2026-06-08days on market $345,000 Active 74 DOM
-
2026-06-07days on market $345,000 Active 73 DOM
-
2026-06-07days on market $345,000 Active 72 DOM
-
2026-06-04days on market $345,000 Active 69 DOM
-
2026-06-02days on market $345,000 Active 68 DOM
-
2026-06-01days on market $345,000 Active 67 DOM
-
2026-05-31days on market $345,000 Active 66 DOM
-
2026-05-31days on market $345,000 Active 65 DOM
-
2026-05-18status Active
-
2026-04-04historical Active Under Contract
-
2026-03-26$345,000 Active
-
2019-11-14soldstatus
-
2019-08-07historical Pending (Please Show)
-
2019-08-03price $184,900
-
2019-06-09price $198,900
-
2019-04-08$210,000 Active
ⓘ Source: listings_history table (triggers on properties + properties_extension) + one-shot
backfill from property_details.listing_events for pre-trigger history.
Tax reassessment forecast NM · Resets to sale price
- Current annual tax
- $1,585 · $132/mo
- Projected year-2 tax
- $2,760 · $230/mo
- Expected delta
- +$1,175/yr (+$98/mo · 74.1%)
ⓘ Screening estimate from a state-policy table — verify with the county assessor before closing.
Climate risk First Street
- Flood 1/10 Low FEMA zone X (unshaded) · 0% chance over 30 yrs
- Wildfire 5/10 Major
- Heat 2/10 Low 8 d/yr ≥86°F today · 23 d/yr by 30 yrs out
- Wind 1/10 Low
- Air quality 6/10 Major 11 unhealthy d/yr today · 13 by 30 yrs out
Nearby sold comps map
Loading sold comps map…
Walkable amenities ~0.75 mi
Loading nearby amenities…
Taxation est. · year 1
- Rental income
- $39,563
- − Mortgage interest
- −$19,325
- − Property taxes
- −$1,585
- − Insurance
- −$1,725
- − Repairs & maintenance
- −$3,165
- − Management
- −$3,165
- − Depreciation
- −$10,036
- Taxable income
- $561
- Est. tax owed @ 24.0%
- −$135
- After-tax cash flow
- $6,099/yr
For passive investors: Depreciation is non-cash, so a rental often shows a tax loss while cash-flowing — sheltering income. Rental losses are passive: they offset passive income freely, and up to $25,000/yr can offset ordinary (W-2) income if you actively participate and your MAGI is under $100k (phasing out to $0 by $150k); unused losses carry forward. On sale, claimed depreciation is recaptured at up to 25%, and gains may owe capital-gains tax (a 1031 exchange can defer both). Figures are a year-1 estimate at your 24.0% rate — not tax advice; consult a CPA.
Schools (NCES district)
- District
- Los Alamos Public Schools
- NCES district ID
- 3501650
- Math proficiency
- 61% ▲ 14.00%
- Reading proficiency
- 78% ▲ 20.00%
- Median HH income
- $104,436
- Composite
- 64.09/100
- National rank
- #577
- State rank
- #2 of 29 in NM
Livability — Los Alamos
- Score
- 81/100
- State rank
- #2
- US rank
- #1377
Category grades
Schools grade is shown separately in the Schools card above.
Census & demographics
- Census place
- Los Alamos, NM
- County
- Los Alamos County · 13,598 people
- City population
- 13,598
- Metro
- Los Alamos, NM
- Population (ZIP)
- 13,598
- Household income
- $138,583
- Rent vs Own
- Severe rent burden
- 43.0
Population outlook (Los Alamos County) Hauer SSP2
- Today (2025)
- 17,874 people
- By 2030
- 18,157 · +1.6%
- By 2040
- 19,073 · +6.7%
- By 2050
- 20,010 · +12.0%
- By 2075
- 22,686 · +26.9%
- By 2100
- 23,523 · +31.6%
Race, ethnicity, and origin ACS 2023
- Neighborhood character
- Predominantly White (68%)
- Race & ethnicity
- White 68% Hispanic / Latino 19% Two or more races 11% Asian 7% Black 1%
- Hispanic origin (detail)
- Mexican 11%
- Common ancestry
- Italian 4% Slovak 4% Romanian 3%
- Foreign-born
- 14% · China, Canada, South Korea
- Languages at home
- 79% English-only · Spanish 9% Chinese 4% Other Indo-European 2%
Political lean MEDSL · Los Alamos
- 2024 margin
- Solid D (+30.2) · D 63.4% · R 33.2% · Other 3.4%
- 2008→2024 swing
- +23.3pp toward D · 2008: 6.9pp · 2024: 30.2pp
- All cycles
- 2024: D+30.2 2020: D+26.6 2016: D+20.3 2012: D+3.7 2008: D+6.9
Not yet ingested
- Civics
- —
Market trends
- HPI YoY
- ▼ -377.45%
- Current HPI
- 192.7096
- Rent YoY
- —
- Metro
- Los Alamos, NM
- State GDP YoY
- —
- F500 in state
- 0
Price history
+64.3% since first listed8 events — show timeline
- 2026-05-18 Relisted — Santa Fe MLS
- 2026-04-04 Contingent — Santa Fe MLS
- 2026-03-26 Listed $345,000 Santa Fe MLS
- 2019-11-14 Sold (Public Records) — Public Records
- 2019-08-07 Contingent — Santa Fe MLS
- 2019-08-03 Price Changed $184,900 Santa Fe MLS
- 2019-06-09 Price Changed $198,900 Santa Fe MLS
- 2019-04-08 Listed $210,000 Santa Fe MLS
Property tax history
+7.7%/yrLatest (2025): $1,585 · +3.8% YoY. Source: county tax records.
Cash-flow waterfall
monthlySold comps — $/sqft
last 12 mo · ≤1 miLoading sold comps…