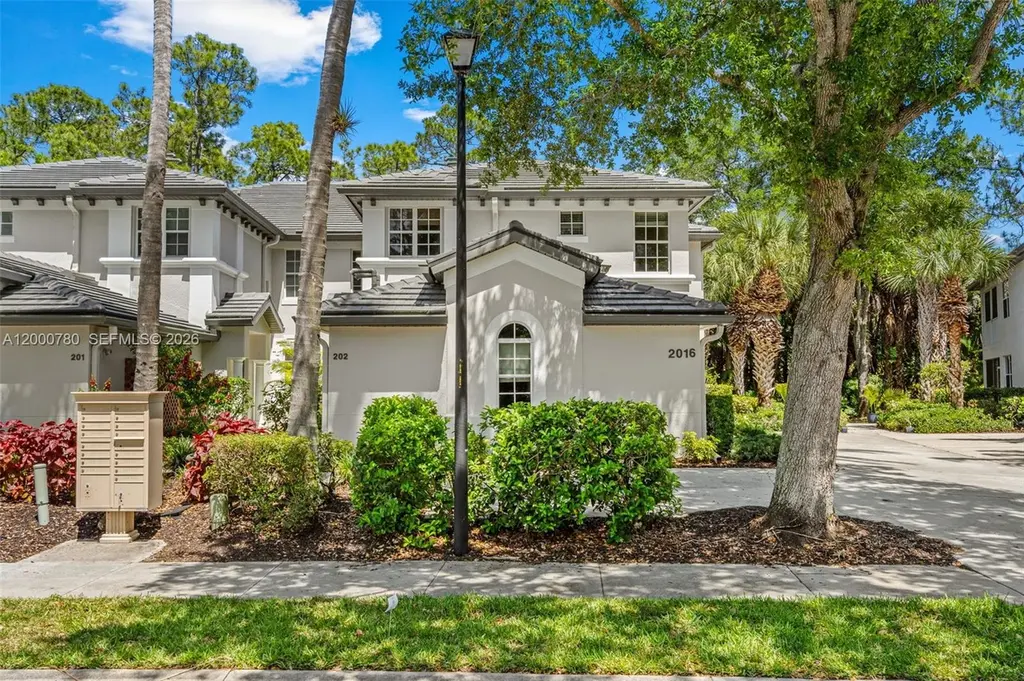
2016 Tarpon Bay Dr N #202 · Island Walk, FL
Flood risk 1/10 · Minimal
- FEMA flood zone
- X (unshaded)
- Chance of flooding over 30 yrs
- 0.0%
- Est. flood insurance / yr
- $507 – $1,088
Fire risk 1/10 · Minimal
- Est. fire insurance / yr
- $947 – $1,759
Heat risk 10/10 · Severe
- Hot days now (above 107°F)
- 7 days/yr
- Hot days in 30 yrs
- 31 days/yr
Wind risk 10/10 · Severe
- Chance of severe wind over 30 yrs
- 99.0%
Air-quality risk 2/10 · Minimal
- Unhealthy air days now
- 2 days/yr
- Unhealthy air days in 30 yrs
- 2 days/yr
Risk factors via First Street. Map © Google.
Why this score? — see what drove the C+ grade
The composite is a weighted blend of 9 inputs, each scored 0–100. Each bar is that input's sub-score; the figure is the points it added to the 100-point composite (weight × sub-score).
- Cash flow +25.8/30.0
- 1% rule +8.9/10.0
- DSCR +8.6/10.0
- ARV discount +7.5/15.0
- Schools +5.0/10.0
- Livability +3.2/5.0
- Condition / age +2.5/5.0
- Rent growth +1.9/5.0
- Appreciation +0.0/10.0
$400,000
🖨 Deal sheet 📄 Offer letter ✓ Due diligence
Listing remarks
Beautiful townhome in Bimini Bay III at Tarpon Bay Condo, offering a spacious and thoughtfully designed layout with 3 bedrooms, 2 bathrooms, and a versatile den/office. All bedrooms feature walk-in closets, providing abundant storage, while the expansive screened balcony creates the perfect setting for relaxing or entertaining. The home also features a separate laundry room with a full-size washer and dryer and a 2-car garage with additional guest parking available. Residents enjoy a variety of amenities, including a private beach with a pier, community pool and spa, as well as tennis and basketball courts, all within a well-maintained gated community.
Key facts
- Community pool
- Screened balcony
- Private beach
Tags
Property features AI
Finance
- Financial info: Pets allowed with restrictions
- HOA & community: Quarterly association fee; HOA covers management, amenities, grounds and structure maintenance, parking and security; Community amenities include beach rights, basketball court, billiard room, business center, clubhouse, fitness center, library, barbecue/picnic area, playground, pool, spa/hot tub, and tennis courts
Exterior
- Parking: Attached covered garage; 2 covered garage spaces
- Security: Phone entry; Security/high impact doors
- Utilities: Cable available
- Home design: Attached property (condo/attached unit); 2 stories; Entry on level 1
- Construction: Block construction; Resale property
- Exterior features: Balcony; Screened balcony/porch; Association pool
Interior
- Kitchen: Electric range; Dishwasher; Microwave; Refrigerator; Kitchen island; Pantry
- Bedrooms: Upper-level primary bedroom
- Flooring: Carpet; Tile
- Bathrooms: 2 full bathrooms
- Heating & cooling: Central heating (electric); Central air conditioning (electric)
- Interior features: First floor entry; Kitchen island; Main living area on upper level; Pantry; Upper-level primary bedroom; Walk-in closets; Unfurnished
- Laundry & utility: Washer; Dryer; Utility room; Laundry room
Neighborhood map
What this means for you Summary
Snapshot
- This is a 3-bed/2.0-bath condo listed at $400k.
Deal economics
- At list price, monthly cash flow is $966 ($12k/yr) — positive.
- The deal already cash-flows at list — no discount required.
- Meets the 1% rule at list price ($6k rent vs $400k).
- Recommended offer: $376k (6.0% below list) — sets the bar for market timing.
Location & tenants
- Location reads 64/100 on livability (#692 in FL) — a middle-class / working-renter tenant base. Strengths: crime A+, employment A+, housing B+; Watch: health & safety D, amenities F, commute F.
- Collier (suburban): math 60% / reading 56% proficiency, ranked #16 of 73 in FL (top 22%) — acceptable for families but not a draw, mixed tenant base, ~2y average lease.
- Market conditions: Rents soft (-2.5%/yr); 586 active listings in the ZIP; 40 comparable units currently listed for rent nearby; rentals at typical pace (median 24d on market — plan ~3-4 weeks tenant-placement turnaround); high-income renter base; 3,520 units permitted in Collier County in 2024 (959 in 5+ unit buildings).
- At $5,554/mo this rent would consume 59% of the median local household income ($113k/yr) (locally 741% of renters already pay >50% of income on rent) — very limited rent-growth headroom before tenants either downsize or default.
Forward outlook
- Local home prices are declining (-3.0%/yr); year-one equity from $3k of loan paydown is wiped out by about $12k of value loss. Plan a longer hold.
- Collier County population projected at +30% by 2050 — long-run rental-demand tailwind backs the buy-and-hold thesis.
Negotiation context
- It's been on market 64 days — a 6% lower offer ($376k) is reasonable based on typical stale-listing flexibility.
Risks & watch-outs
- Climate carrying-cost: severe wind risk, 99% chance of damaging wind over 30y; extreme-heat days projected 7→31/yr by 2055 (HVAC capex compounding) — expect insurance premiums to compound above CPI over the hold.
Questions for the listing agent
- It's been on market 64 days. Have you received any prior offers? Is the seller open to a 6% concession, seller financing, or rate buy-down credit?
- What does the HOA fee cover, when was the last increase, and are there any pending special assessments or reserve-fund shortfalls?
- Any open or pending special assessments — roof, HVAC, plumbing, elevator, façade? What's the per-unit balance and payoff schedule, and is the seller paying it off at close or rolling it to the buyer?
- Why hasn't it sold? Are there any deal-killer items the seller is aware of (foundation, flood, title, zoning, code violations)?
- Is there a deadline driving the sale (1031 exchange, divorce, estate, relocation)? That informs how much negotiation room exists.
- What's the average days-on-market for RENTAL listings here right now (not sales)? A rising rental-DOM trend means longer vacancies and softer asking-rent achievability than the comps imply.
- What's the recent tenant-quality profile in this submarket — average credit score on applications, eviction rate, late-payment / NSF rate, and stable-employment percentage? A property-management company in the area should have these aggregated.
- How much new apartment / multifamily construction is in the pipeline within 1–3 miles? Heavy new supply (>2% of stock underway) typically softens rents 12–24 months out; light construction supports rent growth.
Investment metrics
- 1% rule
- 1.39% ✓
- Cap rate
- 9.19%
- Cash-on-cash
- 10.35%
- DSCR
- 1.46
- GRM
- 6.0
CMA / ARV
No comps found within radius.
Projected returns pro-forma
-3.0% appreciation · 0.0% rent growth · sell at horizon
- IRR
- -4.7%
- Equity multiple
- 0.83×
- Total profit
- $-19,068
- Equity at exit
- $59,641
- IRR
- 0.3%
- Equity multiple
- 1.02×
- Total profit
- $1,716
- Equity at exit
- $34,585
Cash invested: $112,000 (down + closing). Projections, not guarantees.
Landlord ↔ Tenant lean methodology
- Overall (STATE)
- 87 Strongly Landlord-Friendly
- State Florida
- 87 Strongly Landlord-Friendly · R+3
- County
- — inherits STATE
- City
- — inherits STATE
ZIP-level market 34119
- Rents YoY
- -2.5%
- Active inventory
- 586
- Price-to-rent
- 6.0×
Monthly cashflow live
- Estimated rent
- $5,554 high interval (Pro) →
- Mortgage (P&I)
- −$2,098
- Tax from tax record
- −$209 /mo · $2,508/yr
- Insurance
- −$167
- HOA
- −$948
- Vacancy / Maint / Mgmt
- −$1,166
- Net cashflow
- $966
Break-even live
UW: 25.0% down · 7.5% · 30yr · 1.5% tax · 5.0% vac · 8.0% maint · 8.0% mgmt
Financing live
Cash to close
- Down payment
- $100,000
- Closing costs
- $12,000
- Reserves months
- —
- Total cash needed
- —
Loan-product check · same deal, 3 products live
Conventional
25% down · 7.5% · 30yr
- Down + closing
- —
- Monthly P&I
- —
- Monthly cashflow
- —
- DSCR
- —
- Eligible?
- —
Personal DTI + credit; lowest rate.
DSCR
20% down · 8.5% · 30yr
- Down + closing
- —
- Monthly P&I
- —
- Monthly cashflow
- —
- DSCR
- —
- Eligible?
- —
No personal income docs; deal must DSCR.
Hard money
10% down · 12.0% · 12mo
- Down + closing
- —
- Monthly P&I
- —
- Monthly cashflow
- —
- DSCR
- —
- Eligible?
- —
Short-term bridge; refi at stabilization.
Rent comps 40 comps
| Address | Beds | Baths | Sqft | Rent | $/sqft | DOM | Units | Dist |
|---|---|---|---|---|---|---|---|---|
| 2004 Tarpon Bay Dr N #201 Naples, FL | 3.0 | 2.0 | 2170 | $6,000 | $2.76 | 23d | 1 | 0.06mi |
| 2004 Tarpon Bay Dr N #101 Naples, FL | 3.0 | 2.0 | 1759 | $2,450 | $1.39 | 23d | 1 | 0.06mi |
| 2001 Tarpon Bay Dr N #102 Naples, FL | 2.0 | 2.0 | 1620 | $5,400 | $3.33 | 23d | 1 | 0.06mi |
| 2115 Malibu Lake Cir Naples, FL | 1.0–4.0 | 1.0–2.0 | 1188 | $2,791 | $2.35 | 13d | 56 | 0.15mi |
| 1634 Tarpon Bay Dr S #202 Naples, FL | 3.0 | 2.0 | 2170 | $6,000 | $2.76 | 23d | 1 | 0.23mi |
| 1634 Tarpon Bay Dr S #202 Naples, FL | 3.0 | 2.0 | 2170 | $6,000 | $2.76 | 13d | 1 | 0.23mi |
| 1628 Cayman Ct #2 Naples, FL | 3.0 | 2.0 | 1879 | $6,500 | $3.46 | 23d | 1 | 0.33mi |
| 1761 Tarpon Bay Dr S #58 Naples, FL | 3.0 | 2.0 | 1879 | $3,299 | $1.76 | 23d | 1 | 0.33mi |
| 1710 Tarpon Bay Dr S Unit 4 Naples, FL | 2.0 | 2.0 | 1537 | $2,200 | $1.43 | 13d | 1 | 0.39mi |
| 6051 Shallows Way Naples, FL | 3.0 | 2.0 | 2000 | $5,000 | $2.50 | 23d | 1 | 0.64mi |
| 10020 Heather Ln Unit 9-904 Naples, FL | 3.0 | 2.0 | 1640 | $2,350 | $1.43 | 23d | 1 | 0.68mi |
| 6215 Wilshire Pines Cir #1601 Naples, FL | 3.0 | 2.0 | 1592 | $4,500 | $2.83 | 23d | 1 | 0.69mi |
| 10033 Heather Ln Unit 5-502 Naples, FL | 3.0 | 2.0 | 1774 | $2,300 | $1.30 | 23d | 1 | 0.70mi |
| 15145 Palmer Lake Cir #103 Naples, FL | 3.0 | 2.0 | 1571 | $7,000 | $4.46 | 23d | 1 | 0.72mi |
| 6325 Wilshire Pines Cir #308 Naples, FL | 3.0 | 2.0 | 1577 | $5,000 | $3.17 | 13d | 1 | 0.76mi |
| 15181 Butler Lake Dr #201 Naples, FL | 3.0 | 2.0 | 2152 | $7,500 | $3.49 | 13d | 1 | 0.84mi |
| 15177 Butler Lake Dr #201 Naples, FL | 3.0 | 2.0 | 2152 | $8,500 | $3.95 | 13d | 1 | 0.86mi |
| 5000 Immokalee Rd Naples, FL | 1.0–3.0 | 1.0–2.0 | 1115 | $4,272 | $3.83 | 13d | 68 | 0.92mi |
| 5045 Cedar Springs Dr #203 Naples, FL | 2.0 | 2.0 | 1427 | $4,200 | $2.94 | 23d | 1 | 0.95mi |
| 5657 Whisperwood Blvd #204 Naples, FL | 2.0 | 2.0 | 1793 | $6,000 | $3.35 | 23d | 1 | 0.97mi |
| 2740 Cypress Trace Cir Naples, FL | 2.0 | 2.0 | 1493 | $3,488 | $2.34 | 23d | 3 | 0.99mi |
| 5105 Cedar Springs Dr #101 Naples, FL | 2.0 | 2.0 | 1650 | $7,000 | $4.24 | 23d | 1 | 0.99mi |
| 2790 Cypress Trace Cir Naples, FL | 2.0 | 2.0 | 1537 | $5,000 | $3.25 | 23d | 2 | 1.01mi |
| 5125 Cedar Springs Dr #204 Naples, FL | 3.0 | 2.0 | 2177 | $5,650 | $2.60 | 23d | 1 | 1.03mi |
| 5645 Whisperwood Blvd #504 Naples, FL | 2.0 | 2.0 | 1793 | $6,000 | $3.35 | 23d | 1 | 1.03mi |
| 2525 Aspen Creek Ln #101 Naples, FL | 3.0 | 2.0 | 1532 | $4,500 | $2.94 | 23d | 1 | 1.07mi |
| 5632 Whisperwood Blvd #1601 Naples, FL | 3.0 | 2.0 | 1856 | $8,000 | $4.31 | 23d | 1 | 1.08mi |
| 5360 Andover Dr #202 Naples, FL | 3.0 | 2.0 | 1928 | $6,500 | $3.37 | 23d | 1 | 1.11mi |
| 2820 Cypress Trace Cir Naples, FL | 2.0 | 2.0 | 1254 | $3,748 | $2.99 | 23d | 3 | 1.11mi |
| 5693 Heron Ln #502 Naples, FL | 2.0 | 2.0 | 1490 | $6,800 | $4.56 | 23d | 1 | 1.12mi |
| 5330 Andover Dr #102 Naples, FL | 3.0 | 2.0 | 1740 | $2,550 | $1.47 | 23d | 1 | 1.14mi |
| 1156 Oakes Blvd Naples, FL | 3.0 | 2.0 | 1554 | $7,500 | $4.83 | 23d | 1 | 1.15mi |
| 5325 Andover Dr #101 Naples, FL | 2.0 | 2.0 | 1654 | $5,250 | $3.17 | 23d | 1 | 1.16mi |
| 5130 Cobble Creek Ct Unit B202 Naples, FL | 3.0 | 2.0 | 2050 | $2,800 | $1.37 | 13d | 1 | 1.17mi |
| 5705 Heron Ln #806 Naples, FL | 2.0 | 2.0 | 1540 | $7,000 | $4.55 | 23d | 1 | 1.19mi |
| 2600 Marshcreek Ln #201 Naples, FL | 3.0 | 2.0 | 1765 | $2,595 | $1.47 | 13d | 1 | 1.20mi |
| 2868 Tiburon Blvd E #102 Naples, FL | 3.0 | 2.0 | 2420 | $15,000 | $6.20 | 23d | 1 | 1.21mi |
| 2868 Tiburon Blvd E #102 Naples, FL | 3.0 | 2.0 | 2420 | $15,000 | $6.20 | 21d | 1 | 1.21mi |
| 2864 Tiburon Blvd E #101 Naples, FL | 2.0 | 2.0 | 2159 | $13,500 | $6.25 | 23d | 1 | 1.21mi |
| 2864 Tiburon Blvd E #101 Naples, FL | 2.0 | 2.0 | 2159 | $13,500 | $6.25 | 13d | 1 | 1.21mi |
HOA detail condo
- Monthly dues
- $948 · $11,376/yr
- Likely covers
- poolsecurity
- Assessments
- None detected in remarks — confirm with the listing agent.
Listing history 17 events
-
2026-06-18days on market $400,000 Active 64 DOM
-
2026-06-17days on market $400,000 Active 63 DOM
-
2026-06-16days on market $400,000 Active 62 DOM
-
2026-06-15days on market $400,000 Active 61 DOM
-
2026-06-14days on market $400,000 Active 59 DOM
-
2026-06-10days on market $400,000 Active 56 DOM
-
2026-06-09days on market $400,000 Active 55 DOM
-
2026-06-08days on market $400,000 Active 54 DOM
-
2026-06-07days on market $400,000 Active 53 DOM
-
2026-06-03days on market $400,000 Active 49 DOM
-
2026-06-02days on market $400,000 Active 48 DOM
-
2026-06-01days on market $400,000 Active 47 DOM
-
2026-05-31days on market $400,000 Active 46 DOM
-
2026-05-30days on market $400,000 Active 45 DOM
-
2026-05-11price $400,000
-
2026-04-30price $430,000
-
2026-04-15$475,000 Active
ⓘ Source: listings_history table (triggers on properties + properties_extension) + one-shot
backfill from property_details.listing_events for pre-trigger history.
Tax reassessment forecast FL · Resets to sale price
- Current annual tax
- $2,508 · $209/mo
- Projected year-2 tax
- $3,320 · $277/mo
- Expected delta
- +$812/yr (+$68/mo · 32.4%)
ⓘ Screening estimate from a state-policy table — verify with the county assessor before closing.
Climate risk First Street
- Flood 1/10 Low FEMA zone X (unshaded) · 0% chance over 30 yrs
- Wildfire 1/10 Low
- Heat 10/10 Extreme 7 d/yr ≥107°F today · 31 d/yr by 30 yrs out
- Wind 10/10 Extreme 99% chance of damaging wind over 30 yrs
- Air quality 2/10 Low 2 unhealthy d/yr today · 2 by 30 yrs out
Nearby sold comps map
Loading sold comps map…
Walkable amenities ~0.75 mi
Loading nearby amenities…
Taxation est. · year 1
- Rental income
- $66,646
- − Mortgage interest
- −$22,406
- − Property taxes
- −$2,508
- − Insurance
- −$2,000
- − Repairs & maintenance
- −$5,332
- − Management
- −$5,332
- − HOA
- −$11,376
- − Depreciation
- −$11,636
- Taxable income
- $6,056
- Est. tax owed @ 24.0%
- −$1,453
- After-tax cash flow
- $10,141/yr
For passive investors: Depreciation is non-cash, so a rental often shows a tax loss while cash-flowing — sheltering income. Rental losses are passive: they offset passive income freely, and up to $25,000/yr can offset ordinary (W-2) income if you actively participate and your MAGI is under $100k (phasing out to $0 by $150k); unused losses carry forward. On sale, claimed depreciation is recaptured at up to 25%, and gains may owe capital-gains tax (a 1031 exchange can defer both). Figures are a year-1 estimate at your 24.0% rate — not tax advice; consult a CPA.
Schools (NCES district)
- District
- Collier
- NCES district ID
- 1200330
- Math proficiency
- 60% ▼ -4.00%
- Reading proficiency
- 56% ▼ -2.00%
- Median HH income
- $58,275
- Composite
- 50.23/100
- National rank
- #1892
- State rank
- #16 of 73 in FL
Livability — Island Walk
- Score
- 64/100
- State rank
- #692
- US rank
- #14444
Category grades
Schools grade is shown separately in the Schools card above.
Census & demographics
- County
- Collier County · 396,295 people
- Metro
- Naples-Marco Island, FL
- Population (ZIP)
- 36,807
- Household income
- $113,391
- Rent vs Own
- Severe rent burden
- 741.0
Population outlook (Collier County) Hauer SSP2
- Today (2025)
- 420,858 people
- By 2030
- 450,054 · +6.9%
- By 2040
- 502,232 · +19.3%
- By 2050
- 544,932 · +29.5%
- By 2075
- 627,203 · +49.0%
- By 2100
- 659,015 · +56.6%
Race, ethnicity, and origin ACS 2023
- Neighborhood character
- Predominantly White (74%)
- Race & ethnicity
- White 74% Hispanic / Latino 20% Two or more races 14% Black 1%
- Hispanic origin (detail)
- Mexican 6% Puerto Rican 2% Cuban 4% Dominican 2%
- Common ancestry
- Romanian 4% Lithuanian 2% Italian 2%
- Foreign-born
- 17% · Canada, Jamaica, Dominican Republic
- Languages at home
- 78% English-only · Spanish 15% Other Indo-European 3% Russian/Polish/Slavic 1%
Political lean MEDSL · Collier
- 2024 margin
- Solid R (+33.1) · D 33.1% · R 66.2%
- 2008→2024 swing
- -10.6pp toward R · 2008: -22.5pp · 2024: -33.1pp
- All cycles
- 2024: R+33.1 2020: R+24.7 2016: R+26.0 2012: R+30.1 2008: R+22.5
Not yet ingested
- Civics
- —
Market trends
- HPI YoY
- ▼ -243.12%
- Current HPI
- 269.3208
- Rent YoY
- ▼ -2.51%
- Metro
- Naples-Marco Island, FL
- State GDP YoY
- ▲ 3.28%
- F500 in state
- 36
Industry mix (Fortune 500 HQ in FL)
| Industry | F500 HQs | Revenue |
|---|---|---|
| Industrial Technology | 2 | $29B |
|
||
| Insurance | 2 | $17B |
|
||
| Retail | 1 | $60B |
|
||
| Technology Distribution | 1 | $58B |
|
||
| Homebuilding | 1 | $35B |
|
||
| Technology Manufacturing | 1 | $35B |
|
||
Price history
-15.8% since first listed3 events — show timeline
- 2026-05-11 Price Changed $400,000 MARMLS
- 2026-04-30 Price Changed $430,000 MARMLS
- 2026-04-15 Listed $475,000 MARMLS
Property tax history
+1.9%/yrLatest (2025): $2,508 · +2.5% YoY. Source: county tax records.
Cash-flow waterfall
monthlySold comps — $/sqft
last 12 mo · ≤1 miLoading sold comps…