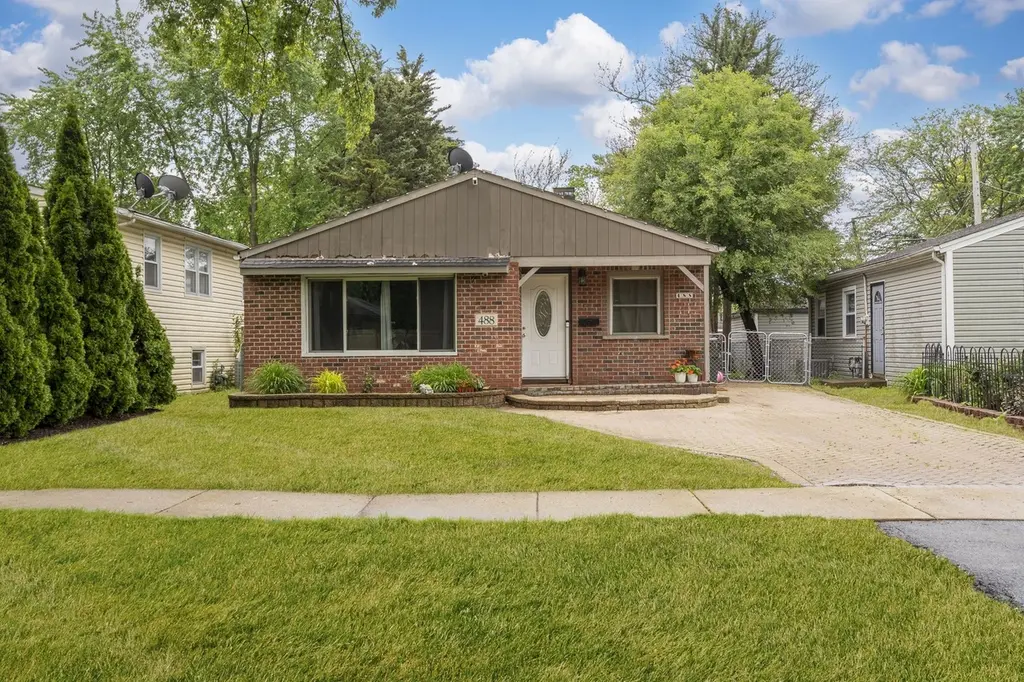
488 Ann St · West Chicago, IL
Flood risk 1/10 · Minimal
- FEMA flood zone
- X (unshaded)
- Chance of flooding over 30 yrs
- 0.0%
- Est. flood insurance / yr
- $507 – $1,088
Fire risk 1/10 · Minimal
- Est. fire insurance / yr
- $804 – $1,492
Heat risk 3/10 · Minor
- Hot days now (above 103°F)
- 7 days/yr
- Hot days in 30 yrs
- 15 days/yr
Wind risk 2/10 · Minimal
- Chance of severe wind over 30 yrs
- 0.0%
Air-quality risk 3/10 · Minor
- Unhealthy air days now
- 3 days/yr
- Unhealthy air days in 30 yrs
- 4 days/yr
Risk factors via First Street. Map © Google.
Why this score? — see what drove the D- grade
The composite is a weighted blend of 9 inputs, each scored 0–100. Each bar is that input's sub-score; the figure is the points it added to the 100-point composite (weight × sub-score).
- Cash flow +16.6/30.0
- DSCR +5.2/10.0
- 1% rule +4.2/10.0
- Livability +3.2/5.0
- Rent growth +2.5/5.0
- Condition / age +2.5/5.0
- Schools +2.0/10.0
- ARV discount +0.0/15.0
- Appreciation +0.0/10.0
$325,000
🖨 Deal sheet (PDF) 📄 Offer letter ✓ Due diligence
Listing remarks MLS
Spacious home updated 2 years ago some recent 3 bedrooms
Key facts
- Patio area
- 5,453 sq ft lot
- 3 parking spots
Tags
Property features AI
Finance
- Other: Living area reported by assessor; Possession negotiable
- HOA & community: No master association fee required
Exterior
- Parking: 3 parking spaces (owned)
- Utilities: Public water; Public sewer
- Home design: Detached single-family home; One-story layout; Fee simple ownership
- Construction: Vinyl siding and frame construction; Built approximately 61–70 years ago; Property built before 1978
- Exterior features: Lot dimensions approximately 43 x 126; Lot under 0.25 acre
Interior
- Kitchen: Kitchen on main level, approximately 13 x 12
- Bedrooms: 3 bedrooms (all on main level); Master bedroom on main level, approximately 13 x 12; Second bedroom on main level, approximately 12 x 10; Third bedroom on main level, approximately 11 x 9
- Bathrooms: 1 full bathroom
- Heating & cooling: Natural gas and electric heating; Central air conditioning
- Interior features: Crawl space basement; 5 total rooms
- Laundry & utility: Main level laundry room, approximately 13 x 5
Neighborhood map
What this means for you Summary
Snapshot
- This is a 3-bed/1.0-bath single-family listed at $325k.
Deal economics
- At list price, monthly cash flow is $198 ($2k/yr) — positive.
- The deal already cash-flows at list — no discount required.
- To meet the 1% rule (rent ≥ 1% of price), the offer needs to be $300k (7.8% below list).
- Recommended offer: $300k (7.8% below list) — sets the bar for 1% rule.
- Cap rate 7.0% vs local median 3.0% in West Chicago — top-decile yield for the area; either an underpriced asset or a hidden risk that comps aren't pricing in. Stress-test before assuming the spread holds.
Location & tenants
- Location reads 64/100 on livability (#731 in IL) — a middle-class / working-renter tenant base. Strengths: housing A+, crime A, employment A-; Watch: amenities F, commute F, health & safety F.
- Chsd 94 (suburban): math 20% / reading 21% proficiency, ranked #378 of 620 in IL (top 61%) — low school quality limits family demand, transient renter base, plan for 1-2y turnover.
- Zoned schools: Pioneer Elem School (math 2% / reading 2%, grade F, #1,927 of 2,056 statewide, top 100%, 263 students, 0% FRL); Leman Middle School (math 11% / reading 12%, grade F, #571 of 665 statewide, top 86%, 1,124 students, 0% FRL); West Chicago Comm High School (math 20% / reading 21%, grade F, #350 of 693 statewide, top 51%, 2,076 students, 0% FRL).
- Market conditions: 50 active listings in the ZIP; 1 comparable units currently listed for rent nearby; 1,378 units permitted in DuPage County in 2024 (594 in 5+ unit buildings).
Forward outlook
- Local home prices are declining (-3.0%/yr); year-one equity from $2k of loan paydown is wiped out by about $10k of value loss. Plan a longer hold.
Negotiation context
- It's been on market 15 days — a 2% lower offer ($320k) is reasonable based on typical stale-listing flexibility.
- 6 sale attempts since 15y ago with the ask held roughly flat each time — persistent listings suggest the price (not the market) is what's stuck; bring a comps-based counter.
- Current owner paid $213k; list at $325k implies a 53% gain — meaningful room to come down on a strong offer.
Questions for the listing agent
- Built in 1960 — when were the roof, HVAC, electrical panel, plumbing, and water heater last replaced?
- Is there a deadline driving the sale (1031 exchange, divorce, estate, relocation)? That informs how much negotiation room exists.
- Schools are F-rated, which usually means shorter tenancies and higher turnover. Who's the typical renter profile here, and what's been the actual vacancy rate?
- The area grade is low — what's the realistic commute time and amenity access for the typical tenant pool here? Any planned neighborhood developments (good or bad) we should know about?
- What's the average days-on-market for RENTAL listings here right now (not sales)? A rising rental-DOM trend means longer vacancies and softer asking-rent achievability than the comps imply.
- What's the recent tenant-quality profile in this submarket — average credit score on applications, eviction rate, late-payment / NSF rate, and stable-employment percentage? A property-management company in the area should have these aggregated.
- How much new for-sale + rental construction is in the pipeline within 1–3 miles? Heavy new supply typically softens prices + rents 12–24 months out; constrained supply supports both.
Investment metrics
- 1% rule
- 0.92% ✗
- Cap rate
- 7.02%
- Cash-on-cash
- 2.61%
- DSCR
- 1.12
- GRM
- 9.0
CMA / ARV
- ARV (on-the-fly)
- $274,664
- Comps found
- 10
Show comp detail 10 sales within ~0.75 mi
| Address | Dist | Beds/Ba | Sqft | Sold | Price | $/sf | Match |
|---|---|---|---|---|---|---|---|
| 623 Lincoln Ave | 0.20mi | 3/1.0 | 940 (-5%) | 9mo | $247,000 | $263 | 75 |
| 711 Town Rd | 0.35mi | 3/1.5 | 988 (0%) | 9mo | $315,000 | $319 | 74 |
| 619 Parkside Ave | 0.23mi | 3/1.0 | 1,000 (+1%) | 21mo | $165,000 | $165 | 70 |
| 710 Lyman St | 0.27mi | 3/1.5 | 1,044 (+6%) | 13mo | $305,000 | $292 | 65 |
| 133 W Lester St | 0.56mi | 3/1.0 | 989 (+0%) | 11mo | $270,000 | $273 | 64 |
| 822 Parkside Ave | 0.47mi | 3/1.0 | 900 (-9%) | 9mo | $250,000 | $278 | 56 |
| 246 W Pomeroy St | 0.36mi | 2/1.0 (-1) | 960 (-3%) | 23mo | $275,000 | $286 | 54 |
| 209 E Blair St | 0.65mi | 3/2.0 | 1,124 (+14%) | 10mo | $360,000 | $320 | 35 |
| 202 Parker Ave | 0.70mi | 3/2.0 | 1,116 (+13%) | 10mo | $305,000 | $273 | 33 |
| 350 | 0.69mi | 3/2.0 | 1,123 (+14%) | 22mo | $280,000 | $249 | 23 |
Match score weights: distance 35% · size 25% · config 20% · recency 20%. Top-matched comps best support the ARV.
Projected returns pro-forma
-3.0% appreciation · 3.0% rent growth · sell at horizon
- IRR
- -12.2%
- Equity multiple
- 0.56×
- Total profit
- $-40,041
- Equity at exit
- $48,459
- IRR
- -3.1%
- Equity multiple
- 0.80×
- Total profit
- $-18,622
- Equity at exit
- $28,100
Cash invested: $91,000 (down + closing). Projections, not guarantees.
Landlord ↔ Tenant lean methodology
- Overall (STATE)
- 43 Moderately Tenant-Leaning
- State Illinois
- 43 Moderately Tenant-Leaning · D+7
- County
- — inherits STATE
- City
- — inherits STATE
ZIP-level market 60185
- Active inventory
- 50
- Price-to-rent
- 9.0×
Monthly cashflow live
- Estimated rent
- $2,995 medium interval (Pro) →
- Mortgage (P&I)
- −$1,704
- Tax from tax record
- −$328 /mo · $3,937/yr
- Insurance
- −$135
- HOA
- −$0
- Vacancy / Maint / Mgmt
- −$629
- Net cashflow
- $198
Break-even live
Sensitivity live
| Price | -10% $382 | -5% $290 | +0% $198 | +5% $106 | +10% $14 |
|---|---|---|---|---|---|
| Rent | -10% $-38 | -5% $80 | +0% $198 | +5% $317 | +10% $435 |
| Rate | -1.0pp $362 | -0.5pp $281 | base $198 | +0.5pp $114 | +1.0pp $28 |
UW: 25.0% down · 7.5% · 30yr · 1.5% tax · 5.0% vac · 8.0% maint · 8.0% mgmt
Financing live
Cash to close
- Down payment
- $81,250
- Closing costs
- $9,750
- Reserves months
- —
- Total cash needed
- —
Loan-product check · same deal, 3 products live
Conventional
25% down · 7.5% · 30yr
- Down + closing
- —
- Monthly P&I
- —
- Monthly cashflow
- —
- DSCR
- —
- Eligible?
- —
Personal DTI + credit; lowest rate.
DSCR
20% down · 8.5% · 30yr
- Down + closing
- —
- Monthly P&I
- —
- Monthly cashflow
- —
- DSCR
- —
- Eligible?
- —
No personal income docs; deal must DSCR.
Hard money
10% down · 12.0% · 12mo
- Down + closing
- —
- Monthly P&I
- —
- Monthly cashflow
- —
- DSCR
- —
- Eligible?
- —
Short-term bridge; refi at stabilization.
Rent comps 1 comps
| Address | Beds | Baths | Sqft | Rent | $/sqft | DOM | Units | Dist |
|---|---|---|---|---|---|---|---|---|
| 519 Lawrence Ave Roselle, IL | 2.0 | 1.0–2.0 | 825 | $2,995 | $3.63 | 0d | 20 | 1.29mi |
Listing history 28 events
-
2026-06-08days on market $325,000 Active 15 DOM
-
2026-06-07days on market $325,000 Active 14 DOM
-
2026-06-04days on market $325,000 Active 11 DOM
-
2026-06-03days on market $325,000 Active 10 DOM
-
2026-06-02days on market $325,000 Active 9 DOM
-
2026-06-01days on market $325,000 Active 8 DOM
-
2026-05-31days on market $325,000 Active 7 DOM
-
2026-05-22$325,000 Active
-
2022-10-07soldstatus $213,000 Closed 62-char remark
Show marketing remark (62 chars)
Spacious home updated 2 years ago some recent 3 bedrooms
-
2022-08-26historical Contingent - No Showings 62-char remark
Show marketing remark (62 chars)
Spacious home updated 2 years ago some recent 3 bedrooms
-
2022-08-18status Active 62-char remark
Show marketing remark (62 chars)
Spacious home updated 2 years ago some recent 3 bedrooms
-
2022-07-23status Pending 62-char remark
Show marketing remark (62 chars)
Spacious home updated 2 years ago some recent 3 bedrooms
-
2022-07-12$212,000 Active 62-char remark
Show marketing remark (62 chars)
Spacious home updated 2 years ago some recent 3 bedrooms
-
2014-02-13soldstatus $102,000
-
2013-12-02status Contingent (Do Not Show)
-
2013-12-02historical
-
2013-11-21status Contingent (Do Not Show)
-
2013-11-21New
-
2012-03-02historical
-
2011-12-06price Price Change
-
2011-11-22price Price Change
-
2011-11-14price Price Change
-
2011-11-02price Price Change
-
2011-09-18status Active
-
2011-09-13historical
-
2011-09-02New
-
2001-08-24soldstatus $134,000
-
1990-12-27soldstatus $84,500
ⓘ Source: listings_history table (triggers on properties + properties_extension) + one-shot
backfill from property_details.listing_events for pre-trigger history.
Tax reassessment forecast IL · Partial reset (capped growth)
- Current annual tax
- $3,937 · $328/mo
- Projected year-2 tax
- $5,657 · $471/mo
- Expected delta
- +$1,720/yr (+$143/mo · 43.7%)
ⓘ Screening estimate from a state-policy table — verify with the county assessor before closing.
Climate risk First Street
- Flood 1/10 Low FEMA zone X (unshaded) · 0% chance over 30 yrs
- Wildfire 1/10 Low
- Heat 3/10 Moderate 7 d/yr ≥103°F today · 15 d/yr by 30 yrs out
- Wind 2/10 Low 0% chance of damaging wind over 30 yrs
- Air quality 3/10 Moderate 3 unhealthy d/yr today · 4 by 30 yrs out
Nearby sold comps map
Loading sold comps map…
Walkable amenities ~0.75 mi
Loading nearby amenities…
Taxation est. · year 1
- Rental income
- $35,940
- − Mortgage interest
- −$18,205
- − Property taxes
- −$3,937
- − Insurance
- −$1,625
- − Repairs & maintenance
- −$2,875
- − Management
- −$2,875
- − Depreciation
- −$9,455
- Taxable loss
- −$3,032
- Est. tax savings @ 24.0%
- +$728
- After-tax cash flow
- $3,106/yr
For passive investors: Depreciation is non-cash, so a rental often shows a tax loss while cash-flowing — sheltering income. Rental losses are passive: they offset passive income freely, and up to $25,000/yr can offset ordinary (W-2) income if you actively participate and your MAGI is under $100k (phasing out to $0 by $150k); unused losses carry forward. On sale, claimed depreciation is recaptured at up to 25%, and gains may owe capital-gains tax (a 1031 exchange can defer both). Figures are a year-1 estimate at your 24.0% rate — not tax advice; consult a CPA.
Schools (NCES district)
- District
- Chsd 94
- NCES district ID
- 1740440
- Math proficiency
- 20% ▼ -8.00%
- Reading proficiency
- 21% ▼ -7.00%
- Median HH income
- $64,377
- Composite
- 19.71/100
- National rank
- #8719
- State rank
- #378 of 620 in IL
Livability — West Chicago
- Score
- 64/100
- State rank
- #731
- US rank
- #14844
Category grades
Schools grade is shown separately in the Schools card above.
Census & demographics
- Census place
- West Chicago, IL
- City population
- 33,711
- Population (ZIP)
- 33,711
Population outlook (DuPage County) Hauer SSP2
- Today (2025)
- 960,187 people
- By 2030
- 965,850 · +0.6%
- By 2040
- 965,812 · +0.6%
- By 2050
- 954,890 · -0.6%
- By 2075
- 910,185 · -5.2%
- By 2100
- 816,255 · -15.0%
Race, ethnicity, and origin ACS 2023
- Neighborhood character
- Diverse neighborhood (Simpson 0.62)
- Race & ethnicity
- White 45% Hispanic / Latino 41% Two or more races 14% Asian 8% Black 2%
- Hispanic origin (detail)
- Mexican 38%
- Common ancestry
- Romanian 6% Slovak 2% Italian 1%
- Foreign-born
- 27% · Canada, Jamaica, China
- Languages at home
- 56% English-only · Spanish 35% Other Indo-European 4% Tagalog/Filipino 2%
Political lean MEDSL · DuPage
- 2024 margin
- D (+13.3) · D 55.9% · R 42.5% · Other 1.6%
- 2008→2024 swing
- +2.5pp toward D · 2008: 10.8pp · 2024: 13.3pp
- All cycles
- 2024: D+13.3 2020: D+18.1 2016: D+14.1 2012: D+1.0 2008: D+10.8
Not yet ingested
- Civics
- —
Market trends
- HPI YoY
- ▼ -131.62%
- Current HPI
- 202.1482
- Rent YoY
- —
- Metro
- —
- State GDP YoY
- ▲ 1.59%
- F500 in state
- 60
Industry mix (Fortune 500 HQ in IL)
| Industry | F500 HQs | Revenue |
|---|---|---|
| Insurance | 4 | $201B |
|
||
| Consumer Goods | 4 | $87B |
|
||
| Industrial Machinery | 3 | $64B |
|
||
| Healthcare | 2 | $55B |
|
||
| Retail / Pharmacy | 1 | $148B |
|
||
| Agriculture / Food | 1 | $86B |
|
||
Price history
+284.6% since first listed21 events — show timeline
- 2026-05-22 Listed $325,000 MRED as Distributed by MLS Grid
- 2022-10-07 Sold (MLS) $213,000 MRED as Distributed by MLS Grid
- 2022-08-26 Contingent — MRED as Distributed by MLS Grid
- 2022-08-18 Relisted — MRED as Distributed by MLS Grid
- 2022-07-23 Pending — MRED as Distributed by MLS Grid
- 2022-07-12 Listed $212,000 MRED as Distributed by MLS Grid
- 2014-02-13 Sold (Public Records) $102,000 Public Records
- 2013-12-02 Pending — MRED as Distributed by MLS Grid
- 2013-12-02 Listing Removed — MRED as Distributed by MLS Grid
- 2013-11-21 Pending — MRED as Distributed by MLS Grid
- 2013-11-21 Listed — MRED as Distributed by MLS Grid
- 2012-03-02 Listing Removed — MRED as Distributed by MLS Grid
- 2011-12-06 Price Changed — MRED as Distributed by MLS Grid
- 2011-11-22 Price Changed — MRED as Distributed by MLS Grid
- 2011-11-14 Price Changed — MRED as Distributed by MLS Grid
- 2011-11-02 Price Changed — MRED as Distributed by MLS Grid
- 2011-09-18 Relisted — MRED as Distributed by MLS Grid
- 2011-09-13 Listing Removed — MRED as Distributed by MLS Grid
- 2011-09-02 Listed — MRED as Distributed by MLS Grid
- 2001-08-24 Sold (Public Records) $134,000 Public Records
- 1990-12-27 Sold (Public Records) $84,500 Public Records
Property tax history
+1.1%/yrLatest (2024): $3,937 · +6.8% YoY. Source: county tax records.
Cash-flow waterfall
monthlySold comps — $/sqft
last 12 mo · ≤1 miLoading sold comps…