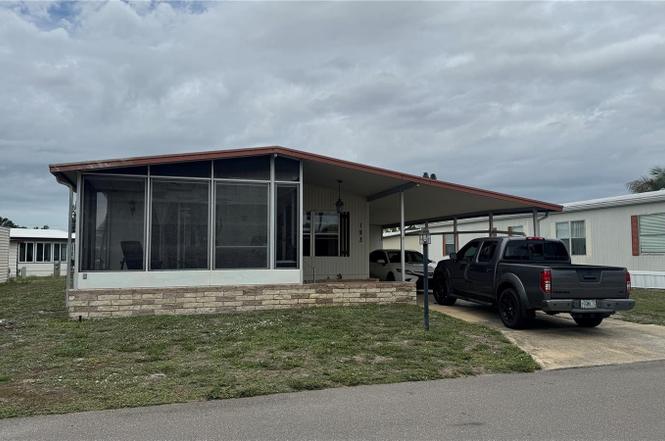
6710 36th Ave E Lot 193 · Ellenton, FL
Flood risk 1/10 · Minimal
- FEMA flood zone
- X (unshaded)
- Chance of flooding over 30 yrs
- 0.0%
- Est. flood insurance / yr
- $507 – $1,088
Fire risk 2/10 · Minimal
- Est. fire insurance / yr
- $947 – $1,759
Heat risk 10/10 · Severe
- Hot days now (above 107°F)
- 7 days/yr
- Hot days in 30 yrs
- 29 days/yr
Wind risk 10/10 · Severe
- Chance of severe wind over 30 yrs
- 99.0%
Air-quality risk 3/10 · Minor
- Unhealthy air days now
- 3 days/yr
- Unhealthy air days in 30 yrs
- 3 days/yr
Risk factors via First Street. Map © Google.
Why this score? — see what drove the B+ grade
The composite is a weighted blend of 9 inputs, each scored 0–100. Each bar is that input's sub-score; the figure is the points it added to the 100-point composite (weight × sub-score).
- Cash flow +30.0/30.0
- ARV discount +13.5/15.0
- 1% rule +10.0/10.0
- DSCR +10.0/10.0
- Schools +4.4/10.0
- Livability +3.8/5.0
- Condition / age +2.5/5.0
- Rent growth +1.8/5.0
- Appreciation +0.0/10.0
$122,500
🖨 Deal sheet 📄 Offer letter ✓ Due diligence
Listing remarks
Best price property in Shadow Brook * 2 Bedrooms * 2 Baths * Unfurnished and ready for a new owner * Shadow Brook is a planned Mobile Home Condominium subdivision with reasonable rules; reasonable prices; and realistic deed restrictions * Pets are welcomed (2 maximum) * Excellent location for commuters to St Petersburg; Ruskin; Sun City; Palmetto; Parrish; Ellenton; Bradenton; Sarasota; and Tampa * Being sold "As Is With Right To Inspect Only" * Should any repairs or improvements be needed to convey this property (for any reason whatsoever) they will be the sole responsibility of the Buyer.
Key facts
- 4,400 sq ft lot
- Parking
- Community pool
Property features AI
Finance
- Other: Deed-restricted community; Buyer approval required for association
- Financial info: Lease restrictions apply; Total annual fees: $2,600 (total monthly approx. $216.67)
- HOA & community: Association: Newby Management; Clubhouse and pool; Recreation facilities including shuffleboard court; Association requires buyer approval; On-site property manager; Pets allowed (cats and dogs); Quarterly condo/association fees: $217 monthly equivalent (quarterly fee $650); Association fees cover cable TV, internet, pool, management, sewer, trash, water, common area taxes and recreational facilities
Exterior
- Parking: Driveway; Carport with 1 space
- Utilities: Private water; Private sewer; Cable connected; Electricity connected; Sewer connected; Water connected; Public utilities available
- Home design: Manufactured home (double wide); One story; South-facing entry
- Construction: Frame construction; Roof over; Pillar/post/pier foundation; Completed condition
- Exterior features: Front porch; Screened porch; Porch; Exterior storage; Shed(s)
Interior
- Kitchen: Dishwasher; Disposal; Range; Refrigerator
- Bedrooms: 2 bedrooms
- Flooring: Carpet
- Bathrooms: 2 full bathrooms
- Heating & cooling: Central heating; Central air conditioning
- Interior features: Ceiling fans; Formal dining area; Window treatments
- Laundry & utility: Laundry room; Other laundry area
Neighborhood map
What this means for you Summary
Snapshot
- This is a 2-bed/1.0-bath manufactured listed at $122k.
Deal economics
- At list price, monthly cash flow is $717 ($9k/yr) — positive.
- The deal already cash-flows at list — no discount required.
- Meets the 1% rule at list price ($2k rent vs $122k).
- Cap rate 13.3% vs local median 4.5% in Ellenton — top-decile yield for the area; either an underpriced asset or a hidden risk that comps aren't pricing in. Stress-test before assuming the spread holds.
Location & tenants
- Location reads 76/100 on livability (#232 in FL, #3,666 nationally) — a middle-class / working-renter tenant base. Strengths: cost of living A+, housing A+, health & safety A+; Watch: amenities F, commute F.
- Manatee (suburban): math 54% / reading 50% proficiency, ranked #26 of 73 in FL (top 36%) — acceptable for families but not a draw, mixed tenant base, ~2y average lease.
- Zoned schools: James Tillman Elementary Magnet School (math 65% / reading 34%, grade D, #1,088 of 2,144 statewide, top 53%, 520 students, 74% FRL); Palmetto High School (math 22% / reading 36%, grade F, #456 of 667 statewide, top 68%, 2,100 students, 61% FRL) — zoned schools average 68% FRL vs 51% district-wide (17 pts higher); higher-poverty schools than district average — tighter screening recommended.
- Zoned-school proficiency averages 39% at this address vs 52% district-wide (-13 pts) — the specific schools serving this property underperform the Manatee average; the district grade overstates school quality for this exact location.
- Market conditions: Rents soft (-3.0%/yr); 1160 active listings in the ZIP; 7 comparable units currently listed for rent nearby; rentals leasing fast (median 4d on market — plan ~1-2 weeks tenant-placement turnaround); solid renter incomes; 7,472 units permitted in Manatee County in 2024 (1,782 in 5+ unit buildings).
- This rent runs 33% of the median local income ($78k/yr) — at the standard rent-burdened threshold; future hikes will face affordability resistance.
Forward outlook
- Local home prices are declining (-3.0%/yr); year-one equity from $847 of loan paydown is wiped out by about $4k of value loss. Plan a longer hold.
- Manatee County population projected at +43% by 2050 — long-run rental-demand tailwind backs the buy-and-hold thesis.
- At projected returns (-3.0% appreciation + 0.0% rent growth), your $34k cash investment doubles in ~6 years — after that, you're playing with house money.
Negotiation context
- Only 1 days on market — expect competitive offers; lowballing is unlikely to land.
- 2 sale attempts since 9y ago with the ask held roughly flat each time — persistent listings suggest the price (not the market) is what's stuck; bring a comps-based counter.
- Current owner paid $58k; list at $122k implies a 111% gain — meaningful room to come down on a strong offer.
Risks & watch-outs
- Climate carrying-cost: severe wind risk, 99% chance of damaging wind over 30y; extreme-heat days projected 7→29/yr by 2055 (HVAC capex compounding) — expect insurance premiums to compound above CPI over the hold.
Questions for the listing agent
- What does the HOA fee cover, when was the last increase, and are there any pending special assessments or reserve-fund shortfalls?
- Is there a deadline driving the sale (1031 exchange, divorce, estate, relocation)? That informs how much negotiation room exists.
- Schools are D-rated, which usually means shorter tenancies and higher turnover. Who's the typical renter profile here, and what's been the actual vacancy rate?
- What's the average days-on-market for RENTAL listings here right now (not sales)? A rising rental-DOM trend means longer vacancies and softer asking-rent achievability than the comps imply.
- What's the recent tenant-quality profile in this submarket — average credit score on applications, eviction rate, late-payment / NSF rate, and stable-employment percentage? A property-management company in the area should have these aggregated.
- How much new for-sale + rental construction is in the pipeline within 1–3 miles? Heavy new supply typically softens prices + rents 12–24 months out; constrained supply supports both.
Investment metrics
- 1% rule
- 1.75% ✓
- Cap rate
- 13.32%
- Cash-on-cash
- 25.09%
- DSCR
- 2.12
- GRM
- 4.8
CMA / ARV
- ARV (on-the-fly)
- $141,504
- Comps found
- 10
Show comp detail 10 sales within ~0.75 mi
| Address | Dist | Beds/Ba | Sqft | Sold | Price | $/sf | Match |
|---|---|---|---|---|---|---|---|
| 6710 36th Ave E #106 | 0.00mi | 2/2.0 | 1,056 (0%) | 0mo | $141,250 | $134 | 96 |
| 6710 36 Ave #277 | 0.00mi | 2/2.0 | 1,056 (0%) | 6mo | $117,000 | $111 | 91 |
| 6710 36th Ave E #392 | 0.00mi | 2/2.0 | 1,056 (0%) | 8mo | $190,000 | $180 | 90 |
| 6710 36th Ave E #59 | 0.00mi | 2/2.0 | 1,056 (0%) | 8mo | $144,000 | $136 | 90 |
| 6710 36th Ave E #104 | 0.00mi | 2/2.0 | 1,108 (+5%) | 1mo | $144,500 | $130 | 87 |
| 6710 36th Ave E #350 | 0.00mi | 2/2.0 | 1,000 (-5%) | 5mo | $160,000 | $160 | 83 |
| 6710 36th Ave E #37 | 0.00mi | 2/2.0 | 1,152 (+9%) | 7mo | $125,000 | $109 | 75 |
| 6710 36th Ave E #323 | 0.00mi | 2/2.0 | 1,152 (+9%) | 10mo | $165,000 | $143 | 72 |
| 6710 36th Ave E #349 | 0.00mi | 2/2.0 | 936 (-11%) | 11mo | $122,000 | $130 | 68 |
| 6710 36th Ave E #222 | 0.00mi | 2/2.0 | 1,211 (+15%) | 10mo | $148,000 | $122 | 63 |
Match score weights: distance 35% · size 25% · config 20% · recency 20%. Top-matched comps best support the ARV.
Projected returns pro-forma
-3.0% appreciation · 0.0% rent growth · sell at horizon
- IRR
- 14.9%
- Equity multiple
- 1.57×
- Total profit
- $19,655
- Equity at exit
- $18,265
- IRR
- 21.1%
- Equity multiple
- 2.52×
- Total profit
- $52,091
- Equity at exit
- $10,592
Cash invested: $34,300 (down + closing). Projections, not guarantees.
Landlord ↔ Tenant lean methodology
- Overall (STATE)
- 87 Strongly Landlord-Friendly
- State Florida
- 87 Strongly Landlord-Friendly · R+3
- County
- — inherits STATE
- City
- — inherits STATE
ZIP-level market 34221
- Rents YoY
- -3.0%
- Active inventory
- 1160
- Price-to-rent
- 4.8×
Monthly cashflow live
- Estimated rent
- $2,146 high interval (Pro) →
- Mortgage (P&I)
- −$642
- Tax from tax record
- −$69 /mo · $827/yr
- Insurance
- −$51
- HOA
- −$216
- Vacancy / Maint / Mgmt
- −$451
- Net cashflow
- $717
Break-even live
UW: 25.0% down · 7.5% · 30yr · 1.5% tax · 5.0% vac · 8.0% maint · 8.0% mgmt
Financing live
Cash to close
- Down payment
- $30,625
- Closing costs
- $3,675
- Reserves months
- —
- Total cash needed
- —
Loan-product check · same deal, 3 products live
Conventional
25% down · 7.5% · 30yr
- Down + closing
- —
- Monthly P&I
- —
- Monthly cashflow
- —
- DSCR
- —
- Eligible?
- —
Personal DTI + credit; lowest rate.
DSCR
20% down · 8.5% · 30yr
- Down + closing
- —
- Monthly P&I
- —
- Monthly cashflow
- —
- DSCR
- —
- Eligible?
- —
No personal income docs; deal must DSCR.
Hard money
10% down · 12.0% · 12mo
- Down + closing
- —
- Monthly P&I
- —
- Monthly cashflow
- —
- DSCR
- —
- Eligible?
- —
Short-term bridge; refi at stabilization.
Rent comps 7 comps
| Address | Beds | Baths | Sqft | Rent | $/sqft | DOM | Units | Dist |
|---|---|---|---|---|---|---|---|---|
| 6010 33rd Dr E Palmetto, FL | 3.0 | 2.0 | 1287 | $2,115 | $1.64 | 3d | 1 | 0.41mi |
| 3303 54th St E Palmetto, FL | 3.0 | 2.0 | 1285 | $2,000 | $1.56 | 3d | 1 | 0.78mi |
| 6045 Bird Key Pl Palmetto, FL | 1.0–3.0 | 1.0–2.0 | 986 | $2,005 | $2.03 | 3d | 220 | 0.88mi |
| 9940 Mahaffey DR Palmetto, FL | 1.0–3.0 | 1.0–3.0 | 1106 | $1,700 | $1.54 | 23d | 1 | 0.88mi |
| 5029 Rocky Coast Pl Palmetto, FL | 3.0 | 2.0 | 1482 | $2,400 | $1.62 | 10d | 1 | 1.06mi |
| 4117 84th Ct E Palmetto, FL | 3.0 | 2.0 | 1448 | $2,466 | $1.70 | 21d | 1 | 1.19mi |
| 5413 Badini Way Palmetto, FL | 3.0 | 2.0 | 1420 | $2,550 | $1.80 | 3d | 1 | 1.33mi |
HOA detail
- Monthly dues
- $216 · $2,592/yr
Listing history 3 events
-
2026-06-19remarks 613-char remark
-
2026-06-17remarks 42-char remark
-
2026-06-17$122,500 Active 1 DOM
ⓘ Source: listings_history table (triggers on properties + properties_extension) + one-shot
backfill from property_details.listing_events for pre-trigger history.
Tax reassessment forecast FL · Resets to sale price
- Current annual tax
- $827 · $69/mo
- Projected year-2 tax
- $1,017 · $85/mo
- Expected delta
- +$190/yr (+$16/mo · 23.0%)
ⓘ Screening estimate from a state-policy table — verify with the county assessor before closing.
Climate risk First Street
- Flood 1/10 Low FEMA zone X (unshaded) · 0% chance over 30 yrs
- Wildfire 2/10 Low
- Heat 10/10 Extreme 7 d/yr ≥107°F today · 29 d/yr by 30 yrs out
- Wind 10/10 Extreme 99% chance of damaging wind over 30 yrs
- Air quality 3/10 Moderate 3 unhealthy d/yr today · 3 by 30 yrs out
Nearby sold comps map
Loading sold comps map…
Walkable amenities ~0.75 mi
Loading nearby amenities…
Taxation est. · year 1
- Rental income
- $25,756
- − Mortgage interest
- −$6,862
- − Property taxes
- −$827
- − Insurance
- −$612
- − Repairs & maintenance
- −$2,060
- − Management
- −$2,060
- − HOA
- −$2,592
- − Depreciation
- −$3,564
- Taxable income
- $7,178
- Est. tax owed @ 24.0%
- −$1,723
- After-tax cash flow
- $6,884/yr
For passive investors: Depreciation is non-cash, so a rental often shows a tax loss while cash-flowing — sheltering income. Rental losses are passive: they offset passive income freely, and up to $25,000/yr can offset ordinary (W-2) income if you actively participate and your MAGI is under $100k (phasing out to $0 by $150k); unused losses carry forward. On sale, claimed depreciation is recaptured at up to 25%, and gains may owe capital-gains tax (a 1031 exchange can defer both). Figures are a year-1 estimate at your 24.0% rate — not tax advice; consult a CPA.
Schools (NCES district)
- District
- Manatee
- NCES district ID
- 1201230
- Math proficiency
- 54% ▼ -6.00%
- Reading proficiency
- 50% ▼ -2.00%
- Median HH income
- $49,607
- Composite
- 44.43/100
- National rank
- #2806
- State rank
- #26 of 73 in FL
Livability — Ellenton
- Score
- 76/100
- State rank
- #232
- US rank
- #3666
Category grades
Schools grade is shown separately in the Schools card above.
Census & demographics
- County
- Manatee County · 416,364 people
- City population
- 14,819
- Metro
- North Port-Sarasota-Bradenton, FL
- Population (ZIP)
- 56,208
- Household income
- $77,712
- Rent vs Own
- Severe rent burden
- 1193.0
Population outlook (Manatee County) Hauer SSP2
- Today (2025)
- 447,342 people
- By 2030
- 488,911 · +9.3%
- By 2040
- 567,934 · +27.0%
- By 2050
- 637,995 · +42.6%
- By 2075
- 781,970 · +74.8%
- By 2100
- 848,272 · +89.6%
Race, ethnicity, and origin ACS 2023
- Neighborhood character
- Diverse neighborhood (Simpson 0.58)
- Race & ethnicity
- White 59% Hispanic / Latino 22% Black 14% Two or more races 11%
- Hispanic origin (detail)
- Mexican 14% Puerto Rican 3%
- Common ancestry
- Romanian 2% Lithuanian 2% Italian 2%
- Foreign-born
- 10% · Canada, Dominican Republic, Jamaica
- Languages at home
- 81% English-only · Spanish 16% Other Indo-European 1%
Political lean MEDSL · Manatee
- 2024 margin
- Strong R (+23.5) · D 37.9% · R 61.4%
- 2008→2024 swing
- -16.5pp toward R · 2008: -7.0pp · 2024: -23.5pp
- All cycles
- 2024: R+23.5 2020: R+16.1 2016: R+17.1 2012: R+12.5 2008: R+7.0
Not yet ingested
- Civics
- —
Market trends
- HPI YoY
- ▼ -383.53%
- Current HPI
- 302.1458
- Rent YoY
- ▼ -2.98%
- Metro
- North Port-Sarasota-Bradenton, FL
- State GDP YoY
- ▲ 3.28%
- F500 in state
- 36
Industry mix (Fortune 500 HQ in FL)
| Industry | F500 HQs | Revenue |
|---|---|---|
| Industrial Technology | 2 | $29B |
|
||
| Insurance | 2 | $17B |
|
||
| Retail | 1 | $60B |
|
||
| Technology Distribution | 1 | $58B |
|
||
| Homebuilding | 1 | $35B |
|
||
| Technology Manufacturing | 1 | $35B |
|
||
Price history
+181.6% since first listed6 events — show timeline
- 2026-06-17 Listed $122,500 Stellar MLS as Distributed by MLS Grid
- 2018-04-04 Listing Removed — Stellar MLS as Distributed by MLS Grid
- 2017-10-05 Listed $74,900 Stellar MLS as Distributed by MLS Grid
- 2001-11-21 Sold (Public Records) $58,000 Public Records
- 1997-03-18 Sold (Public Records) $45,000 Public Records
- 1993-06-09 Sold (Public Records) $43,500 Public Records
Property tax history
+1.3%/yrLatest (2025): $827 · +7.3% YoY. Source: county tax records.
Cash-flow waterfall
monthlySold comps — $/sqft
last 12 mo · ≤1 miLoading sold comps…