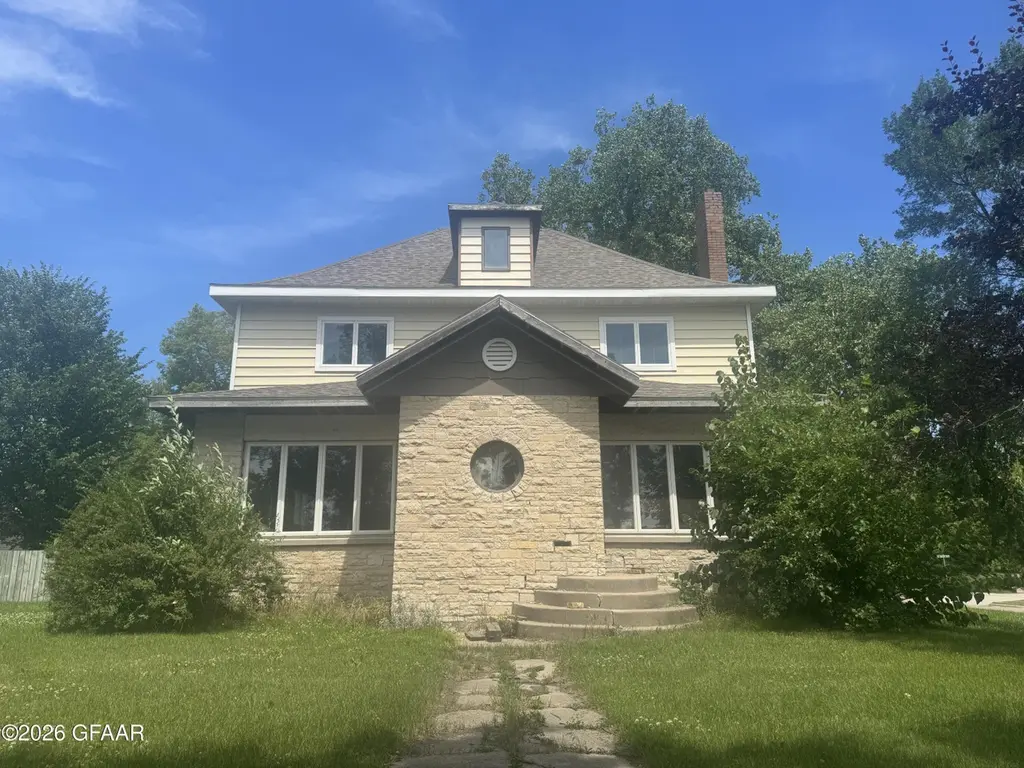
121 E 7th St · Crookston, MN
Flood risk 1/10 · Minimal
- FEMA flood zone
- —
- Chance of flooding over 30 yrs
- 0.0%
- Est. flood insurance / yr
- —
Fire risk 3/10 · Minor
- Est. fire insurance / yr
- $888 – $1,650
Heat risk 2/10 · Minimal
- Hot days now (above 96°F)
- 7 days/yr
- Hot days in 30 yrs
- 12 days/yr
Wind risk 1/10 · Minimal
- Chance of severe wind over 30 yrs
- —
Air-quality risk 3/10 · Minor
- Unhealthy air days now
- 3 days/yr
- Unhealthy air days in 30 yrs
- 3 days/yr
Risk factors via First Street. Map © Google.
Why this score? — see what drove the B grade
The composite is a weighted blend of 9 inputs, each scored 0–100. Each bar is that input's sub-score; the figure is the points it added to the 100-point composite (weight × sub-score).
- Cash flow +30.0/30.0
- 1% rule +10.0/10.0
- DSCR +10.0/10.0
- ARV discount +7.5/15.0
- Schools +4.1/10.0
- Livability +4.0/5.0
- Rent growth +2.5/5.0
- Condition / age +2.5/5.0
- Appreciation +0.0/10.0
$79,000
🖨 Deal sheet 📄 Offer letter ✓ Due diligence
Listing remarks MLS
Investor or flipper special! Bring your vision and complete this spacious 3-story, 4,000+ sq. ft. home. Packed with potential, it's ready for your custom design and finishing touches. Don't miss the opportunity - schedule your showing today!
Key facts
- 0.26 acre lot
- 2 garage spots
- Built 1903
Neighborhood map
What this means for you Summary
Snapshot
- This is a 4-bed/2.5-bath single-family listed at $79k.
Deal economics
- At list price, monthly cash flow is $662 ($8k/yr) — positive.
- The deal already cash-flows at list — no discount required.
- Meets the 1% rule at list price ($2k rent vs $79k).
- Recommended offer: $78k (1.5% below list) — sets the bar for market timing.
- Cap rate 16.3% vs local median 4.2% in Crookston — top-decile yield for the area; either an underpriced asset or a hidden risk that comps aren't pricing in. Stress-test before assuming the spread holds.
Location & tenants
- Location reads 79/100 on livability (#92 in MN, #2,097 nationally) — a middle-class / working-renter tenant base. Strengths: cost of living A+, housing A+, health & safety A+; Watch: amenities C-, commute F.
- Crookston Public School District (town): math 46% / reading 49% proficiency, ranked #151 of 301 in MN (top 50%) — families likely to look elsewhere, expect single-tenant / working-renter base with shorter leases.
- Market conditions: 51 active listings in the ZIP; 42 units permitted in Polk County in 2024 (0 in 5+ unit buildings).
Forward outlook
- Local home prices are declining (-3.0%/yr); year-one equity from $546 of loan paydown is wiped out by about $2k of value loss. Plan a longer hold.
- Polk County population projected to shrink 7% by 2050 — rents likely to lag national; underwrite the cash flow, not the appreciation.
- At projected returns (-3.0% appreciation + 3.0% rent growth), your $22k cash investment doubles in ~4 years — after that, you're playing with house money.
Negotiation context
- It's been on market 24 days — a 2% lower offer ($78k) is reasonable based on typical stale-listing flexibility.
- 4 sale attempts with the ask held roughly flat each time — persistent listings suggest the price (not the market) is what's stuck; bring a comps-based counter.
Risks & watch-outs
- Watch-outs: built in 1903 — expect roof / HVAC / electrical / plumbing capex.
Questions for the listing agent
- Built in 1903 — when were the roof, HVAC, electrical panel, plumbing, and water heater last replaced?
- Is there a deadline driving the sale (1031 exchange, divorce, estate, relocation)? That informs how much negotiation room exists.
- Schools are B-rated — typically a magnet for longer-tenancy family renters. What's the average tenant stay here, and is there a school-zone premium baked into asking?
- What's the average days-on-market for RENTAL listings here right now (not sales)? A rising rental-DOM trend means longer vacancies and softer asking-rent achievability than the comps imply.
- What's the recent tenant-quality profile in this submarket — average credit score on applications, eviction rate, late-payment / NSF rate, and stable-employment percentage? A property-management company in the area should have these aggregated.
- How much new for-sale + rental construction is in the pipeline within 1–3 miles? Heavy new supply typically softens prices + rents 12–24 months out; constrained supply supports both.
Investment metrics
- 1% rule
- 2.03% ✓
- Cap rate
- 16.35%
- Cash-on-cash
- 35.91%
- DSCR
- 2.60
- GRM
- 4.1
CMA / ARV
- ARV (median comp)
- $281,724
- List price
- $79,000
- Delta
- -71.96%
- Verdict
- UNDERPRICED
- Comps
- 4 within 1.0 mi
Show comp detail 1 sale within ~0.75 mi
| Address | Dist | Beds/Ba | Sqft | Sold | Price | $/sf | Match |
|---|---|---|---|---|---|---|---|
| 215 E 5th St | 0.16mi | 5/3.5 (+1) | 2,988 (-11%) | 23mo | $289,900 | $97 | 46 |
Match score weights: distance 35% · size 25% · config 20% · recency 20%. Top-matched comps best support the ARV.
Projected returns pro-forma
-3.0% appreciation · 3.0% rent growth · sell at horizon
- IRR
- 31.6%
- Equity multiple
- 2.33×
- Total profit
- $29,418
- Equity at exit
- $11,779
- IRR
- 38.8%
- Equity multiple
- 4.62×
- Total profit
- $80,147
- Equity at exit
- $6,830
Cash invested: $22,120 (down + closing). Projections, not guarantees.
Landlord ↔ Tenant lean methodology
- Overall (STATE)
- 46 Balanced
- State Minnesota
- 46 Balanced · D+2
- County
- — inherits STATE
- City
- — inherits STATE
ZIP-level market 56716
- Home prices YoY
- -22.0%
- Active inventory
- 51
- Price-to-rent
- 4.1×
Monthly cashflow live
- Estimated rent
- $1,602 medium interval (Pro) →
- Mortgage (P&I)
- −$414
- Tax from tax record
- −$157 /mo · $1,882/yr
- Insurance
- −$33
- HOA
- −$0
- Vacancy / Maint / Mgmt
- −$337
- Net cashflow
- $662
Break-even live
UW: 25.0% down · 7.5% · 30yr · 1.5% tax · 5.0% vac · 8.0% maint · 8.0% mgmt
Financing live
Cash to close
- Down payment
- $19,750
- Closing costs
- $2,370
- Reserves months
- —
- Total cash needed
- —
Loan-product check · same deal, 3 products live
Conventional
25% down · 7.5% · 30yr
- Down + closing
- —
- Monthly P&I
- —
- Monthly cashflow
- —
- DSCR
- —
- Eligible?
- —
Personal DTI + credit; lowest rate.
DSCR
20% down · 8.5% · 30yr
- Down + closing
- —
- Monthly P&I
- —
- Monthly cashflow
- —
- DSCR
- —
- Eligible?
- —
No personal income docs; deal must DSCR.
Hard money
10% down · 12.0% · 12mo
- Down + closing
- —
- Monthly P&I
- —
- Monthly cashflow
- —
- DSCR
- —
- Eligible?
- —
Short-term bridge; refi at stabilization.
Listing history 10 events
-
2026-05-08status Pending 241-char remark
Show marketing remark (241 chars)
Investor or flipper special! Bring your vision and complete this spacious 3-story, 4,000+ sq. ft. home. Packed with potential, it's ready for your custom design and finishing touches. Don't miss the opportunity - schedule your showing today!
-
2026-04-14$79,000 Active 241-char remark
Show marketing remark (241 chars)
Investor or flipper special! Bring your vision and complete this spacious 3-story, 4,000+ sq. ft. home. Packed with potential, it's ready for your custom design and finishing touches. Don't miss the opportunity - schedule your showing today!
-
2026-01-01historical
-
2025-08-29price $79,000
-
2025-08-29price $79,000
-
2025-07-11$86,000 Active
-
2025-07-11$86,000 Active
-
2004-02-16soldstatus $77,500
ⓘ Source: listings_history table (triggers on properties + properties_extension) + one-shot
backfill from property_details.listing_events for pre-trigger history.
Tax reassessment forecast MN · Partial reset (capped growth)
- Current annual tax
- $1,882 · $157/mo
- Projected year-2 tax
- $1,882 · $157/mo
- Expected delta
- $0/yr ($0/mo · 0.0%)
ⓘ Screening estimate from a state-policy table — verify with the county assessor before closing.
Climate risk First Street
- Flood 1/10 Low 0% chance over 30 yrs
- Wildfire 3/10 Moderate
- Heat 2/10 Low 7 d/yr ≥96°F today · 12 d/yr by 30 yrs out
- Wind 1/10 Low
- Air quality 3/10 Moderate 3 unhealthy d/yr today · 3 by 30 yrs out
Nearby sold comps map
Loading sold comps map…
Walkable amenities ~0.75 mi
Loading nearby amenities…
Taxation est. · year 1
- Rental income
- $19,230
- − Mortgage interest
- −$4,425
- − Property taxes
- −$1,882
- − Insurance
- −$395
- − Repairs & maintenance
- −$1,538
- − Management
- −$1,538
- − Depreciation
- −$2,298
- Taxable income
- $7,153
- Est. tax owed @ 24.0%
- −$1,717
- After-tax cash flow
- $6,227/yr
For passive investors: Depreciation is non-cash, so a rental often shows a tax loss while cash-flowing — sheltering income. Rental losses are passive: they offset passive income freely, and up to $25,000/yr can offset ordinary (W-2) income if you actively participate and your MAGI is under $100k (phasing out to $0 by $150k); unused losses carry forward. On sale, claimed depreciation is recaptured at up to 25%, and gains may owe capital-gains tax (a 1031 exchange can defer both). Figures are a year-1 estimate at your 24.0% rate — not tax advice; consult a CPA.
Schools (NCES district)
- District
- Crookston Public School District
- NCES district ID
- 2709720
- Math proficiency
- 46% ▼ -10.00%
- Reading proficiency
- 49% ▼ -7.00%
- Median HH income
- $49,756
- Composite
- 40.68/100
- National rank
- #3671
- State rank
- #151 of 301 in MN
Livability — Crookston
- Score
- 79/100
- State rank
- #92
- US rank
- #2097
Category grades
Schools grade is shown separately in the Schools card above.
Census & demographics
- Census place
- Crookston, MN
- Population (ZIP)
- 8,991
Population outlook (Polk County) Hauer SSP2
- Today (2025)
- 31,123 people
- By 2030
- 30,720 · -1.3%
- By 2040
- 29,806 · -4.2%
- By 2050
- 29,022 · -6.8%
- By 2075
- 27,972 · -10.1%
- By 2100
- 26,953 · -13.4%
Race, ethnicity, and origin ACS 2023
- Neighborhood character
- Predominantly White (79%)
- Race & ethnicity
- White 79% Hispanic / Latino 12% Two or more races 9% Native American 2% Asian 2% Black 1%
- Hispanic origin (detail)
- Mexican 10%
- Common ancestry
- Portuguese 28% Lithuanian 8% Romanian 3%
- Foreign-born
- 3% · Canada
- Languages at home
- 93% English-only · Spanish 6%
Political lean MEDSL · Polk
- 2024 margin
- Solid R (+33.8) · D 32.3% · R 66.0% · Other 1.7%
- 2008→2024 swing
- -38.3pp toward R · 2008: 4.6pp · 2024: -33.8pp
- All cycles
- 2024: R+33.8 2020: R+28.4 2016: R+29.0 2012: R+5.8 2008: D+4.6
Not yet ingested
- Civics
- —
Market trends
- HPI YoY
- ▼ -62.06%
- Current HPI
- 219.5106
- Rent YoY
- —
- Metro
- —
- State GDP YoY
- ▲ 2.41%
- F500 in state
- 34
Industry mix (Fortune 500 HQ in MN)
| Industry | F500 HQs | Revenue |
|---|---|---|
| Healthcare | 2 | $407B |
|
||
| Retail | 2 | $150B |
|
||
| Consumer Goods | 2 | $32B |
|
||
| Industrial Machinery | 2 | $6B |
|
||
| Agriculture | 1 | $40B |
|
||
| Healthcare / Medical Devices | 1 | $32B |
|
||
Price history
+1.9% since first listed10 events — show timeline
- 2026-05-08 Pending — NORTHSTARMLS as Distributed by MLS Grid
- 2026-05-08 Pending — GFAAR
- 2026-04-14 Listed $79,000 GFAAR
- 2026-04-14 Listed $79,000 NORTHSTARMLS as Distributed by MLS Grid
- 2026-01-01 Listing Removed — NORTHSTARMLS as Distributed by MLS Grid
- 2025-08-29 Price Changed $79,000 GFAAR
- 2025-08-29 Price Changed $79,000 NORTHSTARMLS as Distributed by MLS Grid
- 2025-07-11 Listed $86,000 GFAAR
- 2025-07-11 Listed $86,000 NORTHSTARMLS as Distributed by MLS Grid
- 2004-02-16 Sold (Public Records) $77,500 Public Records
Property tax history
-1.0%/yrLatest (2026): $1,882 · +7.9% YoY. Source: county tax records.
Cash-flow waterfall
monthlySold comps — $/sqft
last 12 mo · ≤1 miLoading sold comps…