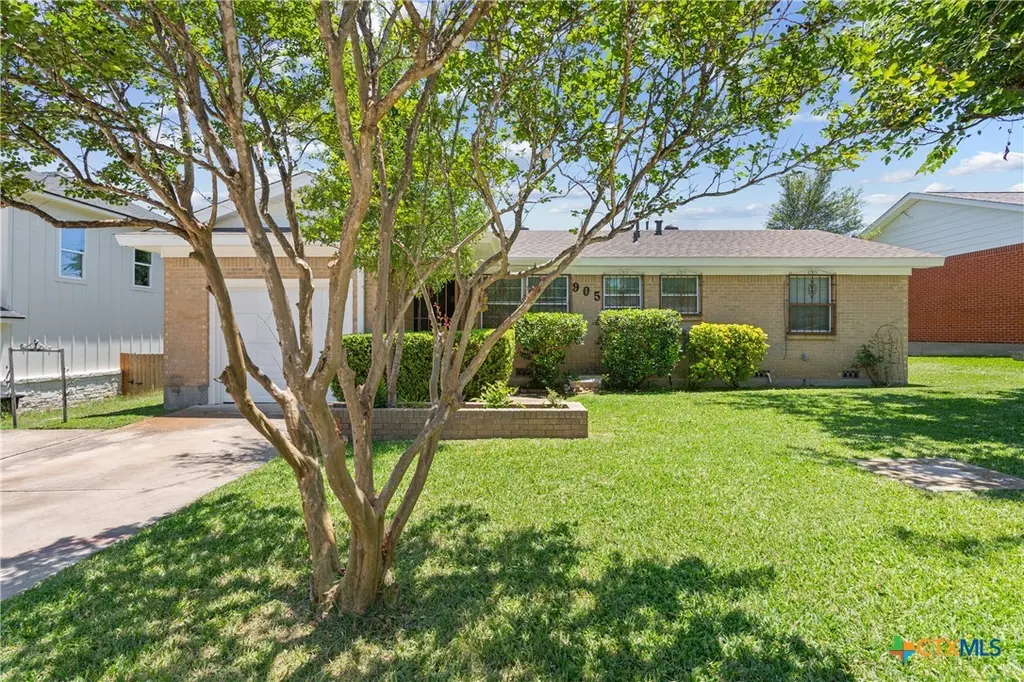
905 S 40th St · Temple, TX
Flood risk 1/10 · Minimal
- FEMA flood zone
- X (unshaded)
- Chance of flooding over 30 yrs
- 0.0%
- Est. flood insurance / yr
- $507 – $1,088
Fire risk 3/10 · Minor
- Est. fire insurance / yr
- $1,222 – $2,270
Heat risk 8/10 · Major
- Hot days now (above 108°F)
- 7 days/yr
- Hot days in 30 yrs
- 24 days/yr
Wind risk 6/10 · Moderate
- Chance of severe wind over 30 yrs
- 77.0%
Air-quality risk 1/10 · Minimal
- Unhealthy air days now
- 0 days/yr
- Unhealthy air days in 30 yrs
- 0 days/yr
Risk factors via First Street. Map © Google.
Why this score? — see what drove the C+ grade
The composite is a weighted blend of 9 inputs, each scored 0–100. Each bar is that input's sub-score; the figure is the points it added to the 100-point composite (weight × sub-score).
- Cash flow +21.9/30.0
- ARV discount +15.0/15.0
- 1% rule +7.1/10.0
- DSCR +7.0/10.0
- Livability +3.8/5.0
- Rent growth +3.4/5.0
- Schools +2.7/10.0
- Condition / age +2.5/5.0
- Appreciation +0.0/10.0
$120,000
🖨 Deal sheet (PDF) 📄 Offer letter ✓ Due diligence
Listing remarks MLS
really cute older home. this home has a certain charm. the 2 living areas really add nice space for the price. well maintained older brick home that needs new owners. Please make sure when you show that you open the gate and the front door is unlocked, leave the door unlocked and lock gate only.
Key facts
- Covered porch
- Storage buildings
- Large back yard
Tags
Property features AI
Finance
- Other: City lot with mature trees; Less than quarter acre; City street frontage; Fencing: back yard, chain link, privacy, wood
Exterior
- Parking: Garage (1 car)
- Utilities: Electricity available and on property; Public water; Public sewer; Public trash collection
- Home design: Single-story; Resale property
- Construction: Brick and masonry construction; Composition/shingle roof; Pillar/post/pier and slab foundation; Built (year source: assessor)
- Exterior features: Covered patio; Covered porch; Porch; Rain gutters; Storage; Outbuilding
Interior
- Kitchen: Dishwasher; Electric cooktop; Built-in oven; Oven; Range hood; Some electric appliances
- Flooring: Laminate; Tile; Vinyl
- Bathrooms: One full bathroom; One half bathroom
- Heating & cooling: Central heating (electric); Central air conditioning (electric, one unit)
- Interior features: Ceiling fans; Crown molding; Cathedral ceilings; High ceilings; Multiple living and dining areas; Open floorplan; Recessed lighting; Tub/shower; Vanity; Natural woodwork; Window treatments; Kitchen/Family room combo; Kitchen/Dining combo; Pantry; Walk-in pantry; Separate/formal dining room
- Laundry & utility: Washer hookup; Electric dryer hookup; Laundry located in kitchen
Neighborhood map
What this means for you Summary
Snapshot
- This is a 3-bed/2.0-bath single-family listed at $120k.
Deal economics
- At list price, monthly cash flow is $189 ($2k/yr) — positive.
- The deal already cash-flows at list — no discount required.
- Meets the 1% rule at list price ($1k rent vs $120k).
- Recommended offer: $118k (1.5% below list) — sets the bar for market timing.
- Cap rate 8.2% vs local median 3.6% in Temple — top-decile yield for the area; either an underpriced asset or a hidden risk that comps aren't pricing in. Stress-test before assuming the spread holds.
Location & tenants
- Location reads 75/100 on livability (#122 in TX, #3,814 nationally) — a middle-class / working-renter tenant base. Strengths: cost of living A+, housing A+, health & safety A+; Watch: schools C-, commute C-, crime D+.
- Temple ISD (urban): math 32% / reading 31% proficiency, ranked #590 of 826 in TX (top 71%) — families likely to look elsewhere, expect single-tenant / working-renter base with shorter leases; 66% free/reduced lunch — lower-income household profile, screen leases tightly.
- Market conditions: Rents rising (+3.4%/yr); 337 active listings in the ZIP; 40 comparable units currently listed for rent nearby; rentals at typical pace (median 16d on market — plan ~3-4 weeks tenant-placement turnaround); 3,222 units permitted in Bell County in 2024 (246 in 5+ unit buildings).
Forward outlook
- Local home prices are declining (-3.0%/yr); year-one equity from $830 of loan paydown is wiped out by about $4k of value loss. Plan a longer hold.
- Bell County population projected at +21% by 2050 — long-run rental-demand tailwind backs the buy-and-hold thesis.
Negotiation context
- It's been on market 19 days — a 2% lower offer ($118k) is reasonable based on typical stale-listing flexibility.
- 7 sale attempts since 14y ago with the ask held roughly flat each time — persistent listings suggest the price (not the market) is what's stuck; bring a comps-based counter.
- Current owner paid $55k; list at $120k implies a 118% gain — meaningful room to come down on a strong offer.
Risks & watch-outs
- Watch-outs: property tax is 2.8% of price.
- Climate carrying-cost: major wind risk, 77% chance of damaging wind over 30y; extreme-heat days projected 7→24/yr by 2055 (HVAC capex compounding) — expect insurance premiums to compound above CPI over the hold.
Questions for the listing agent
- Built in 1968 — when were the roof, HVAC, electrical panel, plumbing, and water heater last replaced?
- Property tax is high relative to price — has the assessment been appealed recently, and will the sale trigger a re-assessment?
- Is there a deadline driving the sale (1031 exchange, divorce, estate, relocation)? That informs how much negotiation room exists.
- Crime grade is D in this area — have there been break-ins, vandalism, or insurance claims at this property in the last 3 years? What carrier currently insures it and at what premium?
- What's the average days-on-market for RENTAL listings here right now (not sales)? A rising rental-DOM trend means longer vacancies and softer asking-rent achievability than the comps imply.
- What's the recent tenant-quality profile in this submarket — average credit score on applications, eviction rate, late-payment / NSF rate, and stable-employment percentage? A property-management company in the area should have these aggregated.
- How much new for-sale + rental construction is in the pipeline within 1–3 miles? Heavy new supply typically softens prices + rents 12–24 months out; constrained supply supports both.
Investment metrics
- 1% rule
- 1.21% ✓
- Cap rate
- 8.18%
- Cash-on-cash
- 6.75%
- DSCR
- 1.30
- GRM
- 6.9
CMA / ARV
- ARV (on-the-fly)
- $175,832
- Comps found
- 8
Show comp detail 8 sales within ~0.75 mi
| Address | Dist | Beds/Ba | Sqft | Sold | Price | $/sf | Match |
|---|---|---|---|---|---|---|---|
| 1914 E Avenue G | 0.16mi | 3/2.0 | 1,452 (+2%) | 9mo | $100,000 | $69 | 81 |
| 707 S 34th St | 0.18mi | 3/1.5 | 1,436 (+1%) | 10mo | $86,000 | $60 | 79 |
| 902 S 24th St | 0.44mi | 4/2.0 (+1) | 1,425 (+0%) | 1mo | $184,999 | $130 | 73 |
| 1906 E Avenue G | 0.19mi | 4/2.0 (+1) | 1,347 (-5%) | 7mo | $102,000 | $76 | 72 |
| 908 S 22nd St | 0.55mi | 3/2.0 | 1,318 (-7%) | 6mo | $163,000 | $124 | 57 |
| 1715 Bear Grass Ridge Rd | 0.73mi | 3/2.0 | 1,473 (+4%) | 5mo | $234,990 | $160 | 56 |
| 1504 E Central Ave | 0.70mi | 3/2.0 | 1,454 (+2%) | 9mo | $90,000 | $62 | 55 |
| 815 S 24th St | 0.41mi | 3/2.0 | 1,248 (-12%) | 16mo | $179,000 | $143 | 48 |
Match score weights: distance 35% · size 25% · config 20% · recency 20%. Top-matched comps best support the ARV.
Projected returns pro-forma
-3.0% appreciation · 3.44% rent growth · sell at horizon
- IRR
- -5.3%
- Equity multiple
- 0.80×
- Total profit
- $-6,658
- Equity at exit
- $17,892
- IRR
- 5.0%
- Equity multiple
- 1.38×
- Total profit
- $12,795
- Equity at exit
- $10,375
Cash invested: $33,600 (down + closing). Projections, not guarantees.
Landlord ↔ Tenant lean methodology
- Overall (STATE)
- 87 Strongly Landlord-Friendly
- State Texas
- 87 Strongly Landlord-Friendly · R+5
- County
- — inherits STATE
- City
- — inherits STATE
ZIP-level market 76501
- Rents YoY
- 3.4%
- Active inventory
- 337
- Price-to-rent
- 6.9×
Monthly cashflow live
- Estimated rent
- $1,454 high interval (Pro) →
- Mortgage (P&I)
- −$629
- Tax from tax record
- −$280 /mo · $3,360/yr
- Insurance
- −$50
- HOA
- −$0
- Vacancy / Maint / Mgmt
- −$305
- Net cashflow
- $189
Break-even live
Sensitivity live
| Price | -10% $257 | -5% $223 | +0% $189 | +5% $155 | +10% $121 |
|---|---|---|---|---|---|
| Rent | -10% $74 | -5% $132 | +0% $189 | +5% $246 | +10% $304 |
| Rate | -1.0pp $249 | -0.5pp $220 | base $189 | +0.5pp $158 | +1.0pp $126 |
UW: 25.0% down · 7.5% · 30yr · 1.5% tax · 5.0% vac · 8.0% maint · 8.0% mgmt
Financing live
Cash to close
- Down payment
- $30,000
- Closing costs
- $3,600
- Reserves months
- —
- Total cash needed
- —
Loan-product check · same deal, 3 products live
Conventional
25% down · 7.5% · 30yr
- Down + closing
- —
- Monthly P&I
- —
- Monthly cashflow
- —
- DSCR
- —
- Eligible?
- —
Personal DTI + credit; lowest rate.
DSCR
20% down · 8.5% · 30yr
- Down + closing
- —
- Monthly P&I
- —
- Monthly cashflow
- —
- DSCR
- —
- Eligible?
- —
No personal income docs; deal must DSCR.
Hard money
10% down · 12.0% · 12mo
- Down + closing
- —
- Monthly P&I
- —
- Monthly cashflow
- —
- DSCR
- —
- Eligible?
- —
Short-term bridge; refi at stabilization.
Rent comps 40 comps
| Address | Beds | Baths | Sqft | Rent | $/sqft | DOM | Units | Dist |
|---|---|---|---|---|---|---|---|---|
| 1906 East Avenue G Unit G Temple, TX | 4.0 | 2.0 | 1347 | $1,600 | $1.19 | 25d | 1 | 0.18mi |
| 1702 E Heritage Ave Temple, TX | 3.0 | 2.0 | 1718 | $1,400 | $0.81 | 45d | 1 | 0.26mi |
| 708 S 28th St Unit 28th St unit 708 A Temple, TX | 3.0 | 2.5 | 1355 | $1,435 | $1.06 | 45d | 1 | 0.34mi |
| 805 S 24th St Temple, TX | 3.0 | 2.0 | 1233 | $1,245 | $1.01 | 45d | 1 | 0.40mi |
| 612 S 26th St Temple, TX | 3.0 | 2.0 | 1237 | $1,195 | $0.97 | 45d | 1 | 0.41mi |
| 820 S 24th St Unit B Temple, TX | 3.0 | 2.5 | 1300 | $1,435 | $1.10 | 16d | 1 | 0.43mi |
| 613 S 24th St Temple, TX | 3.0 | 2.0 | 1028 | $1,290 | $1.25 | 25d | 1 | 0.44mi |
| 1001 S Terrace St Temple, TX | 3.0 | 2.0 | 1090 | $1,015 | $0.93 | 16d | 1 | 0.47mi |
| 1218 S 26th St Unit A Temple, TX | 3.0 | 1.0 | 900 | $850 | $0.94 | 25d | 1 | 0.50mi |
| 234 Dolphin Dr Unit 234 A Dolphin Temple, TX | 3.0 | 2.0 | 1379 | $1,350 | $0.98 | 16d | 1 | 0.50mi |
| 306 Dolphin Dr Unit 306 A Dolphin Temple, TX | 3.0 | 2.0 | 1379 | $1,350 | $0.98 | 16d | 1 | 0.51mi |
| 226 Dolphin Dr Unit 226 A Dolphin Temple, TX | 3.0 | 3.0 | 1455 | $1,450 | $1.00 | 16d | 1 | 0.51mi |
| 222 Dolphin Dr Unit 222 A Dolphin Temple, TX | 3.0 | 3.0 | 1455 | $1,450 | $1.00 | 16d | 1 | 0.52mi |
| 218 Dolphin Dr Unit 218 A Dolphin Temple, TX | 3.0 | 2.0 | 1379 | $1,350 | $0.98 | 16d | 1 | 0.52mi |
| 1115 S #B S Terrace ST Unit Terrace St unit 1115 B Temple, TX | 3.0 | 2.5 | 1355 | $1,435 | $1.06 | 45d | 1 | 0.52mi |
| 121 Dolphin Dr Unit 121 A Dolphin Temple, TX | 3.0 | 2.0 | 1379 | $1,350 | $0.98 | 16d | 1 | 0.57mi |
| 117 Dolphin Dr Unit 117 A Dolphin Temple, TX | 3.0 | 2.0 | 1379 | $1,350 | $0.98 | 16d | 1 | 0.58mi |
| 110 Dolphin Dr Unit A Temple, TX | 3.0 | 2.0 | 1378 | $1,350 | $0.98 | 16d | 1 | 0.59mi |
| 307 Riptide Rd Temple, TX | 3.0 | 2.0 | 1400 | $1,500 | $1.07 | 16d | 1 | 0.59mi |
| 903 S 18th St Temple, TX | 3.0 | 2.0 | 1144 | $1,295 | $1.13 | 16d | 1 | 0.62mi |
| 103 Dolphin Dr Unit B Temple, TX | 3.0 | 2.0 | 1373 | $1,550 | $1.13 | 45d | 1 | 0.62mi |
| 215 Riptide Rd Unit A Temple, TX | 3.0 | 2.0 | 1345 | $1,400 | $1.04 | 45d | 1 | 0.63mi |
| 2321 Ocean Ave Unit B Temple, TX | 3.0 | 2.0 | 1310 | $1,400 | $1.07 | 45d | 1 | 0.63mi |
| 2321 Ocean Ave Unit B Temple, TX | 3.0 | 2.0 | 1310 | $1,400 | $1.07 | 16d | 1 | 0.63mi |
| 2310 Ocean Ave Unit A Temple, TX | 3.0 | 2.0 | 1300 | $1,425 | $1.10 | 45d | 1 | 0.65mi |
| 2322 Ocean Ave Temple, TX | 3.0 | 2.0 | 1300 | $1,495 | $1.15 | 16d | 1 | 0.67mi |
| 101 S 50th St Unit 1324867P Temple, TX | 3.0 | 2.0 | 1194 | $4,293 | $3.60 | 23d | 1 | 0.69mi |
| 101 Riptide Rd Temple, TX | 3.0 | 2.0 | 1310 | $1,495 | $1.14 | 23d | 1 | 0.69mi |
| 518 S Knob St Unit B Temple, TX | 3.0 | 2.0 | 1090 | $1,015 | $0.93 | 16d | 1 | 0.72mi |
| 104 S 22nd St Unit B Temple, TX | 3.0 | 2.5 | 1300 | $1,435 | $1.10 | 45d | 1 | 0.75mi |
| 708 Henderson St Temple, TX | 3.0 | 2.0 | 1090 | $1,025 | $0.94 | 16d | 1 | 0.75mi |
| 503 Henderson St Temple, TX | 3.0 | 2.0 | 1090 | $1,015 | $0.93 | 16d | 1 | 0.77mi |
| 501 Henderson St Temple, TX | 4.0 | 2.0 | 1223 | $1,050 | $0.86 | 16d | 1 | 0.77mi |
| 209 S 18th St Temple, TX | 3.0 | 2.5 | 1250 | $1,400 | $1.12 | 45d | 1 | 0.78mi |
| 209 S 18th St Unit A Temple, TX | 3.0 | 2.0 | 1250 | $1,550 | $1.24 | 16d | 1 | 0.78mi |
| 209 S 18th St Unit A Temple, TX | 3.0 | 2.0 | 1250 | $1,550 | $1.24 | 25d | 1 | 0.78mi |
| 703 S 16th St Temple, TX | 3.0 | 2.0 | 1090 | $1,035 | $0.95 | 16d | 1 | 0.78mi |
| 509 S 16th St Temple, TX | 3.0 | 2.0 | 1090 | $1,065 | $0.98 | 16d | 1 | 0.81mi |
| 505 S 16th St Temple, TX | 3.0 | 2.0 | 1090 | $1,070 | $0.98 | 16d | 1 | 0.82mi |
| 2902 Blue Ridge Ln Temple, TX | 4.0 | 2.0 | 1732 | $1,945 | $1.12 | 16d | 1 | 0.83mi |
Listing history 13 events
-
2026-06-22days on market $120,000 Active 19 DOM
-
2026-06-18days on market $120,000 Active 16 DOM
-
2026-06-17days on market $120,000 Active 15 DOM
-
2026-06-16days on market $120,000 Active 14 DOM
-
2026-06-15days on market $120,000 Active 13 DOM
-
2026-06-14statusdays on market $120,000 Active 11 DOM
-
2026-06-10days on market $120,000 Active Under Contract 8 DOM
-
2026-06-09days on market $120,000 Active Under Contract 7 DOM
-
2026-06-09status $120,000 Active Under Contract 6 DOM
-
2026-06-08days on market $120,000 Active 6 DOM
-
2026-06-07days on market $120,000 Active 5 DOM
-
2026-06-03remarks 150-char remark
-
2026-06-03$120,000 Active 1 DOM
ⓘ Source: listings_history table (triggers on properties + properties_extension) + one-shot
backfill from property_details.listing_events for pre-trigger history.
Tax reassessment forecast TX · Resets to sale price
- Current annual tax
- $3,360 · $280/mo
- Projected year-2 tax
- $3,360 · $280/mo
- Expected delta
- $0/yr ($0/mo · 0.0%)
ⓘ Screening estimate from a state-policy table — verify with the county assessor before closing.
Climate risk First Street
- Flood 1/10 Low FEMA zone X (unshaded) · 0% chance over 30 yrs
- Wildfire 3/10 Moderate
- Heat 8/10 Severe 7 d/yr ≥108°F today · 24 d/yr by 30 yrs out
- Wind 6/10 Major 77% chance of damaging wind over 30 yrs
- Air quality 1/10 Low 0 unhealthy d/yr today · 0 by 30 yrs out
Nearby sold comps map
Loading sold comps map…
Walkable amenities ~0.75 mi
Loading nearby amenities…
Taxation est. · year 1
- Rental income
- $17,443
- − Mortgage interest
- −$6,722
- − Property taxes
- −$3,360
- − Insurance
- −$600
- − Repairs & maintenance
- −$1,395
- − Management
- −$1,395
- − Depreciation
- −$3,491
- Taxable income
- $479
- Est. tax owed @ 24.0%
- −$115
- After-tax cash flow
- $2,153/yr
For passive investors: Depreciation is non-cash, so a rental often shows a tax loss while cash-flowing — sheltering income. Rental losses are passive: they offset passive income freely, and up to $25,000/yr can offset ordinary (W-2) income if you actively participate and your MAGI is under $100k (phasing out to $0 by $150k); unused losses carry forward. On sale, claimed depreciation is recaptured at up to 25%, and gains may owe capital-gains tax (a 1031 exchange can defer both). Figures are a year-1 estimate at your 24.0% rate — not tax advice; consult a CPA.
Schools (NCES district)
- District
- Temple ISD
- NCES district ID
- 4842330
- Math proficiency
- 32% ▼ -8.00%
- Reading proficiency
- 31% ▼ -4.00%
- Median HH income
- $43,120
- Composite
- 26.8/100
- National rank
- #7123
- State rank
- #590 of 826 in TX
Livability — Temple
- Score
- 75/100
- State rank
- #122
- US rank
- #3814
Category grades
Schools grade is shown separately in the Schools card above.
Census & demographics
- Census place
- Temple, TX
- County
- Bell County · 345,090 people
- City population
- 96,587
- Metro
- Killeen-Temple, TX
- Population (ZIP)
- 17,752
- Household income
- $62,532
- Rent vs Own
- Severe rent burden
- 466.0
Population outlook (Bell County) Hauer SSP2
- Today (2025)
- 371,114 people
- By 2030
- 389,104 · +4.8%
- By 2040
- 420,592 · +13.3%
- By 2050
- 447,779 · +20.7%
- By 2075
- 499,130 · +34.5%
- By 2100
- 505,680 · +36.3%
Race, ethnicity, and origin ACS 2023
- Neighborhood character
- Diverse neighborhood (Simpson 0.67)
- Race & ethnicity
- White 42% Hispanic / Latino 36% Two or more races 18% Black 17% Native American 2%
- Hispanic origin (detail)
- Mexican 31% Puerto Rican 2%
- Common ancestry
- Romanian 3% Italian 2% Slovak 1%
- Foreign-born
- 6% · Canada
- Languages at home
- 79% English-only · Spanish 20%
Political lean MEDSL · Bell
- 2024 margin
- R (+16.2) · D 41.3% · R 57.6% · Other 1.1%
- 2008→2024 swing
- -6.5pp toward R · 2008: -9.8pp · 2024: -16.2pp
- All cycles
- 2024: R+16.2 2020: R+8.5 2016: R+15.1 2012: R+16.4 2008: R+9.8
Not yet ingested
- Civics
- —
Market trends
- HPI YoY
- ▼ -113.09%
- Current HPI
- 177.0555
- Rent YoY
- ▲ 3.44%
- Metro
- Killeen-Temple, TX
- State GDP YoY
- ▲ 3.95%
- F500 in state
- 110
Industry mix (Fortune 500 HQ in TX)
| Industry | F500 HQs | Revenue |
|---|---|---|
| Energy | 16 | $1,198B |
|
||
| Technology | 5 | $198B |
|
||
| Engineering / Construction | 4 | $72B |
|
||
| Energy Services | 3 | $60B |
|
||
| Utilities | 3 | $41B |
|
||
| Healthcare | 2 | $330B |
|
||
Price history
+79.1% since first listed15 events — show timeline
- 2026-06-02 Listed $120,000 CTXMLS
- 2024-03-08 Rental Removed $1,245 PROPERTYWARE
- 2024-02-22 Listed for Rent $1,245 PROPERTYWARE
- 2024-02-22 Rental Removed $1,245 Avail
- 2024-02-21 Listed for Rent $1,245 Avail
- 2024-02-14 Rental Removed $1,245 PROPERTYWARE
- 2024-01-26 Listed for Rent $1,245 PROPERTYWARE
- 2024-01-26 Rental Removed $1,245 PROPERTYWARE
- 2024-01-24 Listed for Rent $1,245 PROPERTYWARE
- 2024-01-24 Rental Removed $1,245 Avail
- 2024-01-23 Listed for Rent $1,245 Avail
- 2012-09-26 Sold (Public Records) — Public Records
- 2012-09-26 Sold (MLS) $55,000 CTXMLS
- 2012-08-06 Listed $67,000 CTXMLS
- 1992-09-03 Sold (Public Records) — Public Records
Property tax history
+8.0%/yrLatest (2025): $3,360 · -13.0% YoY. Source: county tax records.
Cash-flow waterfall
monthlySold comps — $/sqft
last 12 mo · ≤1 miLoading sold comps…