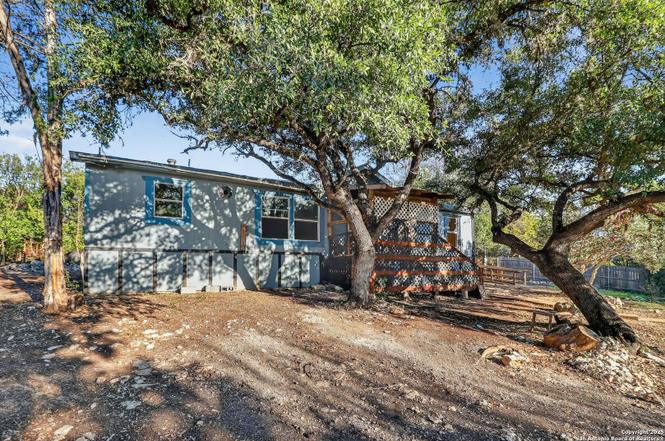
833 High Dr · Canyon Lake, TX
Flood risk 1/10 · Minimal
- FEMA flood zone
- X (unshaded)
- Chance of flooding over 30 yrs
- 0.0%
- Est. flood insurance / yr
- $507 – $1,088
Fire risk 5/10 · Moderate
- Est. fire insurance / yr
- $1,222 – $2,270
Heat risk 7/10 · Major
- Hot days now (above 106°F)
- 7 days/yr
- Hot days in 30 yrs
- 22 days/yr
Wind risk 6/10 · Moderate
- Chance of severe wind over 30 yrs
- 67.0%
Air-quality risk 2/10 · Minimal
- Unhealthy air days now
- 1 days/yr
- Unhealthy air days in 30 yrs
- 1 days/yr
Risk factors via First Street. Map © Google.
Why this score? — see what drove the B grade
The composite is a weighted blend of 9 inputs, each scored 0–100. Each bar is that input's sub-score; the figure is the points it added to the 100-point composite (weight × sub-score).
- Cash flow +30.0/30.0
- 1% rule +10.0/10.0
- DSCR +10.0/10.0
- ARV discount +7.5/15.0
- Schools +5.2/10.0
- Livability +3.4/5.0
- Rent growth +2.5/5.0
- Condition / age +2.5/5.0
- Appreciation +0.0/10.0
$64,000
🖨 Deal sheet 📄 Offer letter ✓ Due diligence
Key facts
- 0.53 acre lot
- Built 1996
- Listed 154 days
Property features AI
Finance
- Financial info: Down payment assistance resources available
- HOA & community: Subdivision legal name: INDIAN HILLS EST 3
Exterior
- Utilities: Electric service by PEC; Water service by Texas Water; Septic system; Garbage service by Hill Country
- Home design: Pre-owned property; Other building exterior (see remarks); Other foundation (see remarks); Other roof type (see remarks); Approximate age: 29 years
- Construction: Other building exterior (see remarks); Other foundation (see remarks); Other roof type (see remarks); Built approximately 29 years ago
- Exterior features: Subdivision: INDIAN HILLS; Lot size approximately 0.527 acres
Interior
- Kitchen: Kitchen: 14 x 8
- Bedrooms: Primary bedroom: 15 x 14 with ceiling fan and full bath; Bedroom 2: 11 x 10; Bedroom 3: 11 x 10
- Flooring: Ceramic tile; Vinyl; Laminate
- Bathrooms: Two full bathrooms; Primary bathroom: 11 x 9 with tub/shower combination
- Heating & cooling: Central heating (electric); Central air conditioning
- Interior features: Ceiling fans; One living area
Neighborhood map
What this means for you Summary
Snapshot
- This is a 3-bed/2.0-bath manufactured listed at $64k.
Deal economics
- At list price, monthly cash flow is $871 ($10k/yr) — positive.
- The deal already cash-flows at list — no discount required.
- Meets the 1% rule at list price ($2k rent vs $64k).
- Recommended offer: $56k (12.0% below list) — sets the bar for market timing.
- Cap rate 22.6% vs local median 2.3% in Canyon Lake — top-decile yield for the area; either an underpriced asset or a hidden risk that comps aren't pricing in. Stress-test before assuming the spread holds.
Location & tenants
- Location reads 67/100 on livability (#534 in TX) — a middle-class / working-renter tenant base. Strengths: employment A+, housing A+, cost of living A; Watch: amenities F, commute F, health & safety F.
- Comal ISD (rural): math 57% / reading 59% proficiency, ranked #58 of 826 in TX (top 7%) — acceptable for families but not a draw, mixed tenant base, ~2y average lease.
- Zoned schools: Rebecca Creek El (math 55% / reading 52%, grade C, #686 of 4,322 statewide, top 16%, 605 students, 51% FRL); Canyon Lake H S (math 46% / reading 56%, grade D+, #482 of 1,632 statewide, top 30%, 1,038 students, 37% FRL).
- Market conditions: 633 active listings in the ZIP; 11 comparable units currently listed for rent nearby; rentals at typical pace (median 24d on market — plan ~3-4 weeks tenant-placement turnaround); 45% of comp listings sitting > 30 days — soft ceiling on asking rent; high-income renter base; 3,420 units permitted in Comal County in 2024 (1,164 in 5+ unit buildings).
Forward outlook
- Local home prices are declining (-3.0%/yr); year-one equity from $442 of loan paydown is wiped out by about $2k of value loss. Plan a longer hold.
- Comal County population projected at +70% by 2050 — long-run rental-demand tailwind backs the buy-and-hold thesis.
- At projected returns (-3.0% appreciation + 3.0% rent growth), your $18k cash investment doubles in ~2 years — after that, you're playing with house money.
Negotiation context
- It's been on market 154 days — a 12% lower offer ($56k) is reasonable based on typical stale-listing flexibility.
Risks & watch-outs
- Watch-outs: property tax is 2.6% of price.
- Climate carrying-cost: major wind risk, 67% chance of damaging wind over 30y; moderate wildfire risk; extreme-heat days projected 7→22/yr by 2055 (HVAC capex compounding) — expect insurance premiums to compound above CPI over the hold.
Questions for the listing agent
- It's been on market 154 days. Have you received any prior offers? Is the seller open to a 12% concession, seller financing, or rate buy-down credit?
- Property tax is high relative to price — has the assessment been appealed recently, and will the sale trigger a re-assessment?
- Why hasn't it sold? Are there any deal-killer items the seller is aware of (foundation, flood, title, zoning, code violations)?
- Is there a deadline driving the sale (1031 exchange, divorce, estate, relocation)? That informs how much negotiation room exists.
- What's the average days-on-market for RENTAL listings here right now (not sales)? A rising rental-DOM trend means longer vacancies and softer asking-rent achievability than the comps imply.
- What's the recent tenant-quality profile in this submarket — average credit score on applications, eviction rate, late-payment / NSF rate, and stable-employment percentage? A property-management company in the area should have these aggregated.
- How much new for-sale + rental construction is in the pipeline within 1–3 miles? Heavy new supply typically softens prices + rents 12–24 months out; constrained supply supports both.
Investment metrics
- 1% rule
- 2.71% ✓
- Cap rate
- 22.63%
- Cash-on-cash
- 58.35%
- DSCR
- 3.60
- GRM
- 3.1
CMA / ARV
- ARV (on-the-fly)
- $200,704
- Comps found
- 2
Show comp detail 2 sales within ~0.75 mi
| Address | Dist | Beds/Ba | Sqft | Sold | Price | $/sf | Match |
|---|---|---|---|---|---|---|---|
| 7947 Caribou | 0.73mi | 3/2.0 | 1,606 (+2%) | 8mo | $175,000 | $109 | 55 |
| 4006 Deerslayer | 0.68mi | 3/2.0 | 1,680 (+7%) | 6mo | $214,900 | $128 | 51 |
Match score weights: distance 35% · size 25% · config 20% · recency 20%. Top-matched comps best support the ARV.
Projected returns pro-forma
-3.0% appreciation · 3.0% rent growth · sell at horizon
- IRR
- 57.0%
- Equity multiple
- 3.52×
- Total profit
- $45,186
- Equity at exit
- $9,543
- IRR
- 61.9%
- Equity multiple
- 7.20×
- Total profit
- $111,059
- Equity at exit
- $5,534
Cash invested: $17,920 (down + closing). Projections, not guarantees.
Landlord ↔ Tenant lean methodology
- Overall (STATE)
- 87 Strongly Landlord-Friendly
- State Texas
- 87 Strongly Landlord-Friendly · R+5
- County
- — inherits STATE
- City
- — inherits STATE
ZIP-level market 78070
- Home prices YoY
- -20.8%
- Active inventory
- 633
- Price-to-rent
- 3.1×
Monthly cashflow live
- Estimated rent
- $1,737 high interval (Pro) →
- Mortgage (P&I)
- −$336
- Tax from tax record
- −$139 /mo · $1,665/yr
- Insurance
- −$27
- HOA
- −$0
- Vacancy / Maint / Mgmt
- −$365
- Net cashflow
- $871
Break-even live
UW: 25.0% down · 7.5% · 30yr · 1.5% tax · 5.0% vac · 8.0% maint · 8.0% mgmt
Financing live
Cash to close
- Down payment
- $16,000
- Closing costs
- $1,920
- Reserves months
- —
- Total cash needed
- —
Loan-product check · same deal, 3 products live
Conventional
25% down · 7.5% · 30yr
- Down + closing
- —
- Monthly P&I
- —
- Monthly cashflow
- —
- DSCR
- —
- Eligible?
- —
Personal DTI + credit; lowest rate.
DSCR
20% down · 8.5% · 30yr
- Down + closing
- —
- Monthly P&I
- —
- Monthly cashflow
- —
- DSCR
- —
- Eligible?
- —
No personal income docs; deal must DSCR.
Hard money
10% down · 12.0% · 12mo
- Down + closing
- —
- Monthly P&I
- —
- Monthly cashflow
- —
- DSCR
- —
- Eligible?
- —
Short-term bridge; refi at stabilization.
Rent comps 11 comps
| Address | Beds | Baths | Sqft | Rent | $/sqft | DOM | Units | Dist |
|---|---|---|---|---|---|---|---|---|
| 229 High Dr Unit A Spring Branch, TX | 2.0 | 2.5 | 1283 | $1,500 | $1.17 | 4d | 1 | 0.50mi |
| 229 High Dr Unit B Spring Branch, TX | 2.0 | 2.5 | 1283 | $1,690 | $1.32 | 43d | 1 | 0.50mi |
| 109 High Dr Spring Branch, TX | 2.0 | 3.0 | 1200 | $1,550 | $1.29 | 43d | 1 | 0.53mi |
| 1197 Chisolm Trl Unit A Spring Branch, TX | 3.0 | 2.0 | 1226 | $1,450 | $1.18 | 43d | 1 | 0.60mi |
| 2519 Golf Dr Spring Branch, TX | 3.0 | 2.0 | 1144 | $1,600 | $1.40 | 14d | 1 | 0.78mi |
| 2519 Golf Dr Spring Branch, TX | 3.0 | 2.0 | 1144 | $1,600 | $1.40 | 23d | 1 | 0.78mi |
| 2455 Golf Dr Spring Branch, TX | 3.0 | 2.0 | 1246 | $1,550 | $1.24 | 43d | 1 | 0.78mi |
| 184 Crestview Ln Spring Branch, TX | 3.0 | 2.0 | 1154 | $1,495 | $1.30 | 43d | 1 | 0.87mi |
| 418 Cimarron Spring Branch, TX | 3.0 | 2.0 | 1091 | $1,595 | $1.46 | 23d | 1 | 0.96mi |
| 418 Cimarron Spring Branch, TX | 3.0 | 2.0 | 1091 | $1,600 | $1.47 | 14d | 1 | 0.96mi |
| 107 Virginia Way Spring Branch, TX | 3.0 | 2.0 | 1294 | $1,600 | $1.24 | 23d | 1 | 1.22mi |
Listing history 9 events
-
2026-05-12status Pending
-
2026-01-30historical Active Option
-
2026-01-27price $64,000
-
2026-01-21price $74,000
-
2026-01-12price $84,000
-
2026-01-07price $94,000
-
2025-12-09$99,000 New
-
2025-09-12soldstatus
-
1984-08-15soldstatus
ⓘ Source: listings_history table (triggers on properties + properties_extension) + one-shot
backfill from property_details.listing_events for pre-trigger history.
Tax reassessment forecast TX · Resets to sale price
- Current annual tax
- $1,665 · $139/mo
- Projected year-2 tax
- $1,665 · $139/mo
- Expected delta
- $0/yr ($0/mo · 0.0%)
ⓘ Screening estimate from a state-policy table — verify with the county assessor before closing.
Climate risk First Street
- Flood 1/10 Low FEMA zone X (unshaded) · 0% chance over 30 yrs
- Wildfire 5/10 Major
- Heat 7/10 Severe 7 d/yr ≥106°F today · 22 d/yr by 30 yrs out
- Wind 6/10 Major 67% chance of damaging wind over 30 yrs
- Air quality 2/10 Low 1 unhealthy d/yr today · 1 by 30 yrs out
Nearby sold comps map
Loading sold comps map…
Walkable amenities ~0.75 mi
Loading nearby amenities…
Taxation est. · year 1
- Rental income
- $20,846
- − Mortgage interest
- −$3,585
- − Property taxes
- −$1,665
- − Insurance
- −$320
- − Repairs & maintenance
- −$1,668
- − Management
- −$1,668
- − Depreciation
- −$1,862
- Taxable income
- $10,079
- Est. tax owed @ 24.0%
- −$2,419
- After-tax cash flow
- $8,037/yr
For passive investors: Depreciation is non-cash, so a rental often shows a tax loss while cash-flowing — sheltering income. Rental losses are passive: they offset passive income freely, and up to $25,000/yr can offset ordinary (W-2) income if you actively participate and your MAGI is under $100k (phasing out to $0 by $150k); unused losses carry forward. On sale, claimed depreciation is recaptured at up to 25%, and gains may owe capital-gains tax (a 1031 exchange can defer both). Figures are a year-1 estimate at your 24.0% rate — not tax advice; consult a CPA.
Schools (NCES district)
- District
- Comal ISD
- NCES district ID
- 4814730
- Math proficiency
- 57% ▼ -9.00%
- Reading proficiency
- 59% ▼ -2.00%
- Median HH income
- $74,792
- Composite
- 51.79/100
- National rank
- #1671
- State rank
- #58 of 826 in TX
Livability — Canyon Lake
- Score
- 67/100
- State rank
- #534
- US rank
- #10441
Category grades
Schools grade is shown separately in the Schools card above.
Census & demographics
- Census place
- Canyon Lake, TX
- County
- Comal County · 206,262 people
- City population
- 42,159
- Metro
- San Antonio-New Braunfels, TX
- Population (ZIP)
- 20,200
- Household income
- $115,175
- Rent vs Own
- Severe rent burden
- 73.0
Population outlook (Comal County) Hauer SSP2
- Today (2025)
- 175,637 people
- By 2030
- 199,911 · +13.8%
- By 2040
- 249,436 · +42.0%
- By 2050
- 299,430 · +70.5%
- By 2075
- 423,857 · +141.3%
- By 2100
- 512,048 · +191.5%
Race, ethnicity, and origin ACS 2023
- Neighborhood character
- Predominantly White (70%)
- Race & ethnicity
- White 70% Hispanic / Latino 22% Two or more races 12% Black 3%
- Hispanic origin (detail)
- Mexican 19%
- Common ancestry
- Lithuanian 3% Romanian 3% Slovak 2%
- Foreign-born
- 6% · Canada
- Languages at home
- 89% English-only · Spanish 10% French/Haitian/Cajun 1%
Political lean MEDSL · Comal
- 2024 margin
- Solid R (+45.5) · D 26.8% · R 72.2%
- 2008→2024 swing
- +1.9pp toward D · 2008: -47.4pp · 2024: -45.5pp
- All cycles
- 2024: R+45.5 2020: R+42.7 2016: R+50.1 2012: R+54.1 2008: R+47.4
Not yet ingested
- Civics
- —
Market trends
- HPI YoY
- ▼ -61.35%
- Current HPI
- 233.2875
- Rent YoY
- —
- Metro
- San Antonio-New Braunfels, TX
- State GDP YoY
- ▲ 3.95%
- F500 in state
- 110
Industry mix (Fortune 500 HQ in TX)
| Industry | F500 HQs | Revenue |
|---|---|---|
| Energy | 16 | $1,198B |
|
||
| Technology | 5 | $198B |
|
||
| Engineering / Construction | 4 | $72B |
|
||
| Energy Services | 3 | $60B |
|
||
| Utilities | 3 | $41B |
|
||
| Healthcare | 2 | $330B |
|
||
Price history
-35.4% since first listed9 events — show timeline
- 2026-05-12 Pending — LERA
- 2026-01-30 Contingent — LERA
- 2026-01-27 Price Changed $64,000 LERA
- 2026-01-21 Price Changed $74,000 LERA
- 2026-01-12 Price Changed $84,000 LERA
- 2026-01-07 Price Changed $94,000 LERA
- 2025-12-09 Listed $99,000 LERA
- 2025-09-12 Sold (Public Records) — Public Records
- 1984-08-15 Sold (Public Records) — Public Records
Property tax history
+2.6%/yrLatest (2026): $1,665 · -1.9% YoY. Source: county tax records.
Cash-flow waterfall
monthlySold comps — $/sqft
last 12 mo · ≤1 miLoading sold comps…