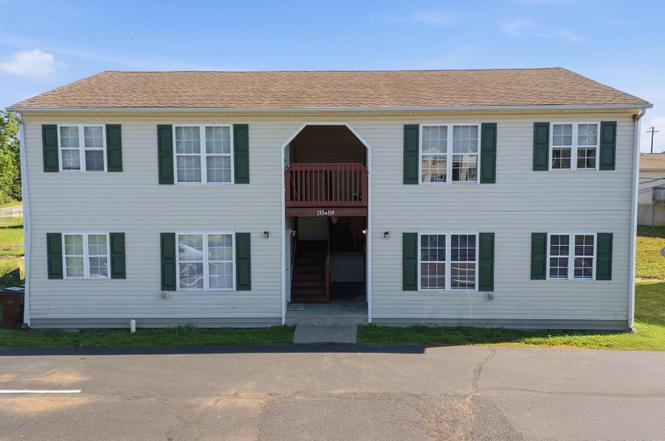
 Fourplex
133-139 Grinder Ct · Nicholasville, KY
Flood risk 6/10 · Moderate
- FEMA flood zone
- X (unshaded)
- Chance of flooding over 30 yrs
- 0.7%
- Est. flood insurance / yr
- $507 – $1,088
Fire risk 3/10 · Minor
- Est. fire insurance / yr
- $839 – $1,559
Heat risk 4/10 · Minor
- Hot days now (above 102°F)
- 7 days/yr
- Hot days in 30 yrs
- 19 days/yr
Wind risk 3/10 · Minor
- Chance of severe wind over 30 yrs
- 4.0%
Air-quality risk 1/10 · Minimal
- Unhealthy air days now
- 0 days/yr
- Unhealthy air days in 30 yrs
- 0 days/yr
Risk factors via First Street. Map © Google.
Why this score? — see what drove the D+ grade
The composite is a weighted blend of 9 inputs, each scored 0–100. Each bar is that input's sub-score; the figure is the points it added to the 100-point composite (weight × sub-score).
- Cash flow +19.7/30.0
- DSCR +6.2/10.0
- ARV discount +5.2/15.0
- Rent growth +4.4/5.0
- 1% rule +4.1/10.0
- Schools +3.3/10.0
- Livability +3.3/5.0
- Condition / age +2.5/5.0
- Appreciation +0.0/10.0
$495,000
🖨 Deal sheet 📄 Offer letter ✓ Due diligence
Multi-family units
County records classify this as Multi-Family (2-4 Unit). Listing-text estimate: 4 units. confirmed
Listing remarks
A rare opportunity to own a quadraplex in Nicholasville. This one is located just off Short Shun. Each unit is 2 bedrooms and 1 bath. All units have their own laundry/ utility room! Parking lot has been recently paved, Some photos have been virtually staged to show what the unit could look like furnished!
Key facts
- Laundry utility room
- 0.29 acre lot
- Built 2001
Tags
Property features AI
Finance
- Other:
- Financial info: 4 total units
- HOA & community:
Exterior
- Parking: Paved parking
- Security:
- Utilities:
- Home design: Quadruplex; 2 stories
- Construction:
- Exterior features: Shingle roof
Interior
- Kitchen:
- Bedrooms:
- Flooring:
- Bathrooms: 4 full bathrooms
- Heating & cooling: Electric heating; Electric cooling
- Interior features: Washer and dryer hook-ups
- Laundry & utility: Washer and electric dryer hookups
Neighborhood map
What this means for you Summary
Snapshot
- This is a 4 × 2-bed/1.0-bath units multifamily listed at $495k.
Deal economics
- At list price, monthly cash flow is $578 ($7k/yr) — positive. Per door: $145/mo.
- The deal already cash-flows at list — no discount required.
- To meet the 1% rule (rent ≥ 1% of price), the offer needs to be $450k (9.2% below list).
- Recommended offer: $450k (9.2% below list) — sets the bar for 1% rule.
- Cap rate 7.7% vs local median 3.4% in Nicholasville — top-decile yield for the area; either an underpriced asset or a hidden risk that comps aren't pricing in. Stress-test before assuming the spread holds.
Location & tenants
- Location reads 66/100 on livability (#231 in KY) — a middle-class / working-renter tenant base. Strengths: cost of living A+, housing A+, crime A; Watch: employment C-, amenities F, commute F.
- Jessamine County (town): math 31% / reading 45% proficiency, ranked #37 of 165 in KY (top 22%) — families likely to look elsewhere, expect single-tenant / working-renter base with shorter leases.
- Zoned schools: Wilmore Elementary School (math 49% / reading 53%, grade C-, #94 of 676 statewide, top 14%, 496 students, 48% FRL); West Jessamine Middle School (math 32% / reading 53%, grade D-, #47 of 217 statewide, top 22%, 904 students, 48% FRL) — zoned schools at 48% FRL track the district average.
- Market conditions: Rents rising fast (+7.5%/yr); 496 active listings in the ZIP; 267 units permitted in Jessamine County in 2024 (9 in 5+ unit buildings).
- At $4,497/mo this rent would consume 72% of the median local household income ($74k/yr) (locally 1186% of renters already pay >50% of income on rent) — very limited rent-growth headroom before tenants either downsize or default.
Forward outlook
- Local home prices are declining (-3.0%/yr); year-one equity from $3k of loan paydown is wiped out by about $15k of value loss. Plan a longer hold.
- Jessamine County population projected at +22% by 2050 — long-run rental-demand tailwind backs the buy-and-hold thesis.
- At projected returns (-3.0% appreciation + 7.5% rent growth), your $139k cash investment doubles in ~10 years — after that, you're playing with house money.
Negotiation context
- Only 3 days on market — expect competitive offers; lowballing is unlikely to land.
- 3 sale attempts since 24y ago with the ask held roughly flat each time — persistent listings suggest the price (not the market) is what's stuck; bring a comps-based counter.
- Current owner paid $192k; list at $495k implies a 157% gain — meaningful room to come down on a strong offer.
Risks & watch-outs
- Climate carrying-cost: major flood risk — expect insurance premiums to compound above CPI over the hold.
Questions for the listing agent
- Can we see the unit-by-unit rent roll, current vacancy, and any below-market leases? What's the average tenancy length?
- What capital expenditures (roof, boiler, parking lot, exteriors) have been made in the last 5 years, and what's planned in the next 2?
- Is there a deadline driving the sale (1031 exchange, divorce, estate, relocation)? That informs how much negotiation room exists.
- Schools are D-rated, which usually means shorter tenancies and higher turnover. Who's the typical renter profile here, and what's been the actual vacancy rate?
- The area grade is low — what's the realistic commute time and amenity access for the typical tenant pool here? Any planned neighborhood developments (good or bad) we should know about?
- What's the average days-on-market for RENTAL listings here right now (not sales)? A rising rental-DOM trend means longer vacancies and softer asking-rent achievability than the comps imply.
- What's the recent tenant-quality profile in this submarket — average credit score on applications, eviction rate, late-payment / NSF rate, and stable-employment percentage? A property-management company in the area should have these aggregated.
- How much new apartment / multifamily construction is in the pipeline within 1–3 miles? Heavy new supply (>2% of stock underway) typically softens rents 12–24 months out; light construction supports rent growth.
Investment metrics
- 1% rule
- 0.91% ✗
- Cap rate
- 7.69%
- Cash-on-cash
- 5.01%
- DSCR
- 1.22
- GRM
- 9.2
CMA / ARV
- ARV (on-the-fly)
- $470,832
- Comps found
- 2
Show comp detail 2 sales within ~0.75 mi
| Address | Dist | Beds/Ba | Sqft | Sold | Price | $/sf | Match |
|---|---|---|---|---|---|---|---|
| 264 Grinder Ct | 0.07mi | 8/4.0 | 3,700 (+7%) | 7mo | $450,000 | $122 | 80 |
| 190-196 Grinder Ct | 0.09mi | 8/4.0 | 3,010 (-13%) | 8mo | $410,000 | $136 | 68 |
Match score weights: distance 35% · size 25% · config 20% · recency 20%. Top-matched comps best support the ARV.
Projected returns pro-forma
-3.0% appreciation · 7.5% rent growth · sell at horizon
- IRR
- -4.1%
- Equity multiple
- 0.84×
- Total profit
- $-22,302
- Equity at exit
- $73,806
- IRR
- 9.7%
- Equity multiple
- 1.89×
- Total profit
- $123,024
- Equity at exit
- $42,799
Cash invested: $138,600 (down + closing). Projections, not guarantees.
Landlord ↔ Tenant lean methodology
- Overall (STATE)
- 83 Strongly Landlord-Friendly
- State Kentucky
- 83 Strongly Landlord-Friendly · R+16
- County
- — inherits STATE
- City
- — inherits STATE
ZIP-level market 40356
- Home prices YoY
- -18.6%
- Rents YoY
- 7.5%
- Active inventory
- 496
- Price-to-rent
- 36.7×
Monthly cashflow live
- Estimated rent
- $4,497 medium interval (Pro) →
- Mortgage (P&I)
- −$2,596
- Tax from tax record
- −$172 /mo · $2,067/yr
- Insurance
- −$206
- HOA
- −$0
- Vacancy / Maint / Mgmt
- −$944
- Net cashflow
- $578
Break-even live
4-unit breakdown (identical units grouped — click to expand)
| Units | Beds | Baths | Est. rent |
|---|---|---|---|
| 4× units | 2 | 1 | $4,496 |
| #1 | 2 | 1 | $1,124 |
| #2 | 2 | 1 | $1,124 |
| #3 | 2 | 1 | $1,124 |
| #4 | 2 | 1 | $1,124 |
| Total (4 units) | $4,497 | ||
UW: 25.0% down · 7.5% · 30yr · 1.5% tax · 5.0% vac · 8.0% maint · 8.0% mgmt
Financing live
Cash to close
- Down payment
- $123,750
- Closing costs
- $14,850
- Reserves months
- —
- Total cash needed
- —
Loan-product check · same deal, 3 products live
Conventional
25% down · 7.5% · 30yr
- Down + closing
- —
- Monthly P&I
- —
- Monthly cashflow
- —
- DSCR
- —
- Eligible?
- —
Personal DTI + credit; lowest rate.
DSCR
20% down · 8.5% · 30yr
- Down + closing
- —
- Monthly P&I
- —
- Monthly cashflow
- —
- DSCR
- —
- Eligible?
- —
No personal income docs; deal must DSCR.
Hard money
10% down · 12.0% · 12mo
- Down + closing
- —
- Monthly P&I
- —
- Monthly cashflow
- —
- DSCR
- —
- Eligible?
- —
Short-term bridge; refi at stabilization.
Listing history 5 events
-
2026-06-18days on market $495,000 Active 3 DOM
-
2026-06-17days on market $495,000 Active 2 DOM
-
2026-06-16remarks 307-char remark
-
2026-06-15remarks 219-char remark
-
2026-06-15$495,000 Active 1 DOM
ⓘ Source: listings_history table (triggers on properties + properties_extension) + one-shot
backfill from property_details.listing_events for pre-trigger history.
Tax reassessment forecast KY · Resets to sale price
- Current annual tax
- $2,067 · $172/mo
- Projected year-2 tax
- $4,257 · $355/mo
- Expected delta
- +$2,190/yr (+$182/mo · 106.0%)
ⓘ Screening estimate from a state-policy table — verify with the county assessor before closing.
Climate risk First Street
- Flood 6/10 Major FEMA zone X (unshaded) · 70% chance over 30 yrs
- Wildfire 3/10 Moderate
- Heat 4/10 Moderate 7 d/yr ≥102°F today · 19 d/yr by 30 yrs out
- Wind 3/10 Moderate 4% chance of damaging wind over 30 yrs
- Air quality 1/10 Low 0 unhealthy d/yr today · 0 by 30 yrs out
Nearby sold comps map
Loading sold comps map…
Walkable amenities ~0.75 mi
Loading nearby amenities…
Taxation est. · year 1
- Rental income
- $53,964
- − Mortgage interest
- −$27,728
- − Property taxes
- −$2,067
- − Insurance
- −$2,475
- − Repairs & maintenance
- −$4,317
- − Management
- −$4,317
- − Depreciation
- −$14,400
- Taxable loss
- −$1,340
- Est. tax savings @ 24.0%
- +$322
- After-tax cash flow
- $7,261/yr
For passive investors: Depreciation is non-cash, so a rental often shows a tax loss while cash-flowing — sheltering income. Rental losses are passive: they offset passive income freely, and up to $25,000/yr can offset ordinary (W-2) income if you actively participate and your MAGI is under $100k (phasing out to $0 by $150k); unused losses carry forward. On sale, claimed depreciation is recaptured at up to 25%, and gains may owe capital-gains tax (a 1031 exchange can defer both). Figures are a year-1 estimate at your 24.0% rate — not tax advice; consult a CPA.
Schools (NCES district)
- District
- Jessamine County
- NCES district ID
- 2103030
- Math proficiency
- 31% ▼ -14.00%
- Reading proficiency
- 45% ▼ -12.00%
- Median HH income
- $50,249
- Composite
- 32.81/100
- National rank
- #5623
- State rank
- #37 of 165 in KY
Livability — Nicholasville
- Score
- 66/100
- State rank
- #231
- US rank
- #11266
Category grades
Schools grade is shown separately in the Schools card above.
Census & demographics
- Census place
- Nicholasville, KY
- County
- Jessamine County · 45,849 people
- City population
- 45,849
- Metro
- Lexington-Fayette, KY
- Population (ZIP)
- 45,849
- Household income
- $74,495
- Rent vs Own
- Severe rent burden
- 1186.0
Population outlook (Jessamine County) Hauer SSP2
- Today (2025)
- 58,419 people
- By 2030
- 61,468 · +5.2%
- By 2040
- 66,952 · +14.6%
- By 2050
- 71,357 · +22.1%
- By 2075
- 80,325 · +37.5%
- By 2100
- 83,848 · +43.5%
Race, ethnicity, and origin ACS 2023
- Neighborhood character
- Predominantly White (86%)
- Race & ethnicity
- White 86% Hispanic / Latino 5% Two or more races 5% Black 4% Asian 2%
- Common ancestry
- Italian 2% Subsaharan African 2% Slovak 2%
- Foreign-born
- 4% · Canada
- Languages at home
- 93% English-only · Spanish 4% Russian/Polish/Slavic 2% Other Asian/Pacific 1%
Political lean MEDSL · Jessamine
- 2024 margin
- Solid R (+35.9) · D 31.2% · R 67.0% · Other 1.8%
- 2008→2024 swing
- +1.1pp toward D · 2008: -37.0pp · 2024: -35.9pp
- All cycles
- 2024: R+35.9 2020: R+32.5 2016: R+40.0 2012: R+39.9 2008: R+37.0
Not yet ingested
- Civics
- —
Market trends
- HPI YoY
- ▼ -61.88%
- Current HPI
- 270.2432
- Rent YoY
- ▲ 7.50%
- Metro
- Lexington-Fayette, KY
- State GDP YoY
- ▲ 1.81%
- F500 in state
- 4
Industry mix (Fortune 500 HQ in KY)
| Industry | F500 HQs | Revenue |
|---|---|---|
| Healthcare | 1 | $118B |
|
||
| Food / Beverage | 1 | $7B |
|
||
Price history
+125.1% since first listed6 events — show timeline
- 2026-06-15 Listed $495,000 ImagineMLS
- 2009-12-01 Sold (Public Records) $192,500 Public Records
- 2007-04-27 Listing Removed — ImagineMLS
- 2007-01-31 Listed $221,000 ImagineMLS
- 2002-11-12 Listing Removed — ImagineMLS
- 2002-07-10 Listed $219,900 ImagineMLS
Cash-flow waterfall
monthlySold comps — $/sqft
last 12 mo · ≤1 miLoading sold comps…