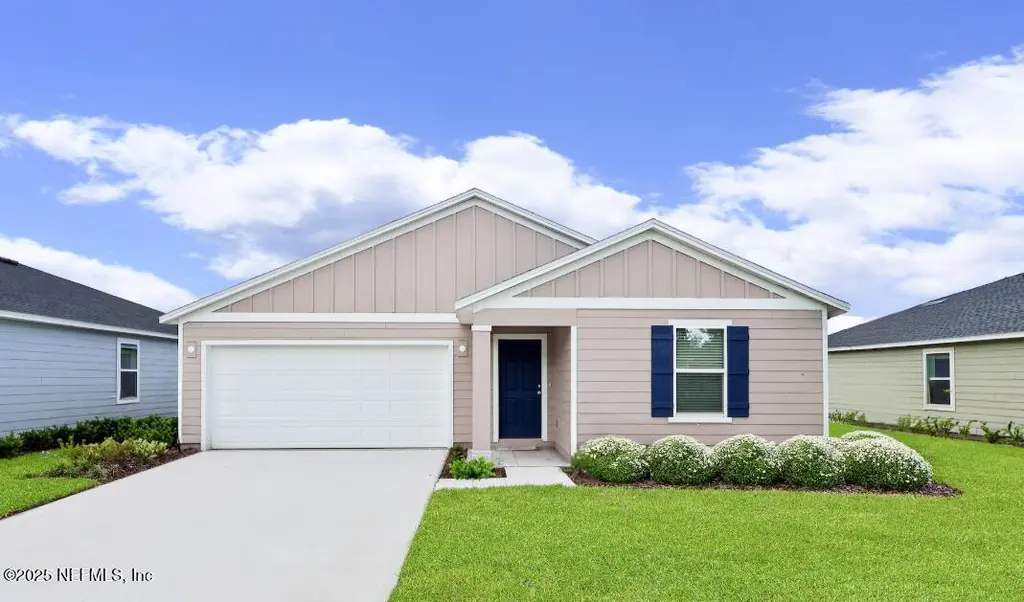
3 Burning Sands Ln · Palm Coast, FL
Flood risk 1/10 · Minimal
- FEMA flood zone
- X (unshaded)
- Chance of flooding over 30 yrs
- 0.0%
- Est. flood insurance / yr
- $507 – $1,088
Fire risk 3/10 · Minor
- Est. fire insurance / yr
- $947 – $1,759
Heat risk 9/10 · Severe
- Hot days now (above 106°F)
- 7 days/yr
- Hot days in 30 yrs
- 20 days/yr
Wind risk 10/10 · Severe
- Chance of severe wind over 30 yrs
- 99.0%
Air-quality risk 2/10 · Minimal
- Unhealthy air days now
- 2 days/yr
- Unhealthy air days in 30 yrs
- 2 days/yr
Risk factors via First Street. Map © Google.
Why this score? — see what drove the F grade
The composite is a weighted blend of 9 inputs, each scored 0–100. Each bar is that input's sub-score; the figure is the points it added to the 100-point composite (weight × sub-score).
- Cash flow +8.6/30.0
- ARV discount +7.5/15.0
- Schools +4.6/10.0
- Livability +3.5/5.0
- Rent growth +2.7/5.0
- Condition / age +2.5/5.0
- DSCR +2.3/10.0
- 1% rule +1.4/10.0
- Appreciation +0.0/10.0
$304,994
🖨 Deal sheet 📄 Offer letter ✓ Due diligence
Listing remarks
Under Construction: Ready June 2026! This beautiful Lennar home features the BLOOM floor plan with 3 bedrooms, 2 bathrooms, and a 2-car garage. Enjoy a stylish kitchen with white cabinets, white quartz countertops, 36-inch uppers, and stainless steel appliances including range, dishwasher, microwave, and refrigerator. Luxury vinyl plank is installed in all wet areas and extended into the family room, dining room, and hallways. Additional features include quartz vanities, window blinds throughout and a full sprinkler system. Includes a one-year builder warranty, dedicated customer service program, and 24-hour emergency service. Palm Coast offers a peaceful, resort-like way of life with mi
Key facts
- Bloom floor plan
- Luxury vinyl plank
- Stylish kitchen
Tags
Property features AI
Exterior
- Parking: Attached garage with garage door opener; 2-car garage
- Security: Smoke detector(s)
- Utilities: Public sewer; Electricity connected; Sewer connected; Water connected; Windows with energy-efficient features
- Home design: Single family residence; One story
- Construction: Fiber cement and frame construction
- Exterior features: Front porch; Porch; Shingle roof; Sprinklers in front; Sprinklers in rear; Asphalt road
Interior
- Kitchen: Dishwasher; Disposal; Electric cooktop; Electric oven; Electric range; Microwave; Refrigerator; Ice maker
- Bedrooms: 3 bedrooms (includes Bedroom 2, Bedroom 3)
- Flooring: Carpet; Tile
- Bathrooms: 2 full bathrooms
- Heating & cooling: Central heating; Electric heating; Heat pump; Central air conditioning; Electric cooling
- Interior features: Breakfast nook; Entrance foyer; Kitchen island; Pantry; Primary bathroom with shower (no tub); Smoke detector(s)
- Laundry & utility: Washer hookup; Electric dryer hookup; Electric water heater
Neighborhood map
What this means for you Summary
Snapshot
- This is a 3-bed/2.0-bath land listed at $305k.
Deal economics
- At list price, monthly cash flow is $-265 ($-3k/yr) — negative.
- To cash-flow at today's rent, offer at most $258k (15.3% below list).
- To meet the 1% rule (rent ≥ 1% of price), the offer needs to be $196k (35.9% below list).
- Recommended offer: $196k (35.9% below list) — sets the bar for 1% rule.
- Cap rate 5.3% vs local median 3.8% in Palm Coast — top-decile yield for the area; either an underpriced asset or a hidden risk that comps aren't pricing in. Stress-test before assuming the spread holds.
Location & tenants
- Location reads 69/100 on livability (#478 in FL) — a middle-class / working-renter tenant base. Strengths: housing A+, health & safety A+, cost of living B+; Watch: amenities F, commute F.
- Flagler (rural): math 53% / reading 56% proficiency, ranked #20 of 73 in FL (top 27%) — acceptable for families but not a draw, mixed tenant base, ~2y average lease.
- Market conditions: Rents flat; 1600 active listings in the ZIP; 27 comparable units currently listed for rent nearby; rentals leasing fast (median 3d on market — plan ~1-2 weeks tenant-placement turnaround); solid renter incomes; 2,588 units permitted in Flagler County in 2024 (0 in 5+ unit buildings).
Forward outlook
- Local home prices are declining (-3.0%/yr); year-one equity from $2k of loan paydown is wiped out by about $9k of value loss. Plan a longer hold.
- Flagler County population projected at +28% by 2050 — long-run rental-demand tailwind backs the buy-and-hold thesis.
Negotiation context
- It's been on market 43 days — a 3% lower offer ($296k) is reasonable based on typical stale-listing flexibility.
- 3 sale attempts since 9y ago; this cycle's ask has dropped $34k (10%) from the opening price — seller is motivated, your offer sets the floor, not the list.
- Current owner paid $212k; 44% above their basis — modest negotiation headroom, anchor on the comps not their cost.
Risks & watch-outs
- Climate carrying-cost: severe wind risk, 99% chance of damaging wind over 30y; extreme-heat days projected 7→20/yr by 2055 (HVAC capex compounding) — expect insurance premiums to compound above CPI over the hold.
Questions for the listing agent
- What do current leases actually rent for vs. the listed asking? Can we see a recent rent roll and the last 12 months of T-12 income?
- It's been on market 43 days. Have you received any prior offers? Is the seller open to a 36% concession, seller financing, or rate buy-down credit?
- Is there a deadline driving the sale (1031 exchange, divorce, estate, relocation)? That informs how much negotiation room exists.
- The area grade is low — what's the realistic commute time and amenity access for the typical tenant pool here? Any planned neighborhood developments (good or bad) we should know about?
- What's the average days-on-market for RENTAL listings here right now (not sales)? A rising rental-DOM trend means longer vacancies and softer asking-rent achievability than the comps imply.
- What's the recent tenant-quality profile in this submarket — average credit score on applications, eviction rate, late-payment / NSF rate, and stable-employment percentage? A property-management company in the area should have these aggregated.
- How much new for-sale + rental construction is in the pipeline within 1–3 miles? Heavy new supply typically softens prices + rents 12–24 months out; constrained supply supports both.
Investment metrics
- 1% rule
- 0.64% ✗
- Cap rate
- 5.25%
- Cash-on-cash
- -3.72%
- DSCR
- 0.83
- GRM
- 13.0
CMA / ARV
No comps found within radius.
Projected returns pro-forma
-3.0% appreciation · 0.85% rent growth · sell at horizon
- IRR
- -24.6%
- Equity multiple
- 0.17×
- Total profit
- $-70,566
- Equity at exit
- $45,476
- IRR
- -26.8%
- Equity multiple
- -0.17×
- Total profit
- $-100,047
- Equity at exit
- $26,370
Cash invested: $85,398 (down + closing). Projections, not guarantees.
Landlord ↔ Tenant lean methodology
- Overall (STATE)
- 87 Strongly Landlord-Friendly
- State Florida
- 87 Strongly Landlord-Friendly · R+3
- County
- — inherits STATE
- City
- — inherits STATE
ZIP-level market 32137
- Home prices YoY
- -34.5%
- Rents YoY
- 0.8%
- Active inventory
- 1600
- Price-to-rent
- 13.0×
Monthly cashflow live
- Estimated rent
- $1,956 high interval (Pro) →
- Mortgage (P&I)
- −$1,599
- Tax from tax record
- −$83 /mo · $1,000/yr
- Insurance
- −$127
- HOA
- −$0
- Vacancy / Maint / Mgmt
- −$411
- Net cashflow
- $-265
Break-even live
UW: 25.0% down · 7.5% · 30yr · 1.5% tax · 5.0% vac · 8.0% maint · 8.0% mgmt
Financing live
Cash to close
- Down payment
- $76,248
- Closing costs
- $9,150
- Reserves months
- —
- Total cash needed
- —
Loan-product check · same deal, 3 products live
Conventional
25% down · 7.5% · 30yr
- Down + closing
- —
- Monthly P&I
- —
- Monthly cashflow
- —
- DSCR
- —
- Eligible?
- —
Personal DTI + credit; lowest rate.
DSCR
20% down · 8.5% · 30yr
- Down + closing
- —
- Monthly P&I
- —
- Monthly cashflow
- —
- DSCR
- —
- Eligible?
- —
No personal income docs; deal must DSCR.
Hard money
10% down · 12.0% · 12mo
- Down + closing
- —
- Monthly P&I
- —
- Monthly cashflow
- —
- DSCR
- —
- Eligible?
- —
Short-term bridge; refi at stabilization.
Rent comps 27 comps
| Address | Beds | Baths | Sqft | Rent | $/sqft | DOM | Units | Dist |
|---|---|---|---|---|---|---|---|---|
| 12 Bunker View Pl Palm Coast, FL | 3.0 | 2.5 | 1600 | $1,725 | $1.08 | 2d | 1 | 0.28mi |
| 32 Bunker View Dr Unit A Palm Coast, FL | 2.0 | 2.0 | 1434 | $1,500 | $1.05 | 2d | 1 | 0.35mi |
| 14 Bunker View Dr Unit 2 Palm Coast, FL | 3.0 | 2.0 | 1190 | $1,645 | $1.38 | 2d | 1 | 0.44mi |
| 44 Barrington Dr Palm Coast, FL | 4.0 | 2.0 | 1862 | $2,250 | $1.21 | 14d | 1 | 0.58mi |
| 34 Bunker Ln Palm Coast, FL | 4.0 | 2.0 | 1733 | $2,200 | $1.27 | 23d | 1 | 0.60mi |
| 121 Pine Lakes Pkwy N Palm Coast, FL | 1.0–3.0 | 1.0–2.0 | 1090 | $1,966 | $1.80 | 2d | 10 | 0.69mi |
| 11 Birchtree Way Palm Coast, FL | 3.0 | 2.0 | 1360 | $1,800 | $1.32 | 2d | 1 | 0.73mi |
| 24 Barring Pl Palm Coast, FL | 3.0 | 2.0 | 1668 | $1,875 | $1.12 | 23d | 1 | 0.80mi |
| 53 Brownstone Ln Palm Coast, FL | 4.0 | 2.0 | 1582 | $1,950 | $1.23 | 2d | 1 | 0.80mi |
| 10 Buttonworth Dr Palm Coast, FL | 3.0 | 2.0 | 1268 | $1,495 | $1.18 | 21d | 1 | 0.89mi |
| 199 Redbud Rd Palm Coast, FL | 3.0 | 2.5 | 1722 | $1,800 | $1.05 | 23d | 1 | 0.96mi |
| 19 Buttonwell Ln Palm Coast, FL | 3.0 | 2.0 | 1526 | $1,700 | $1.11 | 2d | 1 | 0.96mi |
| 101 Athens Ct Palm Coast, FL | 2.0 | 2.0 | 1170 | $1,516 | $1.30 | 2d | 15 | 0.97mi |
| 14 Buttonwell Ln Palm Coast, FL | 3.0 | 2.0 | 1287 | $1,675 | $1.30 | 2d | 1 | 0.98mi |
| 165 Redbud Rd Palm Coast, FL | 3.0 | 2.5 | 1795 | $1,800 | $1.00 | 2d | 1 | 1.02mi |
| 26 Brooklyn Ln Palm Coast, FL | 4.0 | 2.0 | 1862 | $2,250 | $1.21 | 19d | 1 | 1.03mi |
| 13 Buttonwood Ln Unit B Palm Coast, FL | 3.0 | 2.0 | 1294 | $1,650 | $1.28 | 23d | 1 | 1.04mi |
| 92 Buttonworth Dr Palm Coast, FL | 2.0 | 2.0 | 977 | $1,425 | $1.46 | 2d | 1 | 1.04mi |
| 307 Redbud Rd Palm Coast, FL | 3.0 | 2.5 | 1722 | $1,825 | $1.06 | 23d | 1 | 1.08mi |
| 84 Buttonworth Dr Palm Coast, FL | 3.0 | 2.0 | 1212 | $1,800 | $1.49 | 23d | 1 | 1.10mi |
| 273 Beachway Dr Palm Coast, FL | 3.0 | 2.0 | 1784 | $2,450 | $1.37 | 23d | 1 | 1.14mi |
| 73 Buttonworth Dr Unit B Palm Coast, FL | 3.0 | 2.0 | 1343 | $1,650 | $1.23 | 21d | 1 | 1.17mi |
| 68 Felwood Ln Palm Coast, FL | 3.0 | 2.0 | 1033 | $1,900 | $1.84 | 2d | 1 | 1.19mi |
| 119 Brunswick Ln Palm Coast, FL | 2.0 | 2.0 | 977 | $1,499 | $1.53 | 2d | 1 | 1.22mi |
| 113 Brunswick Ln Unit A Palm Coast, FL | 3.0 | 2.0 | 1198 | $1,550 | $1.29 | 2d | 1 | 1.25mi |
| 30 Farmsworth Dr Unit B Palm Coast, FL | 2.0 | 2.0 | 1019 | $1,600 | $1.57 | 23d | 1 | 1.48mi |
| 87 Fieldstone Ln Unit A Palm Coast, FL | 2.0 | 2.0 | 1146 | $1,475 | $1.29 | 23d | 1 | 1.48mi |
Listing history 11 events
-
2026-05-05status Pending
-
2026-04-30price $304,994
-
2026-03-25soldstatus $212,300
-
2026-03-23$338,494 Active
-
2025-01-03soldstatus $1,255,800
-
2018-03-04historical
-
2018-03-04historical
-
2017-04-04$244,990
-
2017-04-04$244,990
-
2012-11-29soldstatus $121,549
-
2005-10-05soldstatus $75,000
ⓘ Source: listings_history table (triggers on properties + properties_extension) + one-shot
backfill from property_details.listing_events for pre-trigger history.
Tax reassessment forecast FL · Resets to sale price
- Current annual tax
- $1,000 · $83/mo
- Projected year-2 tax
- $2,531 · $211/mo
- Expected delta
- +$1,532/yr (+$128/mo · 153.2%)
ⓘ Screening estimate from a state-policy table — verify with the county assessor before closing.
Climate risk First Street
- Flood 1/10 Low FEMA zone X (unshaded) · 0% chance over 30 yrs
- Wildfire 3/10 Moderate
- Heat 9/10 Extreme 7 d/yr ≥106°F today · 20 d/yr by 30 yrs out
- Wind 10/10 Extreme 99% chance of damaging wind over 30 yrs
- Air quality 2/10 Low 2 unhealthy d/yr today · 2 by 30 yrs out
Nearby sold comps map
Loading sold comps map…
Walkable amenities ~0.75 mi
Loading nearby amenities…
Taxation est. · year 1
- Rental income
- $23,473
- − Mortgage interest
- −$17,084
- − Property taxes
- −$1,000
- − Insurance
- −$1,525
- − Repairs & maintenance
- −$1,878
- − Management
- −$1,878
- − Depreciation
- −$8,873
- Taxable loss
- −$8,764
- Est. tax savings @ 24.0%
- +$2,103
- After-tax cash flow
- $-1,071/yr
For passive investors: Depreciation is non-cash, so a rental often shows a tax loss while cash-flowing — sheltering income. Rental losses are passive: they offset passive income freely, and up to $25,000/yr can offset ordinary (W-2) income if you actively participate and your MAGI is under $100k (phasing out to $0 by $150k); unused losses carry forward. On sale, claimed depreciation is recaptured at up to 25%, and gains may owe capital-gains tax (a 1031 exchange can defer both). Figures are a year-1 estimate at your 24.0% rate — not tax advice; consult a CPA.
Schools (NCES district)
- District
- Flagler
- NCES district ID
- 1200540
- Math proficiency
- 53% ▼ -9.00%
- Reading proficiency
- 56% ▼ -4.00%
- Median HH income
- $48,354
- Composite
- 46.35/100
- National rank
- #2464
- State rank
- #20 of 73 in FL
Livability — Palm Coast
- Score
- 69/100
- State rank
- #478
- US rank
- #8721
Category grades
Schools grade is shown separately in the Schools card above.
Census & demographics
- Census place
- Palm Coast, FL
- County
- Flagler County · 113,412 people
- City population
- 105,049
- Metro
- Deltona-Daytona Beach-Ormond Beach, FL
- Population (ZIP)
- 48,391
- Household income
- $83,923
- Rent vs Own
- Severe rent burden
- 816.0
Population outlook (Flagler County) Hauer SSP2
- Today (2025)
- 123,474 people
- By 2030
- 131,864 · +6.8%
- By 2040
- 146,176 · +18.4%
- By 2050
- 157,398 · +27.5%
- By 2075
- 177,990 · +44.2%
- By 2100
- 183,381 · +48.5%
Race, ethnicity, and origin ACS 2023
- Neighborhood character
- Predominantly White (77%)
- Race & ethnicity
- White 77% Hispanic / Latino 10% Two or more races 8% Black 6% Asian 3%
- Hispanic origin (detail)
- Puerto Rican 4% Cuban 1%
- Common ancestry
- Romanian 4% Russian 2% Lithuanian 2%
- Foreign-born
- 13% · Canada, Jamaica
- Languages at home
- 85% English-only · Spanish 7% Other Indo-European 3% Russian/Polish/Slavic 2%
Political lean MEDSL · Flagler
- 2024 margin
- Strong R (+28.2) · D 35.6% · R 63.8%
- 2008→2024 swing
- -29.8pp toward R · 2008: 1.6pp · 2024: -28.2pp
- All cycles
- 2024: R+28.2 2020: R+20.8 2016: R+20.6 2012: R+7.4 2008: D+1.6
Not yet ingested
- Civics
- —
Market trends
- HPI YoY
- ▼ -153.27%
- Current HPI
- 290.4607
- Rent YoY
- ▲ 0.85%
- Metro
- Deltona-Daytona Beach-Ormond Beach, FL
- State GDP YoY
- ▲ 3.28%
- F500 in state
- 36
Industry mix (Fortune 500 HQ in FL)
| Industry | F500 HQs | Revenue |
|---|---|---|
| Industrial Technology | 2 | $29B |
|
||
| Insurance | 2 | $17B |
|
||
| Retail | 1 | $60B |
|
||
| Technology Distribution | 1 | $58B |
|
||
| Homebuilding | 1 | $35B |
|
||
| Technology Manufacturing | 1 | $35B |
|
||
Price history
+306.7% since first listed11 events — show timeline
- 2026-05-05 Pending — realMLS
- 2026-04-30 Price Changed $304,994 realMLS
- 2026-03-25 Sold (Public Records) $212,300 Public Records
- 2026-03-23 Listed $338,494 realMLS
- 2025-01-03 Sold (Public Records) $1,255,800 Public Records
- 2018-03-04 Listing Removed — Stellar MLS as Distributed by MLS Grid
- 2018-03-04 Listing Removed — Daytona MLS
- 2017-04-04 Listed $244,990 Stellar MLS as Distributed by MLS Grid
- 2017-04-04 Listed $244,990 Daytona MLS
- 2012-11-29 Sold (Public Records) $121,549 Public Records
- 2005-10-05 Sold (Public Records) $75,000 Public Records
Property tax history
+9.1%/yrLatest (2025): $1,000 · +96.7% YoY. Source: county tax records.
Cash-flow waterfall
monthlySold comps — $/sqft
last 12 mo · ≤1 miLoading sold comps…