7025 Dennis #202 · Berkshire Lakes, FL
Flood risk 5/10 · Moderate
- FEMA flood zone
- X (unshaded)
- Chance of flooding over 30 yrs
- 0.24%
- Est. flood insurance / yr
- $507 – $1,088
Fire risk 3/10 · Minor
- Est. fire insurance / yr
- $947 – $1,759
Heat risk No data
- Hot days now (above threshold)
- —
- Hot days in 30 yrs
- —
Wind risk 10/10 · Severe
- Chance of severe wind over 30 yrs
- 99.0%
Air-quality risk 2/10 · Minimal
- Unhealthy air days now
- 2 days/yr
- Unhealthy air days in 30 yrs
- 2 days/yr
Risk factors via First Street. Map © Google.
Why this score? — see what drove the D grade
The composite is a weighted blend of 9 inputs, each scored 0–100. Each bar is that input's sub-score; the figure is the points it added to the 100-point composite (weight × sub-score).
- Cash flow +11.5/30.0
- ARV discount +7.5/15.0
- 1% rule +6.5/10.0
- Schools +5.0/10.0
- DSCR +3.4/10.0
- Livability +2.5/5.0
- Condition / age +2.5/5.0
- Rent growth +2.2/5.0
- Appreciation +0.0/10.0
$230,000
🖨 Deal sheet (PDF) 📄 Offer letter ✓ Due diligence
Listing remarks
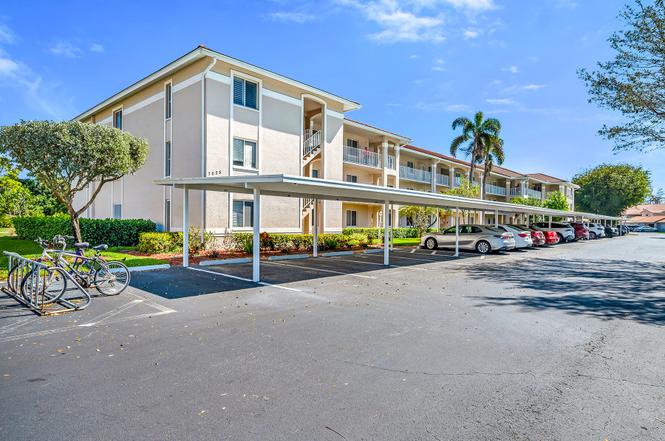
Perfectly positioned within Chatham Square at Glen Eagle, this inviting residence offers a highly sought-after bundled golf membership along with tranquil lake and golf course views. Enjoy tranquil views from your private screened lanai overlooking the lush fairways and sparkling lake, creating a peaceful backdrop for everyday living and relaxed outdoor enjoyment. With a desirable second-floor vantage point and a dedicated carport space, this two-bedroom, two-bath condominium presents an exceptional opportunity to embrace the Naples golf lifestyle. The thoughtfully designed floor plan features a bright and open living and dining area with direct lanai access, allowing the beautiful lake and
Key facts
- Tranquil lake views
- Golf course views
- $669 HOA
Tags
Property features AI
Finance
- Financial info: Unit is part of a multi-unit complex (128 units total; 24 units in building); Two units per floor; single-story building
- HOA & community: Mandatory HOA; Professional management; Master HOA fee paid annually; Condo fee paid quarterly; Maintenance covers cable, insurance, irrigation water, lawn/land maintenance, legal/accounting, exterior pest control, recreation facilities, repairs, reserves, security, sewer, street lights, street maintenance, trash removal and water; Amenities include bike and jog path, billiards, business center, cabana, clubhouse, community pool, community spa/hot tub, library, putting green, sidewalk, streetlight, tennis court, underground utilities; One-time mandatory club fee required; Total annual recurring fees and total one-time fees apply
Exterior
- Parking: 1 assigned covered parking; Detached 1-car carport; Paved driveway; Guest parking
- Security: Community security (included in maintenance)
- Utilities: Central water; Central sewer; Electric power (central)
- Home design: Residential garden apartment in a low-rise (1-3) building; Concrete block construction with stucco finish; Built in 1991; Zero lot line; Unit 202; Rear exposure northeast; Golf-bundled gated community (Glen Eagle / Chatham Square)
- Construction: Concrete block construction; Stucco exterior; Built-up or flat roof; Garden-style building
- Exterior features: Pond; Lake waterfront; Golf course view; Landscaped area view; Water view; Central irrigation; Paved road
Interior
- Kitchen: Electric cooktop; Range; Self-cleaning oven; Dishwasher; Microwave; Refrigerator/Icemaker; Disposal
- Bedrooms: 2 bedrooms (split bedroom floor plan)
- Flooring: Carpet; Tile
- Bathrooms: 2 full bathrooms; Master bathroom with shower only
- Heating & cooling: Central electric heat; Central electric cooling; Ceiling fans; Cable available
- Interior features: Cable prewire; Pantry; Smoke detectors; Walk-in closet; Window coverings; Dining in living area; Eat-in kitchen; Guest bath; Guest room; Screened lanai/porch; Common elevator; Four ceiling fans; Furnished
- Laundry & utility: Washer; Dryer
Neighborhood map
What this means for you Summary
Snapshot
- This is a 2-bed/2.0-bath condo listed at $230k.
Deal economics
- At list price, monthly cash flow is $-74 ($-884/yr) — negative.
- To cash-flow at today's rent, offer at most $217k (5.7% below list).
- Meets the 1% rule at list price ($3k rent vs $230k).
- Recommended offer: $209k (9.0% below list) — sets the bar for market timing.
Location & tenants
- Location reads: area grade D — affects rentability + tenant quality, not the cash-flow math above.
- Collier (suburban): math 60% / reading 56% proficiency, ranked #16 of 73 in FL (top 22%) — acceptable for families but not a draw, mixed tenant base, ~2y average lease.
- Zoned schools: Calusa Park Elementary School (math 59% / reading 56%, grade C+, #764 of 2,144 statewide, top 36%, 707 students, 62% FRL); East Naples Middle School (math 56% / reading 44%, grade C, #254 of 571 statewide, top 45%, 854 students, 63% FRL); Lely High School (math 40% / reading 39%, grade F, #304 of 667 statewide, top 47%, 1,504 students, 54% FRL) — zoned schools at 60% FRL track the district average.
- Market conditions: Rents soft (-1.1%/yr); 438 active listings in the ZIP; 40 comparable units currently listed for rent nearby; rentals at typical pace (median 23d on market — plan ~3-4 weeks tenant-placement turnaround); 3,520 units permitted in Collier County in 2024 (959 in 5+ unit buildings).
- This rent runs 44% of the median local income ($72k/yr) — at the standard rent-burdened threshold; future hikes will face affordability resistance.
Forward outlook
- Local home prices are declining (-3.0%/yr); year-one equity from $2k of loan paydown is wiped out by about $7k of value loss. Plan a longer hold.
- Collier County population projected at +30% by 2050 — long-run rental-demand tailwind backs the buy-and-hold thesis.
Negotiation context
- It's been on market 114 days — a 9% lower offer ($209k) is reasonable based on typical stale-listing flexibility.
- Current owner paid $90k; list at $230k implies a 156% gain — meaningful room to come down on a strong offer.
Risks & watch-outs
- Watch-outs: HOA is 25% of rent.
- Climate carrying-cost: moderate flood risk; severe wind risk, 99% chance of damaging wind over 30y — expect insurance premiums to compound above CPI over the hold.
Questions for the listing agent
- What do current leases actually rent for vs. the listed asking? Can we see a recent rent roll and the last 12 months of T-12 income?
- It's been on market 114 days. Have you received any prior offers? Is the seller open to a 9% concession, seller financing, or rate buy-down credit?
- What does the HOA fee cover, when was the last increase, and are there any pending special assessments or reserve-fund shortfalls?
- Any open or pending special assessments — roof, HVAC, plumbing, elevator, façade? What's the per-unit balance and payoff schedule, and is the seller paying it off at close or rolling it to the buyer?
- Why hasn't it sold? Are there any deal-killer items the seller is aware of (foundation, flood, title, zoning, code violations)?
- Is there a deadline driving the sale (1031 exchange, divorce, estate, relocation)? That informs how much negotiation room exists.
- The area grade is low — what's the realistic commute time and amenity access for the typical tenant pool here? Any planned neighborhood developments (good or bad) we should know about?
- What's the average days-on-market for RENTAL listings here right now (not sales)? A rising rental-DOM trend means longer vacancies and softer asking-rent achievability than the comps imply.
- What's the recent tenant-quality profile in this submarket — average credit score on applications, eviction rate, late-payment / NSF rate, and stable-employment percentage? A property-management company in the area should have these aggregated.
- How much new apartment / multifamily construction is in the pipeline within 1–3 miles? Heavy new supply (>2% of stock underway) typically softens rents 12–24 months out; light construction supports rent growth.
Investment metrics
- 1% rule
- 1.15% ✓
- Cap rate
- 5.91%
- Cash-on-cash
- -1.37%
- DSCR
- 0.94
- GRM
- 7.3
CMA / ARV
No comps found within radius.
Projected returns pro-forma
-3.0% appreciation · 0.0% rent growth · sell at horizon
- IRR
- -23.1%
- Equity multiple
- 0.23×
- Total profit
- $-49,295
- Equity at exit
- $34,294
- IRR
- -35.0%
- Equity multiple
- -0.20×
- Total profit
- $-77,231
- Equity at exit
- $19,886
Cash invested: $64,400 (down + closing). Projections, not guarantees.
Landlord ↔ Tenant lean methodology
- Overall (STATE)
- 87 Strongly Landlord-Friendly
- State Florida
- 87 Strongly Landlord-Friendly · R+3
- County
- — inherits STATE
- City
- — inherits STATE
ZIP-level market 34104
- Rents YoY
- -1.1%
- Active inventory
- 438
- Price-to-rent
- 7.3×
Monthly cashflow live
- Estimated rent
- $2,635 high interval (Pro) →
- Mortgage (P&I)
- −$1,206
- Tax from tax record
- −$184 /mo · $2,209/yr
- Insurance
- −$96
- HOA
- −$669
- Vacancy / Maint / Mgmt
- −$553
- Net cashflow
- $-74
Break-even live
Sensitivity live
| Price | -10% $57 | -5% $-9 | +0% $-74 | +5% $-139 | +10% $-204 |
|---|---|---|---|---|---|
| Rent | -10% $-282 | -5% $-178 | +0% $-74 | +5% $30 | +10% $134 |
| Rate | -1.0pp $42 | -0.5pp $-15 | base $-74 | +0.5pp $-133 | +1.0pp $-194 |
UW: 25.0% down · 7.5% · 30yr · 1.5% tax · 5.0% vac · 8.0% maint · 8.0% mgmt
Financing live
Cash to close
- Down payment
- $57,500
- Closing costs
- $6,900
- Reserves months
- —
- Total cash needed
- —
Loan-product check · same deal, 3 products live
Conventional
25% down · 7.5% · 30yr
- Down + closing
- —
- Monthly P&I
- —
- Monthly cashflow
- —
- DSCR
- —
- Eligible?
- —
Personal DTI + credit; lowest rate.
DSCR
20% down · 8.5% · 30yr
- Down + closing
- —
- Monthly P&I
- —
- Monthly cashflow
- —
- DSCR
- —
- Eligible?
- —
No personal income docs; deal must DSCR.
Hard money
10% down · 12.0% · 12mo
- Down + closing
- —
- Monthly P&I
- —
- Monthly cashflow
- —
- DSCR
- —
- Eligible?
- —
Short-term bridge; refi at stabilization.
Rent comps 40 comps
| Address | Beds | Baths | Sqft | Rent | $/sqft | DOM | Units | Dist |
|---|---|---|---|---|---|---|---|---|
| 7065 Dennis Cir #302 Naples, FL | 2.0 | 2.0 | 1097 | $4,000 | $3.65 | 23d | 1 | 0.05mi |
| 1051 Eastham Way Unit B104 Naples, FL | 2.0 | 2.0 | 1091 | $4,300 | $3.94 | 15d | 1 | 0.07mi |
| 1100 Eastham Way Unit A-105 Naples, FL | 2.0 | 2.0 | 1184 | $4,500 | $3.80 | 15d | 1 | 0.10mi |
| 6700 Dennis Cir Unit A103 Naples, FL | 2.0 | 2.0 | 1308 | $2,000 | $1.53 | 15d | 1 | 0.19mi |
| 6816 Sterling Greens Pl #105 Naples, FL | 2.0 | 2.0 | 1243 | $1,895 | $1.52 | 23d | 1 | 0.31mi |
| 6816 Sterling Greens Dr Unit 1105 Naples, FL | 2.0 | 2.0 | 1243 | $1,895 | $1.52 | 15d | 1 | 0.31mi |
| 6825 Sterling Greens Dr #102 Naples, FL | 3.0 | 2.0 | 1499 | $4,500 | $3.00 | 25d | 1 | 0.35mi |
| 6828 Sterling Greens Dr Unit 4105 Naples, FL | 2.0 | 2.0 | 1242 | $3,750 | $3.02 | 15d | 1 | 0.36mi |
| 6954 Avalon Cir #703 Naples, FL | 2.0 | 2.0 | 1467 | $3,000 | $2.04 | 15d | 1 | 0.45mi |
| 6954 Avalon Cir #702 Naples, FL | 2.0 | 2.0 | 1467 | $4,500 | $3.07 | 25d | 1 | 0.45mi |
| 5301 Whitten Dr #81 Naples, FL | 3.0 | 2.0 | 1386 | $2,700 | $1.95 | 25d | 1 | 0.51mi |
| 5257 Whitten Dr Naples, FL | 2.0 | 2.0 | 1500 | $2,500 | $1.67 | 15d | 1 | 0.52mi |
| 1700 Windy Pines Dr #1 Naples, FL | 2.0 | 2.0 | 1349 | $2,300 | $1.70 | 23d | 1 | 0.54mi |
| 1810 Florida Club Cir Naples, FL | 2.0 | 2.0 | 1200 | $2,075 | $1.73 | 15d | 2 | 0.55mi |
| 1840 Florida Club Cir #5309 Naples, FL | 2.0 | 1.0 | 1328 | $2,300 | $1.73 | 25d | 1 | 0.57mi |
| 7380 Saint Ives Way Naples, FL | 2.0 | 2.0 | 1026 | $4,400 | $4.29 | 25d | 2 | 0.59mi |
| 1820 Florida Club Cir Naples, FL | 3.0 | 2.0 | 1282 | $2,850 | $2.22 | 25d | 2 | 0.60mi |
| 1748 Royal Cir Naples, FL | 3.0 | 2.0 | 1451 | $3,200 | $2.21 | 25d | 1 | 0.61mi |
| 1830 Florida Club Cir #4111 Naples, FL | 3.0 | 2.0 | 1189 | $2,250 | $1.89 | 23d | 1 | 0.62mi |
| 1615 Windy Pines Dr #10 Naples, FL | 2.0 | 2.0 | 1349 | $1,900 | $1.41 | 15d | 1 | 0.62mi |
| 1865 Florida Club Dr #6211 Naples, FL | 3.0 | 2.0 | 1500 | $2,000 | $1.33 | 15d | 1 | 0.62mi |
| 7360 Saint Ives Way #2205 Naples, FL | 2.0 | 2.0 | 1053 | $1,925 | $1.83 | 25d | 1 | 0.63mi |
| 1865 Florida Club Dr Naples, FL | 2.0–3.0 | 1.0–2.0 | 1214 | $1,750 | $1.44 | 25d | 2 | 0.64mi |
| 1835 Florida Club Cir #3201 Naples, FL | 3.0 | 2.0 | 1375 | $2,095 | $1.52 | 15d | 1 | 0.66mi |
| 1645 Windy Pines Dr #6 Naples, FL | 2.0 | 2.0 | 1349 | $2,500 | $1.85 | 23d | 1 | 0.68mi |
| 1670 Windy Pines Dr Naples, FL | 2.0 | 2.0 | 1351 | $4,500 | $3.33 | 25d | 1 | 0.69mi |
| 1875 Florida Club Dr Naples, FL | 2.0 | 1.0 | 1016 | $1,722 | $1.69 | 25d | 2 | 0.71mi |
| 1787 Reuven Cir Unit 1001 Naples, FL | 2.0 | 2.0 | 1112 | $1,300 | $1.17 | 15d | 1 | 0.75mi |
| 4710 Altis Dr Naples, FL | 1.0–3.0 | 1.0–2.0 | 1101 | $2,430 | $2.21 | 15d | 39 | 0.76mi |
| 4640 Santa Barbara Blvd Naples, FL | 2.0–3.0 | 2.0 | 1164 | $1,932 | $1.66 | 25d | 2 | 0.77mi |
| 7320 Glenmoor Ln Unit 2206 Naples, FL | 2.0 | 2.0 | 1053 | $6,000 | $5.70 | 15d | 1 | 0.79mi |
| 190 Santa Clara Dr Unit 190-4 Naples, FL | 2.0 | 2.0 | 1004 | $1,800 | $1.79 | 25d | 1 | 0.80mi |
| 194 Santa Clara Dr Unit 194-3 Naples, FL | 1.0 | 1.0 | 833 | $1,600 | $1.92 | 25d | 1 | 0.82mi |
| 2400 Bayou Ln Unit 7506 Naples, FL | 2.0 | 2.0 | 1351 | $5,000 | $3.70 | 15d | 1 | 0.85mi |
| 2462 Hidden Lake Dr #8 Naples, FL | 2.0 | 2.0 | 1271 | $5,900 | $4.64 | 23d | 1 | 0.87mi |
| 2202 Hidden Lake Dr #4 Naples, FL | 2.0 | 2.0 | 1237 | $2,000 | $1.62 | 15d | 1 | 0.89mi |
| 2265 Hidden Lake Dr #3 Naples, FL | 2.0 | 2.0 | 1349 | $2,100 | $1.56 | 23d | 1 | 0.89mi |
| 161 Santa Clara Dr #14 Naples, FL | 2.0 | 2.0 | 1043 | $2,000 | $1.92 | 23d | 1 | 0.90mi |
| 2448 Hidden Lake Dr #6 Naples, FL | 2.0 | 2.0 | 1237 | $1,750 | $1.41 | 23d | 1 | 0.90mi |
| 150 Santa Clara Dr #15 Naples, FL | 1.0 | 1.0 | 700 | $1,590 | $2.27 | 25d | 1 | 0.91mi |
HOA detail condo
- Monthly dues
- $669 · $8,028/yr
- Assessments
- None detected in remarks — confirm with the listing agent.
Listing history 17 events
-
2026-06-21days on market $230,000 Active 114 DOM
-
2026-06-18days on market $230,000 Active 111 DOM
-
2026-06-17days on market $230,000 Active 110 DOM
-
2026-06-16days on market $230,000 Active 109 DOM
-
2026-06-15days on market $230,000 Active 108 DOM
-
2026-06-14days on market $230,000 Active 106 DOM
-
2026-06-10days on market $230,000 Active 103 DOM
-
2026-06-09days on market $230,000 Active 102 DOM
-
2026-06-08days on market $230,000 Active 101 DOM
-
2026-06-07pricedays on market $230,000 Active 100 DOM
-
2026-06-02days on market $240,000 Active 95 DOM
-
2026-06-01days on market $240,000 Active 94 DOM
-
2026-05-31days on market $240,000 Active 93 DOM
-
2026-05-30days on market $240,000 Active 92 DOM
-
2026-04-09price $240,000
-
2026-02-27$245,000 Active
-
1996-03-11soldstatus $90,000
ⓘ Source: listings_history table (triggers on properties + properties_extension) + one-shot
backfill from property_details.listing_events for pre-trigger history.
Tax reassessment forecast FL · Resets to sale price
- Current annual tax
- $2,209 · $184/mo
- Projected year-2 tax
- $2,209 · $184/mo
- Expected delta
- $0/yr ($0/mo · 0.0%)
ⓘ Screening estimate from a state-policy table — verify with the county assessor before closing.
Climate risk First Street
- Flood 5/10 Major FEMA zone X (unshaded) · 24% chance over 30 yrs
- Wildfire 3/10 Moderate
- Wind 10/10 Extreme 99% chance of damaging wind over 30 yrs
- Air quality 2/10 Low 2 unhealthy d/yr today · 2 by 30 yrs out
Nearby sold comps map
Loading sold comps map…
Walkable amenities ~0.75 mi
Loading nearby amenities…
Taxation est. · year 1
- Rental income
- $31,616
- − Mortgage interest
- −$12,884
- − Property taxes
- −$2,209
- − Insurance
- −$1,150
- − Repairs & maintenance
- −$2,529
- − Management
- −$2,529
- − HOA
- −$8,028
- − Depreciation
- −$6,691
- Taxable loss
- −$4,404
- Est. tax savings @ 24.0%
- +$1,057
- After-tax cash flow
- $173/yr
For passive investors: Depreciation is non-cash, so a rental often shows a tax loss while cash-flowing — sheltering income. Rental losses are passive: they offset passive income freely, and up to $25,000/yr can offset ordinary (W-2) income if you actively participate and your MAGI is under $100k (phasing out to $0 by $150k); unused losses carry forward. On sale, claimed depreciation is recaptured at up to 25%, and gains may owe capital-gains tax (a 1031 exchange can defer both). Figures are a year-1 estimate at your 24.0% rate — not tax advice; consult a CPA.
Schools (NCES district)
- District
- Collier
- NCES district ID
- 1200330
- Math proficiency
- 60% ▼ -4.00%
- Reading proficiency
- 56% ▼ -2.00%
- Median HH income
- $58,275
- Composite
- 50.23/100
- National rank
- #1892
- State rank
- #16 of 73 in FL
Livability — Berkshire Lakes
No livability data for this city. (Only ~50 U.S. cities are tracked.)
Census & demographics
- County
- Collier County · 396,295 people
- Metro
- Naples-Marco Island, FL
- Population (ZIP)
- 26,408
- Household income
- $71,686
- Rent vs Own
- Severe rent burden
- 1423.0
Population outlook (Collier County) Hauer SSP2
- Today (2025)
- 420,858 people
- By 2030
- 450,054 · +6.9%
- By 2040
- 502,232 · +19.3%
- By 2050
- 544,932 · +29.5%
- By 2075
- 627,203 · +49.0%
- By 2100
- 659,015 · +56.6%
Race, ethnicity, and origin ACS 2023
- Neighborhood character
- Majority White (62%)
- Race & ethnicity
- White 62% Hispanic / Latino 30% Two or more races 19% Black 4% Asian 2%
- Hispanic origin (detail)
- Mexican 7% Puerto Rican 3% Cuban 6% Dominican 1%
- Common ancestry
- Lithuanian 6% Romanian 3% Hispanic 2%
- Foreign-born
- 30% · Canada, Jamaica, Dominican Republic
- Languages at home
- 66% English-only · Spanish 24% French/Haitian/Cajun 5% Russian/Polish/Slavic 1%
Political lean MEDSL · Collier
- 2024 margin
- Solid R (+33.1) · D 33.1% · R 66.2%
- 2008→2024 swing
- -10.6pp toward R · 2008: -22.5pp · 2024: -33.1pp
- All cycles
- 2024: R+33.1 2020: R+24.7 2016: R+26.0 2012: R+30.1 2008: R+22.5
Not yet ingested
- Civics
- —
Market trends
- HPI YoY
- ▼ -252.48%
- Current HPI
- 259.3498
- Rent YoY
- ▼ -1.10%
- Metro
- Naples-Marco Island, FL
- State GDP YoY
- ▲ 3.28%
- F500 in state
- 36
Industry mix (Fortune 500 HQ in FL)
| Industry | F500 HQs | Revenue |
|---|---|---|
| Industrial Technology | 2 | $29B |
|
||
| Insurance | 2 | $17B |
|
||
| Retail | 1 | $60B |
|
||
| Technology Distribution | 1 | $58B |
|
||
| Homebuilding | 1 | $35B |
|
||
| Technology Manufacturing | 1 | $35B |
|
||
Price history
+166.7% since first listed3 events — show timeline
- 2026-04-09 Price Changed $240,000 NAPLESMLS
- 2026-02-27 Listed $245,000 NAPLESMLS
- 1996-03-11 Sold (Public Records) $90,000 Public Records
Property tax history
+6.1%/yrLatest (2025): $2,209 · +3.6% YoY. Source: county tax records.
Cash-flow waterfall
monthlySold comps — $/sqft
last 12 mo · ≤1 miLoading sold comps…