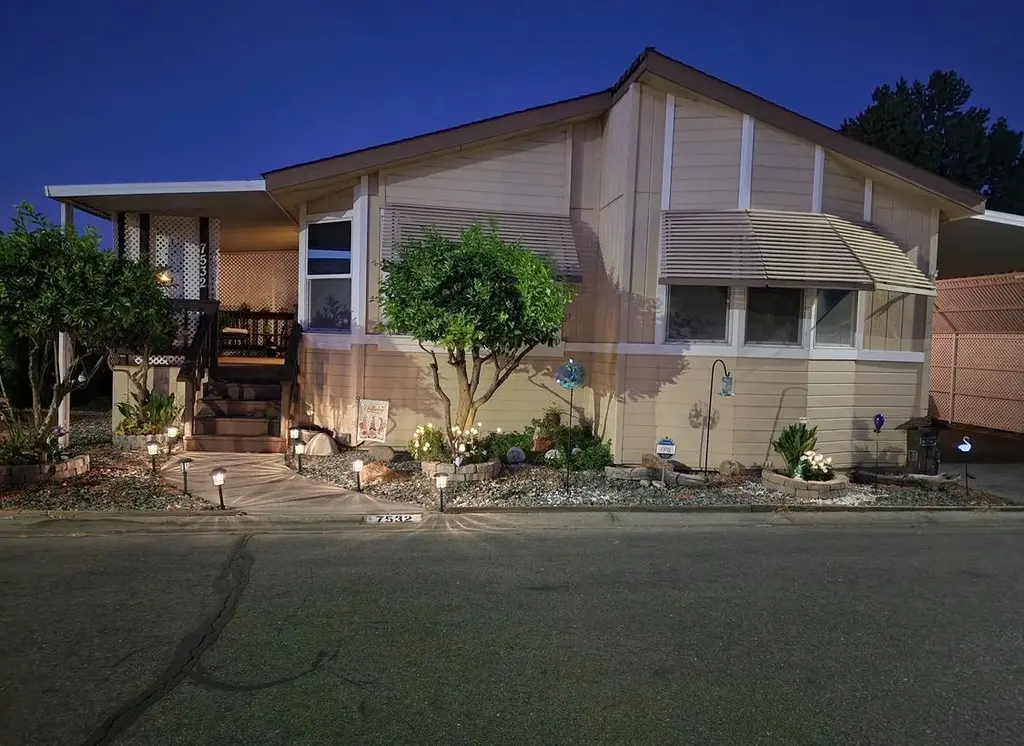
7532 Golden Eye Ln #37 · Citrus Heights, CA
Flood risk 1/10 · Minimal
- FEMA flood zone
- X (unshaded)
- Chance of flooding over 30 yrs
- 0.0%
- Est. flood insurance / yr
- $507 – $1,088
Fire risk 1/10 · Minimal
- Est. fire insurance / yr
- $659 – $1,223
Heat risk 7/10 · Major
- Hot days now (above 103°F)
- 7 days/yr
- Hot days in 30 yrs
- 15 days/yr
Wind risk 1/10 · Minimal
- Chance of severe wind over 30 yrs
- —
Air-quality risk 10/10 · Severe
- Unhealthy air days now
- 34 days/yr
- Unhealthy air days in 30 yrs
- 36 days/yr
Risk factors via First Street. Map © Google.
Why this score? — see what drove the C grade
The composite is a weighted blend of 9 inputs, each scored 0–100. Each bar is that input's sub-score; the figure is the points it added to the 100-point composite (weight × sub-score).
- Cash flow +26.3/30.0
- DSCR +8.9/10.0
- 1% rule +7.0/10.0
- Schools +4.4/10.0
- Condition / age +3.8/5.0
- Rent growth +3.0/5.0
- Livability +3.0/5.0
- ARV discount +0.0/15.0
- Appreciation +0.0/10.0
$195,000
🖨 Deal sheet (PDF) 📄 Offer letter ✓ Due diligence
Listing remarks
Step into a lifestyle of comfort and ease. This inviting 1612 square foot mobile home is ready for you to move in and begin your next chapter. The kitchen has an island, laundry room/mud room, formal dining for intimate dining, with shutters in the kitchen, dining, and office. The office can be transformed into a bedroom, the master bedroom is larger, with Walkin closet and ample storage plus storge behind the closet door, the master bathroom is large with a double sink, garden tub, plenty of storage for all your needs. The hall bathroom has a skylight. The kitchen has a lot of storage cabinets with a beautiful skylight and matching black appliances. Beyond the interiors, discover the tranq
Key facts
- Attached carport
- Private yard
- 2 parking spots
Tags
Property features AI
Finance
- Other: Land lease: No (listed land lease amount present but home not land-lease)
- HOA & community: No homeowners association; Senior community
Exterior
- Parking: 2 parking spaces; Off-street parking; Attached covered parking
- Utilities: Public water; Public sewer; Individual gas meter with natural gas connected; Cable and internet available; 220V in kitchen and laundry
- Home design: Manufactured in-park home; Double wide; Built in 1997
- Construction: Wood skirting; Composition roof; Fleetwood manufactured home
- Exterior features: Fenced yard; Patio awning, carport awning and porch awning; Shed(s); Auto irrigation (sprinklers)
Interior
- Kitchen: Built-in gas oven and built-in gas range; Free-standing gas oven; Hood over range; Dishwasher; Garbage disposal; Microwave; Pantry cabinet; Kitchen island; Skylight(s); Laminate countertops
- Bedrooms: 2 bedrooms (3 possible)
- Flooring: Carpet; Laminate; Linoleum
- Bathrooms: 2 full bathrooms with double sinks, tub and separate shower stall(s)
- Heating & cooling: Central heating (natural gas); Central cooling; Ceiling fan(s)
- Interior features: Cathedral ceiling; Dual-pane windows with coverings and screens; Covered patio and covered deck; Carpeted porch steps
- Laundry & utility: Electric and gas hook-up laundry connections; Gas water heater
Neighborhood map
What this means for you Summary
Snapshot
- This is a 2-bed/2.0-bath manufactured listed at $195k. Condition is rated good.
Deal economics
- At list price, monthly cash flow is $502 ($6k/yr) — positive.
- The deal already cash-flows at list — no discount required.
- Meets the 1% rule at list price ($2k rent vs $195k).
- Recommended offer: $192k (1.5% below list) — sets the bar for market timing.
- Cap rate 9.4% vs local median 3.4% in Citrus Heights — top-decile yield for the area; either an underpriced asset or a hidden risk that comps aren't pricing in. Stress-test before assuming the spread holds.
Location & tenants
- Location reads 60/100 on livability (#614 in CA) — a middle-class / working-renter tenant base. Strengths: housing A+; Watch: crime D-, amenities F, commute F.
- San Juan Unified (suburban): math 40% / reading 62% proficiency, ranked #138 of 517 in CA (top 27%) — acceptable for families but not a draw, mixed tenant base, ~2y average lease.
- Zoned schools: Orangevale Open K-8 (572 students, 22% FRL); Sylvan Middle (647 students, 71% FRL); El Camino Fundamental High (math 34% / reading 62%, grade D, #378 of 1,170 statewide, top 32%, 1,246 students, 50% FRL) — zoned schools at 48% FRL track the district average.
- Market conditions: Rents rising (+1.9%/yr); 219 active listings in the ZIP; 11 comparable units currently listed for rent nearby; rentals leasing fast (median 6d on market — plan ~1-2 weeks tenant-placement turnaround); solid renter incomes; 6,825 units permitted in Sacramento County in 2024 (1,752 in 5+ unit buildings).
- This rent runs 35% of the median local income ($81k/yr) — at the standard rent-burdened threshold; future hikes will face affordability resistance.
Forward outlook
- Local home prices are declining (-3.0%/yr); year-one equity from $1k of loan paydown is wiped out by about $6k of value loss. Plan a longer hold.
- Sacramento County population projected at +17% by 2050 — long-run rental-demand tailwind backs the buy-and-hold thesis.
Negotiation context
- It's been on market 20 days — a 2% lower offer ($192k) is reasonable based on typical stale-listing flexibility.
Risks & watch-outs
- Climate carrying-cost: extreme-heat days projected 7→15/yr by 2055 (HVAC capex compounding) — expect insurance premiums to compound above CPI over the hold.
Questions for the listing agent
- Is there a deadline driving the sale (1031 exchange, divorce, estate, relocation)? That informs how much negotiation room exists.
- Schools are D-rated, which usually means shorter tenancies and higher turnover. Who's the typical renter profile here, and what's been the actual vacancy rate?
- Crime grade is D in this area — have there been break-ins, vandalism, or insurance claims at this property in the last 3 years? What carrier currently insures it and at what premium?
- What's the average days-on-market for RENTAL listings here right now (not sales)? A rising rental-DOM trend means longer vacancies and softer asking-rent achievability than the comps imply.
- What's the recent tenant-quality profile in this submarket — average credit score on applications, eviction rate, late-payment / NSF rate, and stable-employment percentage? A property-management company in the area should have these aggregated.
- How much new for-sale + rental construction is in the pipeline within 1–3 miles? Heavy new supply typically softens prices + rents 12–24 months out; constrained supply supports both.
Investment metrics
- 1% rule
- 1.20% ✓
- Cap rate
- 9.38%
- Cash-on-cash
- 11.03%
- DSCR
- 1.49
- GRM
- 6.9
CMA / ARV
- ARV (on-the-fly)
- $159,588
- Comps found
- 12
Show comp detail 12 sales within ~0.75 mi
| Address | Dist | Beds/Ba | Sqft | Sold | Price | $/sf | Match |
|---|---|---|---|---|---|---|---|
| 7535 Golden Eye Ln #126 | 0.02mi | 3/2.0 (+1) | 1,608 (-0%) | 2mo | $199,800 | $124 | 92 |
| 7533 Pintail Cir | 0.10mi | 3/2.0 (+1) | 1,620 (+0%) | 1mo | $232,500 | $144 | 89 |
| 7508 Bufflehead Ln | 0.09mi | 3/2.0 (+1) | 1,560 (-3%) | 1mo | $165,000 | $106 | 85 |
| 6032 Canvasback Ln | 0.08mi | 2/2.0 | 1,582 (-2%) | 10mo | $119,000 | $75 | 85 |
| 7547 Golden Eye Ln #123 | 0.04mi | 3/2.0 (+1) | 1,480 (-8%) | 2mo | $147,182 | $99 | 78 |
| 7625 Pintail Cir | 0.17mi | 3/2.0 (+1) | 1,550 (-4%) | 9mo | $114,500 | $74 | 73 |
| 7524 Golden Eye Ln | 0.01mi | 3/2.0 (+1) | 1,440 (-11%) | 12mo | $179,900 | $125 | 67 |
| 6000 Cackler #86 | 0.14mi | 2/2.0 | 1,440 (-11%) | 12mo | $85,000 | $59 | 66 |
| 7633 Woodduck Ln #67 | 0.23mi | 3/2.0 (+1) | 1,440 (-11%) | 7mo | $89,450 | $62 | 61 |
| 7412 Newport Ln #144 | 0.33mi | 3/2.0 (+1) | 1,440 (-11%) | 9mo | $117,000 | $81 | 54 |
| 5836 Stonyford | 0.37mi | 3/2.0 (+1) | 1,440 (-11%) | 10mo | $155,900 | $108 | 51 |
| 5844 Hobbs Ln #49 | 0.44mi | 3/2.0 (+1) | 1,400 (-13%) | 11mo | $100,000 | $71 | 43 |
Match score weights: distance 35% · size 25% · config 20% · recency 20%. Top-matched comps best support the ARV.
Projected returns pro-forma
-3.0% appreciation · 1.9% rent growth · sell at horizon
- IRR
- -1.1%
- Equity multiple
- 0.96×
- Total profit
- $-2,164
- Equity at exit
- $29,075
- IRR
- 7.4%
- Equity multiple
- 1.53×
- Total profit
- $29,128
- Equity at exit
- $16,860
Cash invested: $54,600 (down + closing). Projections, not guarantees.
Landlord ↔ Tenant lean methodology
- Overall (STATE)
- 18 Strongly Tenant-Friendly
- State California
- 18 Strongly Tenant-Friendly · D+13
- County
- — inherits STATE
- City
- — inherits STATE
ZIP-level market 95621
- Rents YoY
- 1.9%
- Active inventory
- 219
- Price-to-rent
- 6.9×
Monthly cashflow live
- Estimated rent
- $2,341 high interval (Pro) →
- Mortgage (P&I)
- −$1,023
- Tax est. 1.5%
- −$244 /mo · $2,925/yr
- Insurance
- −$81
- HOA
- −$0
- Vacancy / Maint / Mgmt
- −$492
- Net cashflow
- $502
Break-even live
Sensitivity live
| Price | -10% $637 | -5% $569 | +0% $502 | +5% $434 | +10% $367 |
|---|---|---|---|---|---|
| Rent | -10% $317 | -5% $409 | +0% $502 | +5% $594 | +10% $687 |
| Rate | -1.0pp $600 | -0.5pp $551 | base $502 | +0.5pp $451 | +1.0pp $400 |
UW: 25.0% down · 7.5% · 30yr · 1.5% tax · 5.0% vac · 8.0% maint · 8.0% mgmt
Financing live
Cash to close
- Down payment
- $48,750
- Closing costs
- $5,850
- Reserves months
- —
- Total cash needed
- —
Loan-product check · same deal, 3 products live
Conventional
25% down · 7.5% · 30yr
- Down + closing
- —
- Monthly P&I
- —
- Monthly cashflow
- —
- DSCR
- —
- Eligible?
- —
Personal DTI + credit; lowest rate.
DSCR
20% down · 8.5% · 30yr
- Down + closing
- —
- Monthly P&I
- —
- Monthly cashflow
- —
- DSCR
- —
- Eligible?
- —
No personal income docs; deal must DSCR.
Hard money
10% down · 12.0% · 12mo
- Down + closing
- —
- Monthly P&I
- —
- Monthly cashflow
- —
- DSCR
- —
- Eligible?
- —
Short-term bridge; refi at stabilization.
Rent comps 11 comps
| Address | Beds | Baths | Sqft | Rent | $/sqft | DOM | Units | Dist |
|---|---|---|---|---|---|---|---|---|
| 6319 Misty Wood Way Citrus Heights, CA | 3.0 | 2.0 | 1454 | $2,500 | $1.72 | 45d | 1 | 0.80mi |
| 7120 Van Maren Ln Citrus Heights, CA | 3.0 | 2.0 | 1292 | $2,495 | $1.93 | 19d | 1 | 0.94mi |
| 7135 Cobalt Way Citrus Heights, CA | 3.0 | 1.0 | 1200 | $1,995 | $1.66 | 5d | 1 | 1.02mi |
| 6940 Trailride Way Citrus Heights, CA | 3.0 | 2.0 | 1527 | $2,695 | $1.76 | 45d | 1 | 1.09mi |
| 7613 Luzern Way Antelope, CA | 3.0 | 2.0 | 1401 | $2,500 | $1.78 | 13d | 1 | 1.13mi |
| 7139 Baranga Dr Citrus Heights, CA | 3.0 | 1.5 | 1162 | $2,500 | $2.15 | 3d | 1 | 1.17mi |
| 7629 Downing Place Way Antelope, CA | 3.0 | 2.0 | 1200 | $2,600 | $2.17 | 3d | 1 | 1.20mi |
| 5139 Tweed Ct Antelope, CA | 3.0 | 2.0 | 1260 | $2,500 | $1.98 | 0d | 1 | 1.22mi |
| 6841 Castleberry Cir Citrus Heights, CA | 3.0 | 2.0 | 1162 | $2,300 | $1.98 | 5d | 1 | 1.41mi |
| 7137 Reyn Oaks Way Sacramento, CA | 3.0 | 2.0 | 1279 | $2,455 | $1.92 | 13d | 1 | 1.43mi |
| 7137 Reyn Oaks Way Sacramento, CA | 3.0 | 2.0 | 1279 | $2,450 | $1.92 | 3d | 1 | 1.43mi |
Listing history 14 events
-
2026-06-21days on market $195,000 Active 20 DOM
-
2026-06-18days on market $195,000 Active 17 DOM
-
2026-06-17days on market $195,000 Active 16 DOM
-
2026-06-16days on market $195,000 Active 15 DOM
-
2026-06-15days on market $195,000 Active 14 DOM
-
2026-06-13days on market $195,000 Active 12 DOM
-
2026-06-13days on market $195,000 Active 11 DOM
-
2026-06-09days on market $195,000 Active 8 DOM
-
2026-06-08days on market $195,000 Active 7 DOM
-
2026-06-07days on market $195,000 Active 6 DOM
-
2026-06-05remarks 699-char remark
-
2026-06-05days on market $195,000 Active 3 DOM
-
2026-06-03days on market $195,000 Active 2 DOM
-
2026-06-02$195,000 Active 1 DOM
ⓘ Source: listings_history table (triggers on properties + properties_extension) + one-shot
backfill from property_details.listing_events for pre-trigger history.
Climate risk First Street
- Flood 1/10 Low FEMA zone X (unshaded) · 0% chance over 30 yrs
- Wildfire 1/10 Low
- Heat 7/10 Severe 7 d/yr ≥103°F today · 15 d/yr by 30 yrs out
- Wind 1/10 Low
- Air quality 10/10 Extreme 34 unhealthy d/yr today · 36 by 30 yrs out
Nearby sold comps map
Loading sold comps map…
Walkable amenities ~0.75 mi
Loading nearby amenities…
Taxation est. · year 1
- Rental income
- $28,093
- − Mortgage interest
- −$10,923
- − Property taxes
- −$2,925
- − Insurance
- −$975
- − Repairs & maintenance
- −$2,247
- − Management
- −$2,247
- − Depreciation
- −$5,673
- Taxable income
- $3,102
- Est. tax owed @ 24.0%
- −$744
- After-tax cash flow
- $5,277/yr
For passive investors: Depreciation is non-cash, so a rental often shows a tax loss while cash-flowing — sheltering income. Rental losses are passive: they offset passive income freely, and up to $25,000/yr can offset ordinary (W-2) income if you actively participate and your MAGI is under $100k (phasing out to $0 by $150k); unused losses carry forward. On sale, claimed depreciation is recaptured at up to 25%, and gains may owe capital-gains tax (a 1031 exchange can defer both). Figures are a year-1 estimate at your 24.0% rate — not tax advice; consult a CPA.
Condition & rehab AI · 12 photos
This manufactured home is in good condition with cosmetic updates needed to enhance its curb appeal and interior aesthetics, making it a solid investment.
Repairs flagged
- Minor Kitchen cabinets — Aesthetic update needed.
- Minor Bathtub and sink — Update needed for functionality and aesthetics.
- Minor Carpeted floors — Update needed for durability and appearance.
Value-add opportunities
- Both Painting and updating kitchen cabinets — Enhances curb appeal and interior aesthetics.
- Both Updating countertops and sink — Improves functionality and aesthetics, attracting more buyers.
- Both Replacing carpet with hardwood or tile — Increases durability and adds value for both resale and rental.
Renovation cost estimate screening
| Repair item | Severity | Est. cost |
|---|---|---|
| Kitchen cabinets · Aesthetic update needed. | Minor | $500–3,000 |
| Bathtub and sink · Update needed for functionality and aesthetics. | Minor | $500–3,000 |
| Carpeted floors · Update needed for durability and appearance. | Minor | $500–3,000 |
| Total estimated repair cost · 3 items | $1,500–9,000 |
Value-add ROI direction
- Both Painting and updating kitchen cabinets — Enhances curb appeal and interior aesthetics. ↑
- Both Updating countertops and sink — Improves functionality and aesthetics, attracting more buyers. ↑
- Both Replacing carpet with hardwood or tile — Increases durability and adds value for both resale and rental. ↑
ⓘ Cost ranges are severity-bucket heuristics (US national rule-of-thumb). Get contractor quotes + a written scope before underwriting a rehab budget.
Schools (NCES district)
- District
- San Juan Unified
- NCES district ID
- 0634620
- Math proficiency
- 40% ▲ 3.00%
- Reading proficiency
- 62% ▲ 16.00%
- Median HH income
- $55,655
- Composite
- 44.07/100
- National rank
- #2878
- State rank
- #138 of 517 in CA
Livability — Citrus Heights
- Score
- 60/100
- State rank
- #614
- US rank
- #19580
Category grades
Schools grade is shown separately in the Schools card above.
Census & demographics
- Census place
- Citrus Heights, CA
- County
- Sacramento County · 1,539,646 people
- City population
- 89,370
- Metro
- Sacramento-Roseville-Folsom, CA
- Population (ZIP)
- 42,442
- Household income
- $80,901
- Rent vs Own
- Severe rent burden
- 1854.0
Population outlook (Sacramento County) Hauer SSP2
- Today (2025)
- 1,660,763 people
- By 2030
- 1,732,990 · +4.3%
- By 2040
- 1,855,755 · +11.7%
- By 2050
- 1,941,335 · +16.9%
- By 2075
- 2,046,162 · +23.2%
- By 2100
- 1,961,444 · +18.1%
Race, ethnicity, and origin ACS 2023
- Neighborhood character
- Predominantly White (66%)
- Race & ethnicity
- White 66% Hispanic / Latino 19% Two or more races 11% Asian 6% Black 2%
- Hispanic origin (detail)
- Mexican 16%
- Common ancestry
- Subsaharan African 3% Lithuanian 3% Scotch-Irish 2%
- Foreign-born
- 15% · Canada, Vietnam
- Languages at home
- 78% English-only · Spanish 10% Russian/Polish/Slavic 6% Other Indo-European 3%
Political lean MEDSL · Sacramento
- 2024 margin
- D (+19.7) · D 58.1% · R 38.4% · Other 3.5%
- 2008→2024 swing
- +0.7pp no change · 2008: 19.0pp · 2024: 19.7pp
- All cycles
- 2024: D+19.7 2020: D+25.3 2016: D+23.7 2012: D+16.3 2008: D+19.0
Not yet ingested
- Civics
- —
Market trends
- HPI YoY
- ▼ -408.14%
- Current HPI
- 351.9333
- Rent YoY
- ▲ 1.90%
- Metro
- Sacramento-Roseville-Folsom, CA
- State GDP YoY
- ▲ 3.21%
- F500 in state
- 116
Industry mix (Fortune 500 HQ in CA)
| Industry | F500 HQs | Revenue |
|---|---|---|
| Technology | 27 | $1,492B |
|
||
| Financial Services | 3 | $174B |
|
||
| Retail | 3 | $44B |
|
||
| Insurance | 3 | $26B |
|
||
| Media / Entertainment | 2 | $115B |
|
||
| Pharmaceuticals / Biotech | 2 | $62B |
|
||
Cash-flow waterfall
monthlySold comps — $/sqft
last 12 mo · ≤1 miLoading sold comps…