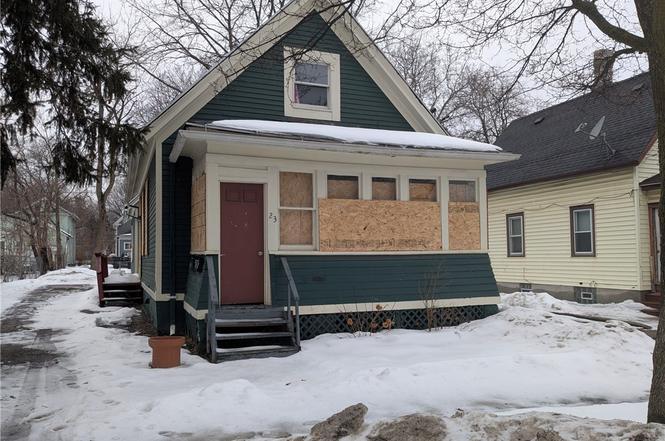
23 7th St · Rochester, NY
Flood risk 1/10 · Minimal
- FEMA flood zone
- X (unshaded)
- Chance of flooding over 30 yrs
- 0.0%
- Est. flood insurance / yr
- $473 – $860
Fire risk 1/10 · Minimal
- Est. fire insurance / yr
- $691 – $1,283
Heat risk 2/10 · Minimal
- Hot days now (above 95°F)
- 7 days/yr
- Hot days in 30 yrs
- 15 days/yr
Wind risk 1/10 · Minimal
- Chance of severe wind over 30 yrs
- —
Air-quality risk 2/10 · Minimal
- Unhealthy air days now
- 1 days/yr
- Unhealthy air days in 30 yrs
- 2 days/yr
Risk factors via First Street. Map © Google.
Why this score? — see what drove the D+ grade
The composite is a weighted blend of 9 inputs, each scored 0–100. Each bar is that input's sub-score; the figure is the points it added to the 100-point composite (weight × sub-score).
- Cash flow +15.0/30.0
- ARV discount +7.5/15.0
- 1% rule +5.0/10.0
- DSCR +5.0/10.0
- Rent growth +4.5/5.0
- Livability +3.8/5.0
- Condition / age +2.5/5.0
- Schools +1.9/10.0
- Appreciation +0.0/10.0
$15,000
🖨 Deal sheet (PDF) 📄 Offer letter ✓ Due diligence
Listing remarks
Great value-add DUPLEX opportunity! Property sustained a house fire on or around 04/12/2026. This fully VACANT property features a front and rear unit, offering strong upside potential for investors with vision. The front unit is a 1-bedroom, 1-bath layout with in-unit laundry hookups, while the rear unit offers 2 bedrooms, 1 bath, and access to basement laundry. Off-street parking adds convenience, and the property is located near public transit. A solid opportunity to build equity and maximize returns. Delayed Negotiations until 04/28/2026 at 5:00 PM.
Key facts
- Near public transit
- Basement laundry
- Off-street parking
Tags
Property features AI
Finance
- Financial info: Two total units; Two separate gas meters; Two separate electric meters; Operating expense details: see remarks; Owner pays: other / see remarks; Rent includes: see remarks
Exterior
- Parking: Paved parking with two or more spaces
- Utilities: Cable available; Public water connected; Sewer connected
- Home design: 2 stories; Existing construction
- Construction: Wood siding; Asphalt roof; Block foundation; Built previously (existing)
- Exterior features: Near public transit; Rectangular, wooded lot
Interior
- Kitchen: No specific appliances listed for kitchens
- Bedrooms: One 1-bedroom unit; One 2-bedroom unit
- Flooring: Hardwood; Tile; Varied flooring
- Bathrooms: Two full bathrooms (total)
- Heating & cooling: Gas heating; Zoned heating; Forced air heating; Zoned cooling
- Interior features: Attic; Natural woodwork
- Laundry & utility: Gas water heater
Neighborhood map
What this means for you Summary
Snapshot
- This is a 3-bed/2.0-bath townhouse listed at $15k.
Deal economics
- At list price, monthly cash flow is $1k ($16k/yr) — positive.
- The deal already cash-flows at list — no discount required.
- Meets the 1% rule at list price ($2k rent vs $15k).
- Recommended offer: $15k (3.0% below list) — sets the bar for market timing.
- Cap rate 110.9% vs local median 9.3% in Rochester — top-decile yield for the area; either an underpriced asset or a hidden risk that comps aren't pricing in. Stress-test before assuming the spread holds.
Location & tenants
- Location reads 76/100 on livability (#222 in NY, #3,482 nationally) — a middle-class / working-renter tenant base. Strengths: commute A+, cost of living A+, housing A+; Watch: crime F, employment F.
- Rochester City School District (urban): math 21% / reading 26% proficiency, ranked #589 of 590 in NY (top 100%) — low school quality limits family demand, transient renter base, plan for 1-2y turnover; 82% free/reduced lunch — lower-income household profile, screen leases tightly.
- Zoned schools: Joseph C Wilson Foundation Academy (math 8% / reading 17%, grade F, #2,049 of 2,108 statewide, top 98%, 404 students, 91% FRL); East Lower School (math 2% / reading 22%, grade F, #715 of 729 statewide, top 98%, 304 students, 86% FRL); Edison Career And Technology High School (math 44% / reading 50%, grade D-, #1,007 of 1,100 statewide, top 93%, 1,233 students, 91% FRL).
- Market conditions: Rents rising fast (+7.9%/yr); 199 active listings in the ZIP; 40 comparable units currently listed for rent nearby; rentals at typical pace (median 23d on market — plan ~3-4 weeks tenant-placement turnaround); 1,169 units permitted in Monroe County in 2024 (591 in 5+ unit buildings).
- This rent runs 34% of the median local income ($65k/yr) — at the standard rent-burdened threshold; future hikes will face affordability resistance.
Forward outlook
- Local home prices are declining (-3.0%/yr); year-one equity from $104 of loan paydown is wiped out by about $450 of value loss. Plan a longer hold.
- Monroe County population projected to shrink 6% by 2050 — rents likely to lag national; underwrite the cash flow, not the appreciation.
- At projected returns (-3.0% appreciation + 7.9% rent growth), your $4k cash investment doubles in ~1 year — after that, you're playing with house money.
Negotiation context
- It's been on market 38 days — a 3% lower offer ($15k) is reasonable based on typical stale-listing flexibility.
- 2 sale attempts; this cycle's ask has dropped $10k (40%) from the opening price — seller is motivated, your offer sets the floor, not the list.
Risks & watch-outs
- Watch-outs: property tax is 4.7% of price; built in 1920 — expect roof / HVAC / electrical / plumbing capex.
Questions for the listing agent
- It's been on market 38 days. Have you received any prior offers? Is the seller open to a 3% concession, seller financing, or rate buy-down credit?
- Built in 1920 — when were the roof, HVAC, electrical panel, plumbing, and water heater last replaced?
- Property tax is high relative to price — has the assessment been appealed recently, and will the sale trigger a re-assessment?
- Is there a deadline driving the sale (1031 exchange, divorce, estate, relocation)? That informs how much negotiation room exists.
- Schools are D-rated, which usually means shorter tenancies and higher turnover. Who's the typical renter profile here, and what's been the actual vacancy rate?
- Crime grade is F in this area — have there been break-ins, vandalism, or insurance claims at this property in the last 3 years? What carrier currently insures it and at what premium?
- The area grade is low — what's the realistic commute time and amenity access for the typical tenant pool here? Any planned neighborhood developments (good or bad) we should know about?
- What's the average days-on-market for RENTAL listings here right now (not sales)? A rising rental-DOM trend means longer vacancies and softer asking-rent achievability than the comps imply.
- What's the recent tenant-quality profile in this submarket — average credit score on applications, eviction rate, late-payment / NSF rate, and stable-employment percentage? A property-management company in the area should have these aggregated.
- How much new for-sale + rental construction is in the pipeline within 1–3 miles? Heavy new supply typically softens prices + rents 12–24 months out; constrained supply supports both.
Investment metrics
- 1% rule
- 12.25% ✓
- Cap rate
- 110.89%
- Cash-on-cash
- 373.56%
- DSCR
- 17.62
- GRM
- 0.7
CMA / ARV
- ARV (on-the-fly)
- $72,226
- Comps found
- 12
Show comp detail 12 sales within ~0.75 mi
| Address | Dist | Beds/Ba | Sqft | Sold | Price | $/sf | Match |
|---|---|---|---|---|---|---|---|
| 51 Niagara St | 0.42mi | 3/2.0 | 1,470 (-0%) | 9mo | $94,000 | $64 | 72 |
| 86 Parsells Ave | 0.27mi | 3/2.0 | 1,485 (+1%) | 22mo | $63,500 | $43 | 68 |
| 479 Bay St | 0.21mi | 4/2.0 (+1) | 1,418 (-4%) | 15mo | $70,000 | $49 | 66 |
| 520 Hayward Ave | 0.41mi | 2/2.0 (-1) | 1,498 (+2%) | 19mo | $115,000 | $77 | 57 |
| 255 6th St | 0.28mi | 2/2.0 (-1) | 1,362 (-8%) | 15mo | $57,500 | $42 | 57 |
| 336 Melville St | 0.68mi | 3/2.0 | 1,552 (+5%) | 4mo | $170,000 | $110 | 56 |
| 245 6th St | 0.26mi | 4/2.0 (+1) | 1,580 (+7%) | 24mo | $70,000 | $44 | 51 |
| 244 Fernwood Ave | 0.71mi | 4/2.0 (+1) | 1,524 (+3%) | 11mo | $75,000 | $49 | 48 |
| 1097 N Goodman St Unit 2UP | 0.52mi | 4/2.0 (+1) | 1,541 (+4%) | 21mo | $125,000 | $81 | 46 |
| 163 Cedarwood Ter | 0.68mi | 3/2.0 | 1,648 (+12%) | 6mo | $150,000 | $91 | 43 |
| 1620 Clifford Ave | 0.58mi | 3/2.0 | 1,650 (+12%) | 20mo | $58,000 | $35 | 37 |
| 1407 E Main St | 0.62mi | 3/2.5 | 1,664 (+13%) | 22mo | $81,000 | $49 | 30 |
Match score weights: distance 35% · size 25% · config 20% · recency 20%. Top-matched comps best support the ARV.
Projected returns pro-forma
-3.0% appreciation · 7.89% rent growth · sell at horizon
- IRR
- —
- Equity multiple
- 22.52×
- Total profit
- $90,380
- Equity at exit
- $2,237
- IRR
- —
- Equity multiple
- 55.57×
- Total profit
- $229,211
- Equity at exit
- $1,297
Cash invested: $4,200 (down + closing). Projections, not guarantees.
Landlord ↔ Tenant lean methodology
- Overall (STATE)
- 15 Strongly Tenant-Friendly
- State New York
- 15 Strongly Tenant-Friendly · D+10
- County
- — inherits STATE
- City
- — inherits STATE
ZIP-level market 14609
- Home prices YoY
- -30.4%
- Rents YoY
- 7.9%
- Active inventory
- 199
- Price-to-rent
- 0.7×
Monthly cashflow live
- Estimated rent
- $1,837 high interval (Pro) →
- Mortgage (P&I)
- −$79
- Tax from tax record
- −$59 /mo · $707/yr
- Insurance
- −$6
- HOA
- −$0
- Vacancy / Maint / Mgmt
- −$386
- Net cashflow
- $1,307
Break-even live
Sensitivity live
| Price | -10% $1,358 | -5% $1,312 | +0% $1,307 | +5% $1,303 | +10% $1,299 |
|---|---|---|---|---|---|
| Rent | -10% $1,162 | -5% $1,235 | +0% $1,307 | +5% $1,380 | +10% $1,453 |
| Rate | -1.0pp $1,315 | -0.5pp $1,311 | base $1,307 | +0.5pp $1,304 | +1.0pp $1,300 |
UW: 25.0% down · 7.5% · 30yr · 1.5% tax · 5.0% vac · 8.0% maint · 8.0% mgmt
Financing live
Cash to close
- Down payment
- $3,750
- Closing costs
- $450
- Reserves months
- —
- Total cash needed
- —
Loan-product check · same deal, 3 products live
Conventional
25% down · 7.5% · 30yr
- Down + closing
- —
- Monthly P&I
- —
- Monthly cashflow
- —
- DSCR
- —
- Eligible?
- —
Personal DTI + credit; lowest rate.
DSCR
20% down · 8.5% · 30yr
- Down + closing
- —
- Monthly P&I
- —
- Monthly cashflow
- —
- DSCR
- —
- Eligible?
- —
No personal income docs; deal must DSCR.
Hard money
10% down · 12.0% · 12mo
- Down + closing
- —
- Monthly P&I
- —
- Monthly cashflow
- —
- DSCR
- —
- Eligible?
- —
Short-term bridge; refi at stabilization.
Rent comps 40 comps
| Address | Beds | Baths | Sqft | Rent | $/sqft | DOM | Units | Dist |
|---|---|---|---|---|---|---|---|---|
| 147 5th St Rochester, NY | 4.0 | 1.0 | 1289 | $1,950 | $1.51 | 22d | 1 | 0.14mi |
| 52 Frances St Rochester, NY | 4.0 | 1.0 | 1256 | $1,595 | $1.27 | 45d | 1 | 0.31mi |
| 126 Parsells Ave Rochester, NY | 3.0 | 1.0 | 1574 | $1,800 | $1.14 | 22d | 1 | 0.35mi |
| 126 Parsells Ave Rochester, NY | 3.0 | 1.0 | 1574 | $1,800 | $1.14 | 45d | 1 | 0.35mi |
| 195 Parsells Ave Rochester, NY | 4.0 | 1.0 | 1413 | $1,265 | $0.90 | 4d | 1 | 0.46mi |
| 86-88 Baycliff Dr Unit 86 Rochester, NY | 2.0 | 1.0 | 900 | $1,030 | $1.14 | 22d | 1 | 0.48mi |
| 47 Priscilla St Rochester, NY | 4.0 | 1.5 | 1250 | $1,900 | $1.52 | 22d | 1 | 0.51mi |
| 222 Ellison St Rochester, NY | 2.0 | 1.0 | 971 | $1,000 | $1.03 | 15d | 1 | 0.57mi |
| 25 Trust St Rochester, NY | 3.0 | 1.5 | 1003 | $1,600 | $1.60 | 4d | 1 | 0.70mi |
| 1890 Clifford Ave Rochester, NY | 3.0 | 1.0 | 936 | $1,800 | $1.92 | 25d | 1 | 0.79mi |
| 459-461 Parsells Ave Rochester, NY | 2.0 | 1.0 | 1053 | $1,450 | $1.38 | 25d | 1 | 0.81mi |
| 395 Alexander St Unit UN12 Rochester, NY | 2.0 | 1.5 | 1226 | $2,200 | $1.79 | 16d | 1 | 0.85mi |
| 127 Carter St #125 Rochester, NY | 2.0 | 1.0 | 1320 | $1,400 | $1.06 | 45d | 1 | 0.86mi |
| 733 University Ave #3 Rochester, NY | 3.0 | 1.5 | 1400 | $1,850 | $1.32 | 45d | 1 | 0.89mi |
| 21 Rundel Park Unit 2 Rochester, NY | 2.0 | 1.0 | 1250 | $2,099 | $1.68 | 20d | 1 | 0.91mi |
| 207 Lux St Rochester, NY | 4.0 | 1.5 | 1728 | $2,150 | $1.24 | 12d | 1 | 0.92mi |
| 811 Portland Ave Rochester, NY | 2.0 | 1.0 | 1616 | $1,300 | $0.80 | 16d | 1 | 0.94mi |
| 420 Rosewood Ter Rochester, NY | 3.0 | 1.0 | 1246 | $1,300 | $1.04 | 4d | 1 | 0.95mi |
| 1159 Culver Rd Unit A2 UP Rochester, NY | 3.0 | 1.0 | 1313 | $1,500 | $1.14 | 45d | 1 | 0.97mi |
| 108 Bowman St Unit 1 Rochester, NY | 3.0 | 1.0 | 1200 | $1,600 | $1.33 | 45d | 1 | 0.98mi |
| 933 University Ave Rochester, NY | 1.0–2.0 | 1.0–2.0 | 1295 | $3,815 | $2.94 | 4d | 12 | 1.01mi |
| 474 East Ave Rochester, NY | 1.0–2.0 | 1.0–2.0 | 1125 | $2,800 | $2.49 | 25d | 1 | 1.03mi |
| 326 Northland Ave Rochester, NY | 3.0 | 1.0 | 1168 | $1,500 | $1.28 | 4d | 1 | 1.06mi |
| 152 Gibbs St Rochester, NY | 1.0–2.0 | 1.0 | 950 | $1,875 | $1.97 | 15d | 3 | 1.11mi |
| 200 East Ave Rochester, NY | 1.0–2.0 | 1.0–2.5 | 936 | $2,481 | $2.65 | 45d | 1 | 1.13mi |
| 176 Roycroft Dr Rochester, NY | 3.0 | 1.0 | 1169 | $950 | $0.81 | 12d | 1 | 1.13mi |
| 128 Gibbs St Unit 136 Rochester, NY | 2.0 | 1.0 | 900 | $1,795 | $1.99 | 12d | 1 | 1.14mi |
| 128 Gibbs St Unit 130 Rochester, NY | 2.0 | 1.0 | 1000 | $1,875 | $1.88 | 12d | 1 | 1.14mi |
| 15 Vick Park B Unit A Rochester, NY | 2.0 | 1.5 | 1616 | $2,350 | $1.45 | 25d | 1 | 1.16mi |
| 171 Mohawk St Rochester, NY | 3.0 | 2.0 | 1054 | $1,775 | $1.68 | 45d | 1 | 1.18mi |
| 182 Laurelton Rd Unit 182 Rochester, NY | 2.0 | 1.5 | 1000 | $1,600 | $1.60 | 12d | 1 | 1.20mi |
| 21 Arnold Park Rochester, NY | 2.0 | 1.0 | 750 | $1,425 | $1.90 | 4d | 15 | 1.23mi |
| 260 Oxford St Unit UP Rochester, NY | 2.0 | 1.0 | 1850 | $2,600 | $1.41 | 45d | 1 | 1.25mi |
| 111 East Ave Rochester, NY | 2.0 | 1.0–2.0 | 614 | $1,900 | $3.09 | 45d | 1 | 1.27mi |
| — Rochester, NY | 2.0 | 1.0 | 896 | $1,100 | $1.23 | 15d | 1 | 1.27mi |
| 1079 Garson Ave Rochester, NY | 3.0 | 1.5 | 1273 | $2,100 | $1.65 | 12d | 1 | 1.29mi |
| 49 East Ave Apt 212 Rochester, NY | 2.0 | 2.0 | 961 | $2,572 | $2.68 | 4d | 1 | 1.30mi |
| 14 Franklin St Rochester, NY | 2.0 | 1.0–2.0 | 1345 | $3,477 | $2.59 | 4d | 8 | 1.33mi |
| 9 Rowley St Unit 3 Rochester, NY | 2.0 | 1.0 | 966 | $1,550 | $1.60 | 25d | 1 | 1.33mi |
| 322 Wisconsin St Rochester, NY | 2.0 | 1.0 | 1100 | $1,200 | $1.09 | 22d | 1 | 1.34mi |
Listing history 7 events
-
2026-05-13status Pending
-
2026-04-29historical Active Under Contract
-
2026-04-16status Active
-
2026-04-16price $15,000
-
2026-03-03status Pending
-
2026-02-20$25,000 Active
-
2021-10-29soldstatus $42,000
ⓘ Source: listings_history table (triggers on properties + properties_extension) + one-shot
backfill from property_details.listing_events for pre-trigger history.
Tax reassessment forecast NY · Partial reset (capped growth)
- Current annual tax
- $707 · $59/mo
- Projected year-2 tax
- $707 · $59/mo
- Expected delta
- $0/yr ($0/mo · 0.0%)
ⓘ Screening estimate from a state-policy table — verify with the county assessor before closing.
Climate risk First Street
- Flood 1/10 Low FEMA zone X (unshaded) · 0% chance over 30 yrs
- Wildfire 1/10 Low
- Heat 2/10 Low 7 d/yr ≥95°F today · 15 d/yr by 30 yrs out
- Wind 1/10 Low
- Air quality 2/10 Low 1 unhealthy d/yr today · 2 by 30 yrs out
Nearby sold comps map
Loading sold comps map…
Walkable amenities ~0.75 mi
Loading nearby amenities…
Taxation est. · year 1
- Rental income
- $22,045
- − Mortgage interest
- −$840
- − Property taxes
- −$707
- − Insurance
- −$75
- − Repairs & maintenance
- −$1,764
- − Management
- −$1,764
- − Depreciation
- −$436
- Taxable income
- $16,459
- Est. tax owed @ 24.0%
- −$3,950
- After-tax cash flow
- $11,739/yr
For passive investors: Depreciation is non-cash, so a rental often shows a tax loss while cash-flowing — sheltering income. Rental losses are passive: they offset passive income freely, and up to $25,000/yr can offset ordinary (W-2) income if you actively participate and your MAGI is under $100k (phasing out to $0 by $150k); unused losses carry forward. On sale, claimed depreciation is recaptured at up to 25%, and gains may owe capital-gains tax (a 1031 exchange can defer both). Figures are a year-1 estimate at your 24.0% rate — not tax advice; consult a CPA.
Schools (NCES district)
- District
- Rochester City School District
- NCES district ID
- 3624750
- Math proficiency
- 21% ▬ 0.00%
- Reading proficiency
- 26% ▲ 4.00%
- Median HH income
- $30,923
- Composite
- 18.98/100
- National rank
- #8850
- State rank
- #589 of 590 in NY
Livability — Rochester
- Score
- 76/100
- State rank
- #222
- US rank
- #3482
Category grades
Schools grade is shown separately in the Schools card above.
Census & demographics
- Census place
- Rochester, NY
- County
- Monroe County · 674,131 people
- City population
- 432,803
- Metro
- Rochester, NY
- Population (ZIP)
- 40,274
- Household income
- $64,603
- Rent vs Own
- Severe rent burden
- 2183.0
Population outlook (Monroe County) Hauer SSP2
- Today (2025)
- 759,460 people
- By 2030
- 757,154 · -0.3%
- By 2040
- 740,644 · -2.5%
- By 2050
- 714,443 · -5.9%
- By 2075
- 645,883 · -15.0%
- By 2100
- 547,084 · -28.0%
Race, ethnicity, and origin ACS 2023
- Neighborhood character
- Diverse neighborhood (Simpson 0.69)
- Race & ethnicity
- White 44% Black 28% Hispanic / Latino 20% Two or more races 10% Asian 2%
- Hispanic origin (detail)
- Puerto Rican 15% Cuban 1% Dominican 1%
- Common ancestry
- Romanian 4% Lithuanian 2% Iranian 1%
- Foreign-born
- 8% · Canada
- Languages at home
- 81% English-only · Spanish 14% Russian/Polish/Slavic 2% Other Indo-European 1%
Political lean MEDSL · Monroe
- 2024 margin
- D (+19.1) · D 59.5% · R 40.5%
- 2008→2024 swing
- +1.4pp toward D · 2008: 17.7pp · 2024: 19.1pp
- All cycles
- 2024: D+19.1 2020: D+21.0 2016: D+14.1 2012: D+17.4 2008: D+17.7
Not yet ingested
- Civics
- —
Market trends
- HPI YoY
- ▼ -143.57%
- Current HPI
- 328.7053
- Rent YoY
- ▲ 7.89%
- Metro
- Rochester, NY
- State GDP YoY
- ▲ 2.60%
- F500 in state
- 92
Industry mix (Fortune 500 HQ in NY)
| Industry | F500 HQs | Revenue |
|---|---|---|
| Financial Services | 10 | $950B |
|
||
| Consumer Goods | 9 | $162B |
|
||
| Insurance | 4 | $225B |
|
||
| Telecommunications | 2 | $144B |
|
||
| Pharmaceuticals | 2 | $112B |
|
||
| Media / Entertainment | 2 | $69B |
|
||
Price history
-64.3% since first listed7 events — show timeline
- 2026-05-13 Pending — UNYREIS
- 2026-04-29 Contingent — UNYREIS
- 2026-04-16 Relisted — UNYREIS
- 2026-04-16 Price Changed $15,000 UNYREIS
- 2026-03-03 Pending — UNYREIS
- 2026-02-20 Listed $25,000 UNYREIS
- 2021-10-29 Sold (Public Records) $42,000 Public Records
Property tax history
+4.3%/yrLatest (2025): $707 · +0.0% YoY. Source: county tax records.
Cash-flow waterfall
monthlySold comps — $/sqft
last 12 mo · ≤1 miLoading sold comps…