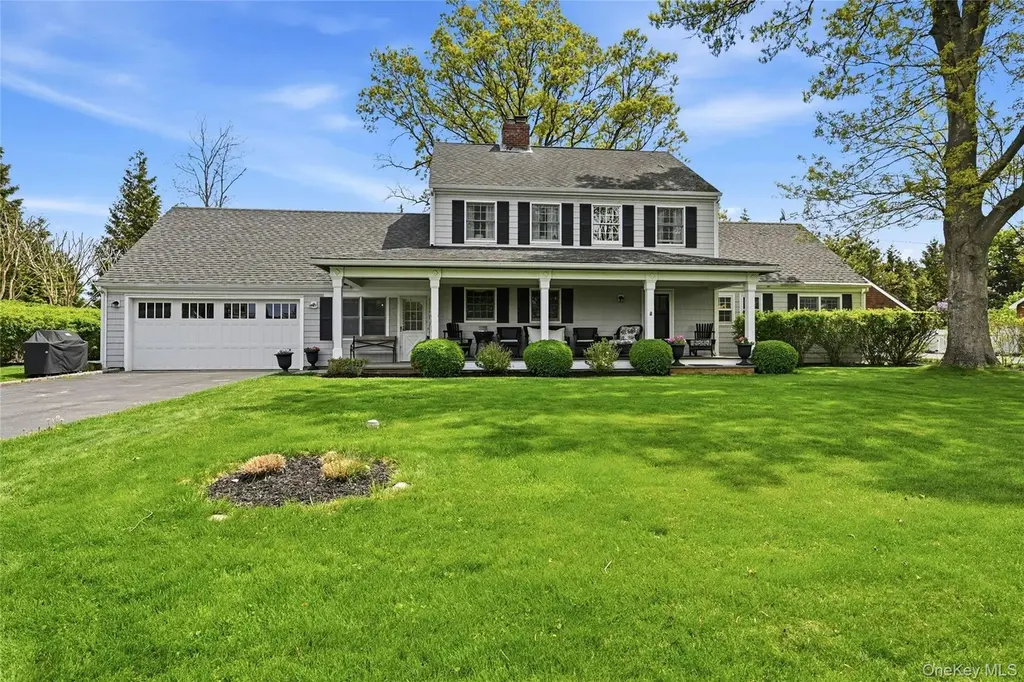
1060 Navy St · Orient, NY
Flood risk 1/10 · Minimal
- FEMA flood zone
- X (unshaded)
- Chance of flooding over 30 yrs
- 0.0%
- Est. flood insurance / yr
- $473 – $860
Fire risk 1/10 · Minimal
- Est. fire insurance / yr
- $691 – $1,283
Heat risk 5/10 · Moderate
- Hot days now (above 90°F)
- 7 days/yr
- Hot days in 30 yrs
- 19 days/yr
Wind risk 8/10 · Major
- Chance of severe wind over 30 yrs
- 80.0%
Air-quality risk 2/10 · Minimal
- Unhealthy air days now
- 2 days/yr
- Unhealthy air days in 30 yrs
- 2 days/yr
Risk factors via First Street. Map © Google.
Why this score? — see what drove the A grade
The composite is a weighted blend of 9 inputs, each scored 0–100. Each bar is that input's sub-score; the figure is the points it added to the 100-point composite (weight × sub-score).
- Cash flow +30.0/30.0
- ARV discount +15.0/15.0
- DSCR +10.0/10.0
- Appreciation +10.0/10.0
- 1% rule +9.0/10.0
- Schools +4.3/10.0
- Livability +2.9/5.0
- Rent growth +2.5/5.0
- Condition / age +2.5/5.0
$1,625,000
🖨 Deal sheet (PDF) 📄 Offer letter ✓ Due diligence
Listing remarks
Orient Village- located on a quiet street in the coveted coastal village of Orient, this beautifully maintained 4-bedroom, 2.5-bath home borders preserved land, offering exceptional privacy and a serene natural setting. A welcoming wide front porch sets the tone before entering the foyer, which opens to a spacious living room with a wood-burning fireplace. The home features a large eat-in kitchen, formal dining room, and a sun-filled sunroom overlooking the backyard and gardens. In addition, the first floor includes a generously sized primary bedroom, an additional guest bedroom, and a full bath, providing convenient main-level living. Upstairs, a large loft area offers flexible space for a
Key facts
- Large loft area
- Flexible space
- Large eat in kitchen
Tags
Property features AI
Exterior
- Parking: Driveway; Garage; Off-street parking; On-street parking; Private parking; 2-car garage
- Utilities: Cesspool / septic tank
- Home design: Single family residence; Updated / remodeled; Two levels; Basement present (full, unfinished) with Bilco door(s); Attic unfinished (see remarks)
- Construction: Frame construction
- Exterior features: Fenced back yard; Level lot; Covered porch
Interior
- Kitchen: Dishwasher; Gas oven; Gas range; Refrigerator; Granite counters; Eat-in kitchen
- Bedrooms: Includes a first-floor bedroom
- Flooring: Hardwood
- Bathrooms: 2 full bathrooms; 1 half bathroom
- Heating & cooling: Baseboard heating; Hot water heating; Natural gas heating; No central cooling
- Interior features: First-floor bedroom; First-floor full bath; Double vanity; Eat-in kitchen; Entrance foyer; Formal dining room; Granite counters; Primary bathroom; Master bedroom on main level; Loft; Covered porch
- Laundry & utility: Dryer; Gas water heater
Neighborhood map
What this means for you Summary
Snapshot
- This is a 4-bed/2.5-bath single-family listed at $1.62M.
Deal economics
- At list price, monthly cash flow is $8k ($97k/yr) — positive.
- The deal already cash-flows at list — no discount required.
- Meets the 1% rule at list price ($23k rent vs $1.62M).
- Recommended offer: $1.58M (3.0% below list) — sets the bar for market timing.
Location & tenants
- Location reads 57/100 on livability (#1,080 in NY) — a working-class tenant base; expect higher turnover. Strengths: crime A+, employment A+; Watch: amenities F, commute F, cost of living F.
- Oysterponds Union Free School District (rural): math 30% / reading 60% proficiency, ranked #506 of 755 in NY (top 67%) — families likely to look elsewhere, expect single-tenant / working-renter base with shorter leases; only 4% free/reduced lunch — higher-income household profile.
- Zoned schools: Oysterponds Elementary School (math 54% / reading 64%, grade B-, #745 of 2,108 statewide, top 39%, 80 students, 0% FRL) — zoned schools at 0% FRL track the district average.
- Zoned-school proficiency averages 60% at this address vs 45% district-wide (+14 pts) — the actual schools serving this property are materially stronger than the Oysterponds Union Free School District average implies; a family-tenant draw the district grade alone would hide.
- Market conditions: 25 active listings in the ZIP; 6 comparable units currently listed for rent nearby; rentals lingering (median 45d on market — plan ~5-8 weeks vacancy on turnover, expect pricing pressure); 67% of comp listings sitting > 30 days — soft ceiling on asking rent; 1,366 units permitted in Suffolk County in 2024 (216 in 5+ unit buildings).
Forward outlook
- In year one you build about $174k of equity ($11k loan paydown + $162k appreciation (10.0% local appreciation)).
- Suffolk County population projected to shrink 5% by 2050 — rents likely to lag national; underwrite the cash flow, not the appreciation.
- At projected returns (10.0% appreciation + 3.0% rent growth), your $455k cash investment doubles in ~2 years — after that, you're playing with house money.
- By year 2, paydown + projected appreciation supports a ~$279k cash-out refi (75% LTV) — recoverable capital for the next deal without selling this one.
Negotiation context
- It's been on market 38 days — a 3% lower offer ($1.58M) is reasonable based on typical stale-listing flexibility.
- Current owner paid $200k; list at $1.62M implies a 712% gain — meaningful room to come down on a strong offer.
Risks & watch-outs
- Climate carrying-cost: severe wind risk, 80% chance of damaging wind over 30y; extreme-heat days projected 7→19/yr by 2055 (HVAC capex compounding) — expect insurance premiums to compound above CPI over the hold.
Questions for the listing agent
- It's been on market 38 days. Have you received any prior offers? Is the seller open to a 3% concession, seller financing, or rate buy-down credit?
- Built in 1965 — when were the roof, HVAC, electrical panel, plumbing, and water heater last replaced?
- Is there a deadline driving the sale (1031 exchange, divorce, estate, relocation)? That informs how much negotiation room exists.
- What's the average days-on-market for RENTAL listings here right now (not sales)? A rising rental-DOM trend means longer vacancies and softer asking-rent achievability than the comps imply.
- What's the recent tenant-quality profile in this submarket — average credit score on applications, eviction rate, late-payment / NSF rate, and stable-employment percentage? A property-management company in the area should have these aggregated.
- How much new for-sale + rental construction is in the pipeline within 1–3 miles? Heavy new supply typically softens prices + rents 12–24 months out; constrained supply supports both.
Investment metrics
- 1% rule
- 1.40% ✓
- Cap rate
- 12.29%
- Cash-on-cash
- 21.40%
- DSCR
- 1.95
- GRM
- 6.0
CMA / ARV
- ARV (median comp)
- $2,233,514
- List price
- $1,625,000
- Delta
- -27.24%
- Verdict
- UNDERPRICED
- Comps
- 14 within 1.0 mi
Show comp detail 5 sales within ~0.75 mi
| Address | Dist | Beds/Ba | Sqft | Sold | Price | $/sf | Match |
|---|---|---|---|---|---|---|---|
| 595 King St | 0.15mi | 3/3.0 (-1) | 2,851 (+12%) | 12mo | $1,701,320 | $597 | 55 |
| 1075 Narrow River Rd | 0.56mi | 4/2.5 | 2,264 (-11%) | 6mo | $1,800,000 | $795 | 51 |
| 640 Diedricks Rd | 0.71mi | 3/2.0 (-1) | 2,597 (+2%) | 22mo | $2,250,000 | $866 | 38 |
| 25105 Main Rd | 0.67mi | 4/3.0 | 2,313 (-9%) | 18mo | $800,000 | $346 | 38 |
| 305 Narrow River Rd | 0.55mi | 3/3.5 (-1) | 2,870 (+13%) | 8mo | $2,350,000 | $819 | 37 |
Match score weights: distance 35% · size 25% · config 20% · recency 20%. Top-matched comps best support the ARV.
Projected returns pro-forma
10.0% appreciation · 3.0% rent growth · sell at horizon
- IRR
- 40.3%
- Equity multiple
- 4.08×
- Total profit
- $1,401,402
- Equity at exit
- $1,463,929
- IRR
- 34.7%
- Equity multiple
- 9.17×
- Total profit
- $3,719,422
- Equity at exit
- $3,157,018
Cash invested: $455,000 (down + closing). Projections, not guarantees.
Landlord ↔ Tenant lean methodology
- Overall (STATE)
- 15 Strongly Tenant-Friendly
- State New York
- 15 Strongly Tenant-Friendly · D+10
- County
- — inherits STATE
- City
- — inherits STATE
ZIP-level market 11957
- Home prices YoY
- 6.6%
- Active inventory
- 25
- Price-to-rent
- 6.0×
Monthly cashflow live
- Estimated rent
- $22,745 medium interval (Pro) →
- Mortgage (P&I)
- −$8,522
- Tax from tax record
- −$654 /mo · $7,852/yr
- Insurance
- −$677
- HOA
- −$0
- Vacancy / Maint / Mgmt
- −$4,776
- Net cashflow
- $8,116
Break-even live
Sensitivity live
| Price | -10% $9,035 | -5% $8,576 | +0% $8,116 | +5% $7,656 | +10% $7,196 |
|---|---|---|---|---|---|
| Rent | -10% $6,319 | -5% $7,217 | +0% $8,116 | +5% $9,014 | +10% $9,912 |
| Rate | -1.0pp $8,934 | -0.5pp $8,529 | base $8,116 | +0.5pp $7,695 | +1.0pp $7,266 |
UW: 25.0% down · 7.5% · 30yr · 1.5% tax · 5.0% vac · 8.0% maint · 8.0% mgmt
Financing live
Cash to close
- Down payment
- $406,250
- Closing costs
- $48,750
- Reserves months
- —
- Total cash needed
- —
Loan-product check · same deal, 3 products live
Conventional
25% down · 7.5% · 30yr
- Down + closing
- —
- Monthly P&I
- —
- Monthly cashflow
- —
- DSCR
- —
- Eligible?
- —
Personal DTI + credit; lowest rate.
DSCR
20% down · 8.5% · 30yr
- Down + closing
- —
- Monthly P&I
- —
- Monthly cashflow
- —
- DSCR
- —
- Eligible?
- —
No personal income docs; deal must DSCR.
Hard money
10% down · 12.0% · 12mo
- Down + closing
- —
- Monthly P&I
- —
- Monthly cashflow
- —
- DSCR
- —
- Eligible?
- —
Short-term bridge; refi at stabilization.
Rent comps 6 comps
| Address | Beds | Baths | Sqft | Rent | $/sqft | DOM | Units | Dist |
|---|---|---|---|---|---|---|---|---|
| 1855 Village Ln Orient, NY | 3.0 | 2.0 | 2556 | $15,000 | $5.87 | 45d | 1 | 0.11mi |
| 1800 Village Ln Orient, NY | 3.0 | 2.5 | 2200 | $7,000 | $3.18 | 45d | 1 | 0.13mi |
| 1060 Willow Terrace Ln Orient, NY | 4.0 | 4.0 | 3600 | $30,000 | $8.33 | 14d | 1 | 0.38mi |
| 400 Youngs Rd Orient, NY | 4.0 | 4.5 | 3300 | $50,000 | $15.15 | 45d | 1 | 0.41mi |
| 1390 Willow Terrace Ln Orient, NY | 4.0 | 4.5 | 2800 | $10,000 | $3.57 | 26d | 1 | 0.43mi |
| 2100 Youngs Rd Orient, NY | 5.0 | 3.0 | 3000 | $28,000 | $9.33 | 45d | 1 | 0.75mi |
Listing history 19 events
-
2026-06-21days on market $1,625,000 Active 38 DOM
-
2026-06-21pricedays on market $1,625,000 Active 37 DOM
-
2026-06-18days on market $1,750,000 Active 35 DOM
-
2026-06-17days on market $1,750,000 Active 34 DOM
-
2026-06-16days on market $1,750,000 Active 33 DOM
-
2026-06-15days on market $1,750,000 Active 32 DOM
-
2026-06-13days on market $1,750,000 Active 30 DOM
-
2026-06-12days on market $1,750,000 Active 29 DOM
-
2026-06-09days on market $1,750,000 Active 26 DOM
-
2026-06-08days on market $1,750,000 Active 25 DOM
-
2026-06-07days on market $1,750,000 Active 24 DOM
-
2026-06-07days on market $1,750,000 Active 23 DOM
-
2026-06-04days on market $1,750,000 Active 20 DOM
-
2026-06-02days on market $1,750,000 Active 19 DOM
-
2026-06-01days on market $1,750,000 Active 18 DOM
-
2026-05-31days on market $1,750,000 Active 17 DOM
-
2026-05-14$1,750,000 Active 1288-char remark
-
1999-01-11soldstatus $200,000
-
1991-08-06soldstatus $190,000
ⓘ Source: listings_history table (triggers on properties + properties_extension) + one-shot
backfill from property_details.listing_events for pre-trigger history.
Tax reassessment forecast NY · Partial reset (capped growth)
- Current annual tax
- $7,852 · $654/mo
- Projected year-2 tax
- $17,657 · $1,471/mo
- Expected delta
- +$9,805/yr (+$817/mo · 124.9%)
ⓘ Screening estimate from a state-policy table — verify with the county assessor before closing.
Climate risk First Street
- Flood 1/10 Low FEMA zone X (unshaded) · 0% chance over 30 yrs
- Wildfire 1/10 Low
- Heat 5/10 Major 7 d/yr ≥90°F today · 19 d/yr by 30 yrs out
- Wind 8/10 Severe 80% chance of damaging wind over 30 yrs
- Air quality 2/10 Low 2 unhealthy d/yr today · 2 by 30 yrs out
Nearby sold comps map
Loading sold comps map…
Walkable amenities ~0.75 mi
Loading nearby amenities…
Taxation est. · year 1
- Rental income
- $272,943
- − Mortgage interest
- −$91,025
- − Property taxes
- −$7,852
- − Insurance
- −$8,125
- − Repairs & maintenance
- −$21,835
- − Management
- −$21,835
- − Depreciation
- −$47,273
- Taxable income
- $74,996
- Est. tax owed @ 24.0%
- −$17,999
- After-tax cash flow
- $79,388/yr
For passive investors: Depreciation is non-cash, so a rental often shows a tax loss while cash-flowing — sheltering income. Rental losses are passive: they offset passive income freely, and up to $25,000/yr can offset ordinary (W-2) income if you actively participate and your MAGI is under $100k (phasing out to $0 by $150k); unused losses carry forward. On sale, claimed depreciation is recaptured at up to 25%, and gains may owe capital-gains tax (a 1031 exchange can defer both). Figures are a year-1 estimate at your 24.0% rate — not tax advice; consult a CPA.
Schools (NCES district)
- District
- Oysterponds Union Free School District
- NCES district ID
- 3621930
- Math proficiency
- 30% ▼ -10.00%
- Reading proficiency
- 60% ▲ 20.00%
- Median HH income
- $71,948
- Composite
- 42.9/100
- National rank
- #6712
- State rank
- #506 of 755 in NY
Livability — Orient
- Score
- 57/100
- State rank
- #1080
- US rank
- #21725
Category grades
Schools grade is shown separately in the Schools card above.
Census & demographics
- Census place
- Orient, NY
- Population (ZIP)
- 1,152
Population outlook (Suffolk County) Hauer SSP2
- Today (2025)
- 1,505,262 people
- By 2030
- 1,498,318 · -0.5%
- By 2040
- 1,471,101 · -2.3%
- By 2050
- 1,424,848 · -5.3%
- By 2075
- 1,337,157 · -11.2%
- By 2100
- 1,217,720 · -19.1%
Race, ethnicity, and origin ACS 2023
- Neighborhood character
- Predominantly White (96%)
- Race & ethnicity
- White 96% Hispanic / Latino 2%
- Common ancestry
- Romanian 5% Scotch-Irish 3% Iranian 3%
- Foreign-born
- 17% · Canada, China
- Languages at home
- 85% English-only · Other Asian/Pacific 5% Russian/Polish/Slavic 3% Other Indo-European 2%
Political lean MEDSL · Suffolk
- 2024 margin
- Lean R (+10.0) · D 45.0% · R 55.0%
- 2008→2024 swing
- -16.0pp toward R · 2008: 6.0pp · 2024: -10.0pp
- All cycles
- 2024: R+10.0 2020: R+0.0 2016: R+8.2 2012: D+2.9 2008: D+6.0
Not yet ingested
- Civics
- —
Market trends
- HPI YoY
- ▲ 16.41%
- Current HPI
- 265.16
- Rent YoY
- —
- Metro
- —
- State GDP YoY
- ▲ 2.60%
- F500 in state
- 92
Industry mix (Fortune 500 HQ in NY)
| Industry | F500 HQs | Revenue |
|---|---|---|
| Financial Services | 10 | $950B |
|
||
| Consumer Goods | 9 | $162B |
|
||
| Insurance | 4 | $225B |
|
||
| Telecommunications | 2 | $144B |
|
||
| Pharmaceuticals | 2 | $112B |
|
||
| Media / Entertainment | 2 | $69B |
|
||
Price history
+821.1% since first listed3 events — show timeline
- 2026-05-14 Listed $1,750,000 OneKey® MLS as Distributed by MLS Grid
- 1999-01-11 Sold (Public Records) $200,000 Public Records
- 1991-08-06 Sold (Public Records) $190,000 Public Records
Property tax history
+1.1%/yrLatest (2025): $7,852 · +0.0% YoY. Source: county tax records.
Cash-flow waterfall
monthlySold comps — $/sqft
last 12 mo · ≤1 miLoading sold comps…