11835 Verbena Blf · San Antonio, TX
Flood risk No data
- FEMA flood zone
- —
- Chance of flooding over 30 yrs
- —
- Est. flood insurance / yr
- —
Fire risk No data
- Est. fire insurance / yr
- —
Heat risk No data
- Hot days now (above threshold)
- —
- Hot days in 30 yrs
- —
Wind risk No data
- Chance of severe wind over 30 yrs
- —
Air-quality risk No data
- Unhealthy air days now
- —
- Unhealthy air days in 30 yrs
- —
Risk factors via First Street. Map © Google.
Why this score? — see what drove the C- grade
The composite is a weighted blend of 9 inputs, each scored 0–100. Each bar is that input's sub-score; the figure is the points it added to the 100-point composite (weight × sub-score).
- Cash flow +19.8/30.0
- ARV discount +10.0/15.0
- DSCR +6.3/10.0
- 1% rule +5.3/10.0
- Livability +4.0/5.0
- Condition / age +4.0/5.0
- Rent growth +2.2/5.0
- Schools +1.9/10.0
- Appreciation +0.0/10.0
$153,999
🖨 Deal sheet 📄 Offer letter ✓ Due diligence
Listing remarks
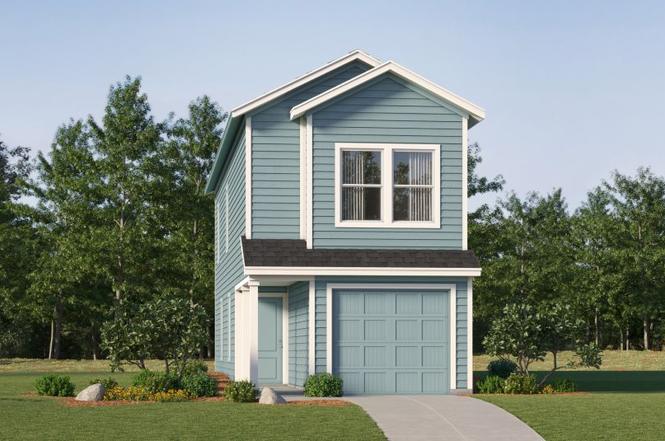
This two-story home features a classic layout ideal for young families and working professionals. The living area is located on the primary floor and consists of a family room and fully-equipped kitchen. There are three bedrooms on the second level, including the spacious owner's suite, which is situated at the back of the home for optimal privacy and comfort.
Key facts
- Garage
- Built 2026
- Listed 3 days
Property features AI
Finance
- Other:
- Financial info: Listed for $153,999
- HOA & community:
Exterior
- Parking: 1-car garage (1 parking space total)
- Security:
- Utilities:
- Home design: Baja floor plan; New construction (Spec)
- Construction:
- Exterior features: Living area approximately 1189
Interior
- Kitchen:
- Bedrooms: 3 bedrooms
- Flooring:
- Bathrooms: 2 full bathrooms and 1 half bathroom (2.5 total)
- Heating & cooling:
- Interior features: Open plan living area
- Laundry & utility:
Neighborhood map
What this means for you Summary
Snapshot
- This is a 3-bed/2.5-bath single-family listed at $154k. Condition is rated good.
Deal economics
- At list price, monthly cash flow is $184 ($2k/yr) — positive.
- The deal already cash-flows at list — no discount required.
- Meets the 1% rule at list price ($2k rent vs $154k).
- Cap rate 7.7% vs local median 3.8% in San Antonio — top-decile yield for the area; either an underpriced asset or a hidden risk that comps aren't pricing in. Stress-test before assuming the spread holds.
Location & tenants
- Location reads 80/100 on livability (#31 in TX, #1,616 nationally) — a professional / high-income tenant draw. Strengths: amenities A+, commute A+, cost of living A+; Watch: schools C-, crime F.
- East Central ISD (rural): math 16% / reading 25% proficiency, ranked #758 of 826 in TX (top 92%) — low school quality limits family demand, transient renter base, plan for 1-2y turnover; 61% free/reduced lunch — lower-income household profile, screen leases tightly.
- Market conditions: Rents soft (-1.1%/yr); 1152 active listings in the ZIP; 16 comparable units currently listed for rent nearby; rentals at typical pace (median 22d on market — plan ~3-4 weeks tenant-placement turnaround); solid renter incomes; 8,308 units permitted in Bexar County in 2024 (2,506 in 5+ unit buildings).
Forward outlook
- Local home prices are declining (-3.0%/yr); year-one equity from $1k of loan paydown is wiped out by about $5k of value loss. Plan a longer hold.
- Bexar County population projected at +50% by 2050 — long-run rental-demand tailwind backs the buy-and-hold thesis.
Negotiation context
- Only 3 days on market — expect competitive offers; lowballing is unlikely to land.
Questions for the listing agent
- Is there a deadline driving the sale (1031 exchange, divorce, estate, relocation)? That informs how much negotiation room exists.
- Crime grade is F in this area — have there been break-ins, vandalism, or insurance claims at this property in the last 3 years? What carrier currently insures it and at what premium?
- What's the average days-on-market for RENTAL listings here right now (not sales)? A rising rental-DOM trend means longer vacancies and softer asking-rent achievability than the comps imply.
- What's the recent tenant-quality profile in this submarket — average credit score on applications, eviction rate, late-payment / NSF rate, and stable-employment percentage? A property-management company in the area should have these aggregated.
- How much new for-sale + rental construction is in the pipeline within 1–3 miles? Heavy new supply typically softens prices + rents 12–24 months out; constrained supply supports both.
Investment metrics
- 1% rule
- 1.03% ✓
- Cap rate
- 7.73%
- Cash-on-cash
- 5.12%
- DSCR
- 1.23
- GRM
- 8.1
CMA / ARV
- ARV (on-the-fly)
- $162,893
- Comps found
- 12
Show comp detail 12 sales within ~0.75 mi
| Address | Dist | Beds/Ba | Sqft | Sold | Price | $/sf | Match |
|---|---|---|---|---|---|---|---|
| 4915 Daisy Blossom | 0.03mi | 3/2.5 | 1,189 (0%) | 3mo | $169,999 | $143 | 96 |
| 4906 Winecup Cv | 0.14mi | 3/2.5 | 1,189 (0%) | 2mo | $162,999 | $137 | 92 |
| 11942 Spiderwort Rdg | 0.16mi | 3/2.5 | 1,189 (0%) | 1mo | $163,999 | $138 | 92 |
| 11938 Spiderwort Rdg | 0.16mi | 3/2.5 | 1,189 (0%) | 2mo | $161,999 | $136 | 91 |
| 4957 Winecup Cv | 0.12mi | 3/2.5 | 1,360 (+14%) | 0mo | $160,999 | $118 | 70 |
| 4949 Winecup Cv | 0.12mi | 3/2.5 | 1,360 (+14%) | 1mo | $160,999 | $118 | 70 |
| 4965 Winecup Cv | 0.12mi | 3/2.5 | 1,360 (+14%) | 1mo | $163,999 | $121 | 70 |
| 11926 Spiderwort Rdg | 0.15mi | 3/2.5 | 1,360 (+14%) | 2mo | $175,999 | $129 | 68 |
| 11918 Spiderwort Rdg | 0.14mi | 3/2.5 | 1,360 (+14%) | 3mo | $187,999 | $138 | 67 |
| 4902 Winecup Cv | 0.17mi | 3/2.5 | 1,360 (+14%) | 1mo | $186,999 | $137 | 67 |
| 11910 Spiderwort Rdg | 0.13mi | 3/2.5 | 1,360 (+14%) | 3mo | $187,999 | $138 | 67 |
| 11934 Spiderwort Rdg | 0.15mi | 3/2.5 | 1,360 (+14%) | 3mo | $173,999 | $128 | 66 |
Match score weights: distance 35% · size 25% · config 20% · recency 20%. Top-matched comps best support the ARV.
Projected returns pro-forma
-3.0% appreciation · 0.0% rent growth · sell at horizon
- IRR
- -11.8%
- Equity multiple
- 0.59×
- Total profit
- $-17,846
- Equity at exit
- $22,962
- IRR
- -7.8%
- Equity multiple
- 0.58×
- Total profit
- $-18,253
- Equity at exit
- $13,315
Cash invested: $43,120 (down + closing). Projections, not guarantees.
Landlord ↔ Tenant lean methodology
- Overall (STATE)
- 87 Strongly Landlord-Friendly
- State Texas
- 87 Strongly Landlord-Friendly · R+5
- County
- — inherits STATE
- City
- — inherits STATE
ZIP-level market 78109
- Home prices YoY
- -17.8%
- Rents YoY
- -1.1%
- Active inventory
- 1152
- Price-to-rent
- 8.1×
Monthly cashflow live
- Estimated rent
- $1,580 high interval (Pro) →
- Mortgage (P&I)
- −$808
- Tax est. 1.5%
- −$192 /mo · $2,310/yr
- Insurance
- −$64
- HOA
- −$0
- Vacancy / Maint / Mgmt
- −$332
- Net cashflow
- $184
Break-even live
UW: 25.0% down · 7.5% · 30yr · 1.5% tax · 5.0% vac · 8.0% maint · 8.0% mgmt
Financing live
Cash to close
- Down payment
- $38,500
- Closing costs
- $4,620
- Reserves months
- —
- Total cash needed
- —
Loan-product check · same deal, 3 products live
Conventional
25% down · 7.5% · 30yr
- Down + closing
- —
- Monthly P&I
- —
- Monthly cashflow
- —
- DSCR
- —
- Eligible?
- —
Personal DTI + credit; lowest rate.
DSCR
20% down · 8.5% · 30yr
- Down + closing
- —
- Monthly P&I
- —
- Monthly cashflow
- —
- DSCR
- —
- Eligible?
- —
No personal income docs; deal must DSCR.
Hard money
10% down · 12.0% · 12mo
- Down + closing
- —
- Monthly P&I
- —
- Monthly cashflow
- —
- DSCR
- —
- Eligible?
- —
Short-term bridge; refi at stabilization.
Rent comps 16 comps
| Address | Beds | Baths | Sqft | Rent | $/sqft | DOM | Units | Dist |
|---|---|---|---|---|---|---|---|---|
| 5015 Daisy Blossom Converse, TX | 2.0 | 2.0 | 852 | $1,290 | $1.51 | 3d | 1 | 0.07mi |
| 12003 Floral Blossom Converse, TX | 3.0 | 2.5 | 1189 | $1,550 | $1.30 | 43d | 1 | 0.12mi |
| 5010 Primrose Rdg Converse, TX | 2.0 | 2.0 | 850 | $1,295 | $1.52 | 43d | 1 | 0.12mi |
| 4906 Winecup Cv Converse, TX | 3.0 | 2.5 | 1189 | $1,350 | $1.14 | 23d | 1 | 0.14mi |
| 11938 Spiderwort Rdg Converse, TX | 3.0 | 2.5 | 1189 | $1,600 | $1.35 | 4d | 1 | 0.16mi |
| 12135 Floral Blossom Converse, TX | 2.0 | 2.5 | 1015 | $1,300 | $1.28 | 4d | 1 | 0.18mi |
| 4522 Meerkat Converse, TX | 3.0 | 2.0 | 1489 | $1,750 | $1.18 | 10d | 1 | 0.70mi |
| 4918 Valenzuela Converse, TX | 3.0–4.0 | 2.0–2.5 | 1719 | $1,699 | $0.99 | 1d | 82 | 0.85mi |
| 10818 Fox Trot Converse, TX | 3.0 | 2.0 | 1465 | $1,850 | $1.26 | 4d | 1 | 1.29mi |
| 13015 Red Elks Lks Saint Hedwig, TX | 3.0 | 2.0 | 1445 | $1,650 | $1.14 | 2d | 1 | 1.43mi |
| 4211 Asher Aly Saint Hedwig, TX | 3.0 | 2.0 | 1248 | $1,438 | $1.15 | 3d | 1 | 1.45mi |
| 3937 Abbott Pass Unit 102 St Hedwig, TX | 3.0 | 2.5 | 1345 | $1,495 | $1.11 | 43d | 1 | 1.47mi |
| 3933 Abbott Pass Unit 101 St Hedwig, TX | 3.0 | 2.5 | 1345 | $1,450 | $1.08 | 23d | 1 | 1.48mi |
| 3936 Abbott Pass Unit 101 St Hedwig, TX | 3.0 | 2.5 | 1345 | $1,450 | $1.08 | 21d | 1 | 1.49mi |
| 11019 Chatham Ct Converse, TX | 3.0 | 2.5 | 1428 | $1,425 | $1.00 | 43d | 1 | 1.49mi |
| 3932 Abbott Pass Unit 102 St Hedwig, TX | 3.0 | 2.5 | 1345 | $1,495 | $1.11 | 23d | 1 | 1.49mi |
Listing history 4 events
-
2026-06-18days on market $153,999 Active 3 DOM
-
2026-06-17days on market $153,999 Active 2 DOM
-
2026-06-15remarks 362-char remark
-
2026-06-15$153,999 Active 1 DOM
ⓘ Source: listings_history table (triggers on properties + properties_extension) + one-shot
backfill from property_details.listing_events for pre-trigger history.
Nearby sold comps map
Loading sold comps map…
Walkable amenities ~0.75 mi
Loading nearby amenities…
Taxation est. · year 1
- Rental income
- $18,960
- − Mortgage interest
- −$8,626
- − Property taxes
- −$2,310
- − Insurance
- −$770
- − Repairs & maintenance
- −$1,517
- − Management
- −$1,517
- − Depreciation
- −$4,480
- Taxable loss
- −$260
- Est. tax savings @ 24.0%
- +$62
- After-tax cash flow
- $2,270/yr
For passive investors: Depreciation is non-cash, so a rental often shows a tax loss while cash-flowing — sheltering income. Rental losses are passive: they offset passive income freely, and up to $25,000/yr can offset ordinary (W-2) income if you actively participate and your MAGI is under $100k (phasing out to $0 by $150k); unused losses carry forward. On sale, claimed depreciation is recaptured at up to 25%, and gains may owe capital-gains tax (a 1031 exchange can defer both). Figures are a year-1 estimate at your 24.0% rate — not tax advice; consult a CPA.
Condition & rehab AI · 12 photos
This two-story home is in good condition with a modern and well-maintained interior and exterior. It is move-in ready and has the potential for further value increases with minor updates.
Value-add opportunities
- Both Paint the exterior siding — Fresh paint can enhance curb appeal and property value.
- Both Replace the flooring in the living area — New flooring can improve the overall look and feel of the home.
- Both Install smart home technology — Smart home features can increase both resale and rental value by making the home more modern and convenient.
Renovation cost estimate screening
Value-add ROI direction
- Both Paint the exterior siding — Fresh paint can enhance curb appeal and property value. ↑
- Both Replace the flooring in the living area — New flooring can improve the overall look and feel of the home. ↑
- Both Install smart home technology — Smart home features can increase both resale and rental value by making the home more modern and convenient. ↑
ⓘ Cost ranges are severity-bucket heuristics (US national rule-of-thumb). Get contractor quotes + a written scope before underwriting a rehab budget.
Schools (NCES district)
- District
- East Central ISD
- NCES district ID
- 4817850
- Math proficiency
- 16% ▼ -12.00%
- Reading proficiency
- 25% ▼ -6.00%
- Median HH income
- $53,941
- Composite
- 18.67/100
- National rank
- #8887
- State rank
- #758 of 826 in TX
Livability — San Antonio
- Score
- 80/100
- State rank
- #31
- US rank
- #1616
Category grades
Schools grade is shown separately in the Schools card above.
Census & demographics
- County
- Bexar County · 1,990,555 people
- City population
- 1,806,925
- Metro
- San Antonio-New Braunfels, TX
- Population (ZIP)
- 63,067
- Household income
- $91,320
- Rent vs Own
- Severe rent burden
- 1732.0
Population outlook (Bexar County) Hauer SSP2
- Today (2025)
- 2,336,851 people
- By 2030
- 2,560,728 · +9.6%
- By 2040
- 3,020,569 · +29.3%
- By 2050
- 3,493,522 · +49.5%
- By 2075
- 4,668,459 · +99.8%
- By 2100
- 5,533,242 · +136.8%
Race, ethnicity, and origin ACS 2023
- Neighborhood character
- Diverse neighborhood (Simpson 0.69)
- Race & ethnicity
- Hispanic / Latino 44% White 27% Two or more races 21% Black 21% Asian 3%
- Hispanic origin (detail)
- Mexican 29% Puerto Rican 4%
- Common ancestry
- Lithuanian 1% Romanian 1% Italian 1%
- Foreign-born
- 11% · Canada, Vietnam, South Korea
- Languages at home
- 71% English-only · Spanish 23% Tagalog/Filipino 1% Other Asian/Pacific 1%
Political lean MEDSL · Bexar
- 2024 margin
- Lean D (+9.8) · D 54.3% · R 44.6% · Other 1.1%
- 2008→2024 swing
- +4.2pp toward D · 2008: 5.6pp · 2024: 9.8pp
- All cycles
- 2024: D+9.8 2020: D+18.2 2016: D+13.5 2012: D+4.6 2008: D+5.6
Not yet ingested
- Civics
- —
Market trends
- HPI YoY
- ▼ -51.02%
- Current HPI
- 236.4923
- Rent YoY
- ▼ -1.08%
- Metro
- San Antonio-New Braunfels, TX
- State GDP YoY
- ▲ 3.95%
- F500 in state
- 110
Industry mix (Fortune 500 HQ in TX)
| Industry | F500 HQs | Revenue |
|---|---|---|
| Energy | 16 | $1,198B |
|
||
| Technology | 5 | $198B |
|
||
| Engineering / Construction | 4 | $72B |
|
||
| Energy Services | 3 | $60B |
|
||
| Utilities | 3 | $41B |
|
||
| Healthcare | 2 | $330B |
|
||
Cash-flow waterfall
monthlySold comps — $/sqft
last 12 mo · ≤1 miLoading sold comps…