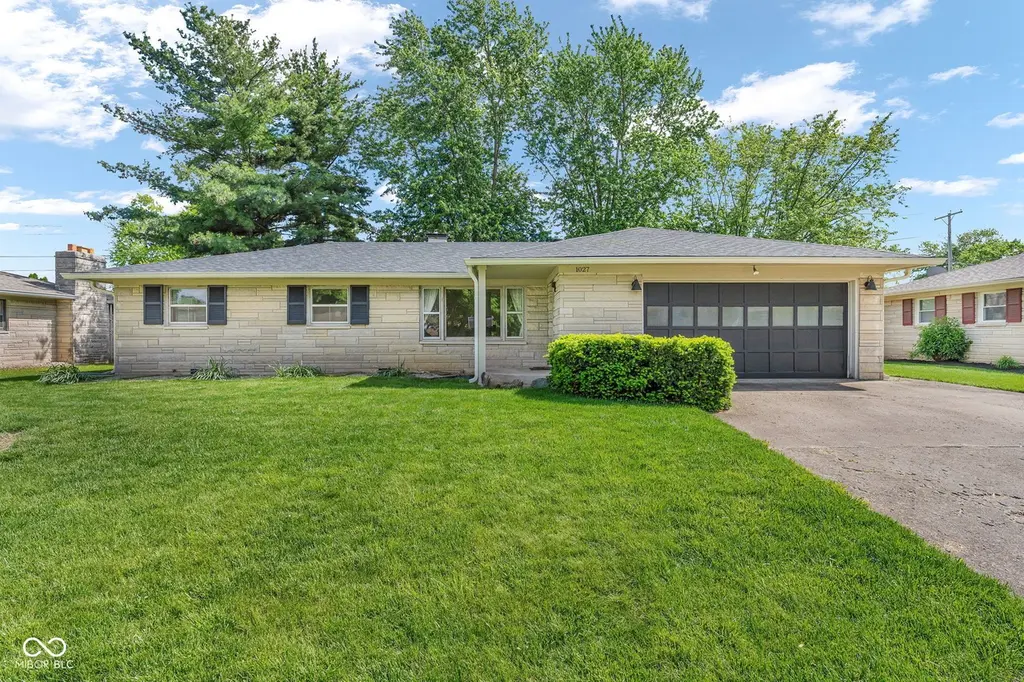
1027 E Logan St · Brownsburg, IN
Flood risk 1/10 · Minimal
- FEMA flood zone
- X (unshaded)
- Chance of flooding over 30 yrs
- 0.0%
- Est. flood insurance / yr
- $507 – $1,088
Fire risk 1/10 · Minimal
- Est. fire insurance / yr
- $717 – $1,331
Heat risk 3/10 · Minor
- Hot days now (above 101°F)
- 7 days/yr
- Hot days in 30 yrs
- 19 days/yr
Wind risk 2/10 · Minimal
- Chance of severe wind over 30 yrs
- 0.0%
Air-quality risk 2/10 · Minimal
- Unhealthy air days now
- 1 days/yr
- Unhealthy air days in 30 yrs
- 2 days/yr
Risk factors via First Street. Map © Google.
Why this score? — see what drove the C grade
The composite is a weighted blend of 9 inputs, each scored 0–100. Each bar is that input's sub-score; the figure is the points it added to the 100-point composite (weight × sub-score).
- Cash flow +17.3/30.0
- ARV discount +15.0/15.0
- Schools +6.3/10.0
- DSCR +5.4/10.0
- 1% rule +4.1/10.0
- Rent growth +4.1/5.0
- Livability +3.8/5.0
- Condition / age +2.5/5.0
- Appreciation +0.0/10.0
$240,000
🖨 Deal sheet 📄 Offer letter ✓ Due diligence
Listing remarks MLS
REDUCED AGAIN! SELLER WANTS IT SOLD! GREAT VALUE IN BBURG! 3 Bdrm Limestone Ranch close to all Bburg schools! Well maintained home. Kitchen w/ Brkfst Bar, sep Oven & Counter Top Range- All appliances stay (including Washer/Dryer!) Updated Flrs, Bathrooms & new Roof! Family Rm w/ Brick Floor-to-Ceiling Gas Fireplace. Glass Enclosed Porch. Open Patio for Backyard entertaining. 8x12 Storage Barn. Extra 6" of Attic Insulation. Floored Attic Storage Area. Hdwd Flrs under Carpet!
Key facts
- Brick fireplace
- Laundry room
- Hardwood floors
Tags
Property features AI
Finance
- Other: Lot size about 0.27 acres (approximately 1/4–1/2 acre)
Exterior
- Parking: Attached finished garage with 2 garage spaces
- Utilities: Public water; Municipal sewer connected; Natural gas connected; 100 amp electric service; Solid waste service available
- Home design: Single-family residence; One level (single-story); Property faces north
- Construction: Stone exterior; Crawl space foundation; Built on one level
- Exterior features: Screened patio/porch; Exterior storage; Sidewalks; Mature trees on the lot
Interior
- Kitchen: Electric cooktop; Oven; Microwave; Range hood; Dishwasher; Refrigerator; Disposal; Breakfast bar
- Bedrooms: 3 bedrooms, all on the main level (examples: Bedroom 2 - 13x10; Bedroom 3 - 10x9)
- Flooring: Hardwood floors
- Bathrooms: 1 full bathroom and 1 half bathroom (both on the main level)
- Heating & cooling: Forced air heating (natural gas); Central air conditioning
- Interior features: Attic pull-down stairs; Breakfast bar; Hardwood floors; One fireplace located in the family room; Screened patio/porch; Storage space
- Laundry & utility: Main-level laundry room (12x5); Washer and dryer included; Water softener (owned); Gas water heater
Neighborhood map
What this means for you Summary
Snapshot
- This is a 3-bed/1.5-bath single-family listed at $240k.
Deal economics
- At list price, monthly cash flow is $176 ($2k/yr) — positive.
- The deal already cash-flows at list — no discount required.
- To meet the 1% rule (rent ≥ 1% of price), the offer needs to be $218k (9.3% below list).
- Recommended offer: $218k (9.3% below list) — sets the bar for 1% rule.
- Cap rate 7.2% vs local median 3.8% in Brownsburg — top-decile yield for the area; either an underpriced asset or a hidden risk that comps aren't pricing in. Stress-test before assuming the spread holds.
Location & tenants
- Location reads 75/100 on livability (#61 in IN, #4,105 nationally) — a middle-class / working-renter tenant base. Strengths: schools A+, crime A+, employment A+; Watch: amenities F, commute F, health & safety F.
- Brownsburg Community School Corporation (suburban): math 72% / reading 72% proficiency, ranked #2 of 301 in IN (top 1%) — strong family-tenant draw, lease renewals of 3-5y typical; only 17% free/reduced lunch — higher-income household profile.
- Market conditions: Rents rising fast (+6.3%/yr); 328 active listings in the ZIP; 10 comparable units currently listed for rent nearby; rentals at typical pace (median 15d on market — plan ~3-4 weeks tenant-placement turnaround); high-income renter base; 1,294 units permitted in Hendricks County in 2024 (18 in 5+ unit buildings).
Forward outlook
- Local home prices are declining (-3.0%/yr); year-one equity from $2k of loan paydown is wiped out by about $7k of value loss. Plan a longer hold.
- Hendricks County population projected at +35% by 2050 — long-run rental-demand tailwind backs the buy-and-hold thesis.
Negotiation context
- Only 4 days on market — expect competitive offers; lowballing is unlikely to land.
- 3 sale attempts since 25y ago with the ask held roughly flat each time — persistent listings suggest the price (not the market) is what's stuck; bring a comps-based counter.
- Current owner paid $112k; list at $240k implies a 113% gain — meaningful room to come down on a strong offer.
Risks & watch-outs
- Watch-outs: built in 1953 — expect roof / HVAC / electrical / plumbing capex.
Questions for the listing agent
- Built in 1953 — when were the roof, HVAC, electrical panel, plumbing, and water heater last replaced?
- Is there a deadline driving the sale (1031 exchange, divorce, estate, relocation)? That informs how much negotiation room exists.
- Schools are A-rated — typically a magnet for longer-tenancy family renters. What's the average tenant stay here, and is there a school-zone premium baked into asking?
- What's the average days-on-market for RENTAL listings here right now (not sales)? A rising rental-DOM trend means longer vacancies and softer asking-rent achievability than the comps imply.
- What's the recent tenant-quality profile in this submarket — average credit score on applications, eviction rate, late-payment / NSF rate, and stable-employment percentage? A property-management company in the area should have these aggregated.
- How much new for-sale + rental construction is in the pipeline within 1–3 miles? Heavy new supply typically softens prices + rents 12–24 months out; constrained supply supports both.
Investment metrics
- 1% rule
- 0.91% ✗
- Cap rate
- 7.17%
- Cash-on-cash
- 3.14%
- DSCR
- 1.14
- GRM
- 9.2
CMA / ARV
- ARV (on-the-fly)
- $296,277
- Comps found
- 12
Show comp detail 12 sales within ~0.75 mi
| Address | Dist | Beds/Ba | Sqft | Sold | Price | $/sf | Match |
|---|---|---|---|---|---|---|---|
| 1027 E Logan St | 0.00mi | 3/1.5 | 1,619 (0%) | 0mo | $245,000 | $151 | 100 |
| 747 Homestead Way | 0.23mi | 4/2.5 (+1) | 1,648 (+2%) | 6mo | $285,000 | $173 | 72 |
| 1042 E Logan St | 0.08mi | 3/1.5 | 1,381 (-15%) | 1mo | $270,000 | $196 | 71 |
| 35 Robinwood Dr | 0.42mi | 3/2.0 | 1,516 (-6%) | 4mo | $315,000 | $208 | 65 |
| 29 Robinwood Dr | 0.47mi | 3/2.0 | 1,706 (+5%) | 6mo | $300,000 | $176 | 62 |
| 291 Lakemoore St | 0.68mi | 3/2.0 | 1,570 (-3%) | 2mo | $299,000 | $190 | 60 |
| 20 Roselawn Ave | 0.39mi | 3/2.0 | 1,380 (-15%) | 1mo | $316,000 | $229 | 54 |
| 1105 S Odell St | 0.54mi | 3/2.0 | 1,812 (+12%) | 0mo | $320,003 | $177 | 53 |
| 12 Longview Bnd | 0.65mi | 3/2.0 | 1,786 (+10%) | 1mo | $317,500 | $178 | 49 |
| 601 S Grant St | 0.58mi | 3/2.0 | 1,456 (-10%) | 6mo | $279,900 | $192 | 49 |
| 1319 Dogwood Ct | 0.66mi | 4/2.0 (+1) | 1,710 (+6%) | 6mo | $299,500 | $175 | 48 |
| 218 Lakemoore St | 0.68mi | 3/2.0 | 1,800 (+11%) | 1mo | $330,000 | $183 | 47 |
Match score weights: distance 35% · size 25% · config 20% · recency 20%. Top-matched comps best support the ARV.
Projected returns pro-forma
-3.0% appreciation · 6.31% rent growth · sell at horizon
- IRR
- -7.9%
- Equity multiple
- 0.70×
- Total profit
- $-20,245
- Equity at exit
- $35,785
- IRR
- 5.2%
- Equity multiple
- 1.44×
- Total profit
- $29,529
- Equity at exit
- $20,751
Cash invested: $67,200 (down + closing). Projections, not guarantees.
Landlord ↔ Tenant lean methodology
- Overall (STATE)
- 90 Strongly Landlord-Friendly
- State Indiana
- 90 Strongly Landlord-Friendly · R+11
- County
- — inherits STATE
- City
- — inherits STATE
ZIP-level market 46112
- Rents YoY
- 6.3%
- Active inventory
- 328
- Price-to-rent
- 9.2×
Monthly cashflow live
- Estimated rent
- $2,177 high interval (Pro) →
- Mortgage (P&I)
- −$1,259
- Tax from tax record
- −$185 /mo · $2,222/yr
- Insurance
- −$100
- HOA
- −$0
- Vacancy / Maint / Mgmt
- −$457
- Net cashflow
- $176
Break-even live
UW: 25.0% down · 7.5% · 30yr · 1.5% tax · 5.0% vac · 8.0% maint · 8.0% mgmt
Financing live
Cash to close
- Down payment
- $60,000
- Closing costs
- $7,200
- Reserves months
- —
- Total cash needed
- —
Loan-product check · same deal, 3 products live
Conventional
25% down · 7.5% · 30yr
- Down + closing
- —
- Monthly P&I
- —
- Monthly cashflow
- —
- DSCR
- —
- Eligible?
- —
Personal DTI + credit; lowest rate.
DSCR
20% down · 8.5% · 30yr
- Down + closing
- —
- Monthly P&I
- —
- Monthly cashflow
- —
- DSCR
- —
- Eligible?
- —
No personal income docs; deal must DSCR.
Hard money
10% down · 12.0% · 12mo
- Down + closing
- —
- Monthly P&I
- —
- Monthly cashflow
- —
- DSCR
- —
- Eligible?
- —
Short-term bridge; refi at stabilization.
Rent comps 10 comps
| Address | Beds | Baths | Sqft | Rent | $/sqft | DOM | Units | Dist |
|---|---|---|---|---|---|---|---|---|
| 28 Parkwood Dr Brownsburg, IN | 3.0 | 2.0 | 1422 | $1,760 | $1.24 | 18d | 1 | 0.42mi |
| 460 Brookview Dr Brownsburg, IN | 4.0 | 2.5 | 2240 | $2,600 | $1.16 | 44d | 1 | 0.80mi |
| 275 Lazy Hollow Dr Brownsburg, IN | 4.0 | 2.5 | 2190 | $2,571 | $1.17 | 44d | 1 | 0.81mi |
| 443 N Odell St Brownsburg, IN | 4.0 | 2.5 | 1984 | $2,391 | $1.21 | 22d | 1 | 0.93mi |
| 457 Sable Chase Brownsburg, IN | 3.0 | 2.0 | 1408 | $2,185 | $1.55 | 4d | 1 | 0.93mi |
| 102 Murphy Ln Brownsburg, IN | 3.0 | 1.5 | 1248 | $1,775 | $1.42 | 7d | 1 | 0.95mi |
| 5793 N Green St Brownsburg, IN | 1.0–2.0 | 1.0–2.0 | 835 | $1,678 | $2.01 | 4d | 7 | 1.33mi |
| 7774 Bedford Ct Brownsburg, IN | 2.0 | 1.5 | 1071 | $1,865 | $1.74 | 2d | 4 | 1.33mi |
| 7249 Arbuckle Cmns Brownsburg, IN | 1.0–2.0 | 1.0–2.5 | 1548 | $2,545 | $1.64 | 2d | 17 | 1.39mi |
| 640 N Grant St Brownsburg, IN | 2.0 | 2.0 | 1116 | $1,550 | $1.39 | 15d | 1 | 1.46mi |
Listing history 7 events
-
2026-05-13status Pending
-
2026-05-08$240,000 Active
-
2012-11-30historical 492-char remark
Show marketing remark (492 chars)
REDUCED AGAIN! SELLER WANTS IT SOLD! GREAT VALUE IN BBURG! 3 Bdrm Limestone Ranch close to all Bburg schools! Well maintained home. Kitchen w/ Brkfst Bar, sep Oven & Counter Top Range- All appliances stay (including Washer/Dryer!) Updated Flrs, Bathrooms & new Roof! Family Rm w/ Brick Floor-to-Ceiling Gas Fireplace. Glass Enclosed Porch. Open Patio for Backyard entertaining. 8x12 Storage Barn. Extra 6" of Attic Insulation. Floored Attic Storage Area. Hdwd Flrs under Carpet!
-
2012-11-29soldstatus $112,500 492-char remark
Show marketing remark (492 chars)
REDUCED AGAIN! SELLER WANTS IT SOLD! GREAT VALUE IN BBURG! 3 Bdrm Limestone Ranch close to all Bburg schools! Well maintained home. Kitchen w/ Brkfst Bar, sep Oven & Counter Top Range- All appliances stay (including Washer/Dryer!) Updated Flrs, Bathrooms & new Roof! Family Rm w/ Brick Floor-to-Ceiling Gas Fireplace. Glass Enclosed Porch. Open Patio for Backyard entertaining. 8x12 Storage Barn. Extra 6" of Attic Insulation. Floored Attic Storage Area. Hdwd Flrs under Carpet!
-
2012-04-25$116,500 492-char remark
Show marketing remark (492 chars)
REDUCED AGAIN! SELLER WANTS IT SOLD! GREAT VALUE IN BBURG! 3 Bdrm Limestone Ranch close to all Bburg schools! Well maintained home. Kitchen w/ Brkfst Bar, sep Oven & Counter Top Range- All appliances stay (including Washer/Dryer!) Updated Flrs, Bathrooms & new Roof! Family Rm w/ Brick Floor-to-Ceiling Gas Fireplace. Glass Enclosed Porch. Open Patio for Backyard entertaining. 8x12 Storage Barn. Extra 6" of Attic Insulation. Floored Attic Storage Area. Hdwd Flrs under Carpet!
-
2001-06-14soldstatus $122,000 466-char remark
Show marketing remark (466 chars)
PRICE REDUCED!! SPACIOUS & BEAUTIFULLY MAINTAINED 3 BR IS NEAR PERFECT!!! UPDATED KITCHEN W/BREAKFAST BAR, SEPARATE OVEN & COUNTER TOP RANGE * ALL APPLIANCES INCLUDING WASHER & DRYER STAY * FAMILY ROOM (13' X 18') W/B RICK FLOOR-TO-CEILING FIREPLACE (GAS) * HARDWOOD FLOORS UNDER CARPET * GLASS ENCLOSED PORCH (9' X 12') * OPEN PATIO FOR BACKYARD ENTERTAINING * STORAGE BARN(8' X 12') * EXTRA 6" OF ATTIC INSULATION * FLOORED ATTIC STOR AGE AREA
-
2001-03-12$124,500 466-char remark
Show marketing remark (466 chars)
PRICE REDUCED!! SPACIOUS & BEAUTIFULLY MAINTAINED 3 BR IS NEAR PERFECT!!! UPDATED KITCHEN W/BREAKFAST BAR, SEPARATE OVEN & COUNTER TOP RANGE * ALL APPLIANCES INCLUDING WASHER & DRYER STAY * FAMILY ROOM (13' X 18') W/B RICK FLOOR-TO-CEILING FIREPLACE (GAS) * HARDWOOD FLOORS UNDER CARPET * GLASS ENCLOSED PORCH (9' X 12') * OPEN PATIO FOR BACKYARD ENTERTAINING * STORAGE BARN(8' X 12') * EXTRA 6" OF ATTIC INSULATION * FLOORED ATTIC STOR AGE AREA
ⓘ Source: listings_history table (triggers on properties + properties_extension) + one-shot
backfill from property_details.listing_events for pre-trigger history.
Tax reassessment forecast IN · Partial reset (capped growth)
- Current annual tax
- $2,222 · $185/mo
- Projected year-2 tax
- $2,222 · $185/mo
- Expected delta
- $0/yr ($0/mo · 0.0%)
ⓘ Screening estimate from a state-policy table — verify with the county assessor before closing.
Climate risk First Street
- Flood 1/10 Low FEMA zone X (unshaded) · 0% chance over 30 yrs
- Wildfire 1/10 Low
- Heat 3/10 Moderate 7 d/yr ≥101°F today · 19 d/yr by 30 yrs out
- Wind 2/10 Low 0% chance of damaging wind over 30 yrs
- Air quality 2/10 Low 1 unhealthy d/yr today · 2 by 30 yrs out
Nearby sold comps map
Loading sold comps map…
Walkable amenities ~0.75 mi
Loading nearby amenities…
Taxation est. · year 1
- Rental income
- $26,119
- − Mortgage interest
- −$13,444
- − Property taxes
- −$2,222
- − Insurance
- −$1,200
- − Repairs & maintenance
- −$2,090
- − Management
- −$2,090
- − Depreciation
- −$6,982
- Taxable loss
- −$1,908
- Est. tax savings @ 24.0%
- +$458
- After-tax cash flow
- $2,567/yr
For passive investors: Depreciation is non-cash, so a rental often shows a tax loss while cash-flowing — sheltering income. Rental losses are passive: they offset passive income freely, and up to $25,000/yr can offset ordinary (W-2) income if you actively participate and your MAGI is under $100k (phasing out to $0 by $150k); unused losses carry forward. On sale, claimed depreciation is recaptured at up to 25%, and gains may owe capital-gains tax (a 1031 exchange can defer both). Figures are a year-1 estimate at your 24.0% rate — not tax advice; consult a CPA.
Schools (NCES district)
- District
- Brownsburg Community School Corporation
- NCES district ID
- 1801020
- Math proficiency
- 72% ▼ -5.00%
- Reading proficiency
- 72% ▼ -4.00%
- Median HH income
- $75,304
- Composite
- 63.45/100
- National rank
- #616
- State rank
- #2 of 301 in IN
Livability — Brownsburg
- Score
- 75/100
- State rank
- #61
- US rank
- #4105
Category grades
Schools grade is shown separately in the Schools card above.
Census & demographics
- Census place
- Brownsburg, IN
- County
- Hendricks County · 143,373 people
- City population
- 44,220
- Metro
- Indianapolis-Carmel-Anderson, IN
- Population (ZIP)
- 44,220
- Household income
- $112,565
- Rent vs Own
- Severe rent burden
- 614.0
Population outlook (Hendricks County) Hauer SSP2
- Today (2025)
- 187,418 people
- By 2030
- 201,494 · +7.5%
- By 2040
- 228,487 · +21.9%
- By 2050
- 253,068 · +35.0%
- By 2075
- 308,920 · +64.8%
- By 2100
- 336,510 · +79.6%
Race, ethnicity, and origin ACS 2023
- Neighborhood character
- Predominantly White (83%)
- Race & ethnicity
- White 83% Black 10% Two or more races 4% Hispanic / Latino 4%
- Common ancestry
- Slovak 3% Iranian 2% Romanian 2%
- Foreign-born
- 6% · Canada, China
- Languages at home
- 93% English-only · Spanish 2% French/Haitian/Cajun 1%
Political lean MEDSL · Hendricks
- 2024 margin
- Strong R (+21.5) · D 38.4% · R 59.9% · Other 1.7%
- 2008→2024 swing
- +1.9pp toward D · 2008: -23.4pp · 2024: -21.5pp
- All cycles
- 2024: R+21.5 2020: R+23.9 2016: R+34.2 2012: R+34.9 2008: R+23.4
Not yet ingested
- Civics
- —
Market trends
- HPI YoY
- ▼ -135.99%
- Current HPI
- 217.3787
- Rent YoY
- ▲ 6.31%
- Metro
- Indianapolis-Carmel-Anderson, IN
- State GDP YoY
- ▲ 2.90%
- F500 in state
- 18
Industry mix (Fortune 500 HQ in IN)
| Industry | F500 HQs | Revenue |
|---|---|---|
| Industrial Machinery | 2 | $37B |
|
||
| Healthcare | 1 | $177B |
|
||
| Pharmaceuticals | 1 | $45B |
|
||
| Metals / Steel | 1 | $18B |
|
||
| Agriculture | 1 | $17B |
|
||
| Packaging | 1 | $12B |
|
||
Price history
+92.8% since first listed7 events — show timeline
- 2026-05-13 Pending — MIBOR as Distributed by MLS Grid
- 2026-05-08 Listed $240,000 MIBOR as Distributed by MLS Grid
- 2012-11-30 Listing Removed — MIBOR as Distributed by MLS Grid
- 2012-11-29 Sold (MLS) $112,500 MIBOR as Distributed by MLS Grid
- 2012-04-25 Listed $116,500 MIBOR as Distributed by MLS Grid
- 2001-06-14 Sold (MLS) $122,000 MIBOR as Distributed by MLS Grid
- 2001-03-12 Listed $124,500 MIBOR as Distributed by MLS Grid
Property tax history
+4.8%/yrLatest (2025): $2,222 · +9.2% YoY. Source: county tax records.
Cash-flow waterfall
monthlySold comps — $/sqft
last 12 mo · ≤1 miLoading sold comps…