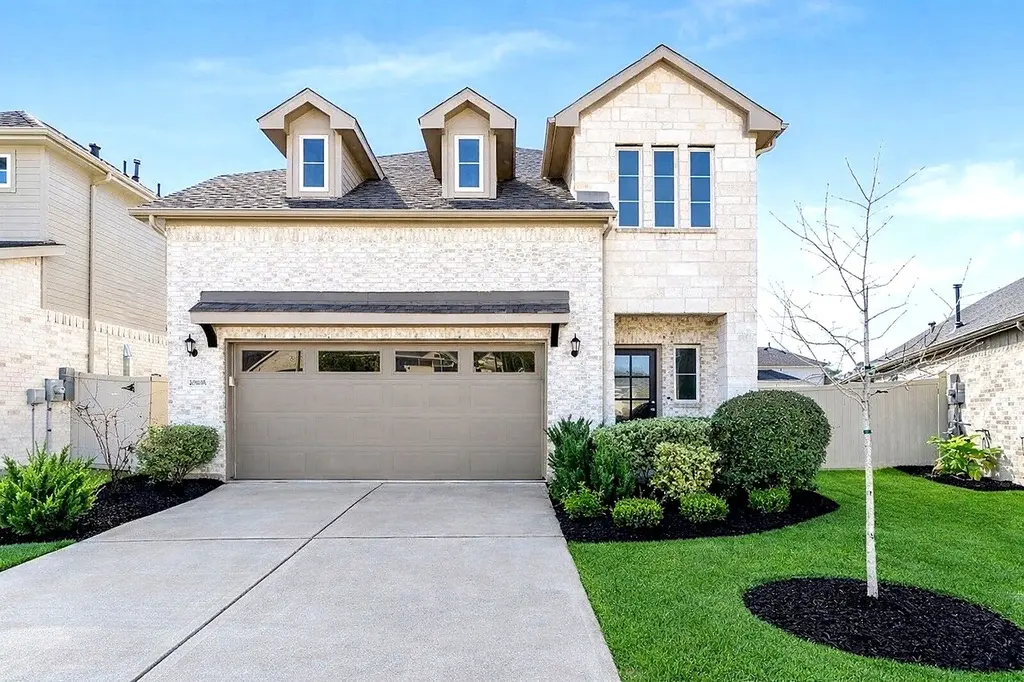
40606 Guillemont Ln · Pinehurst, TX
Flood risk 1/10 · Minimal
- FEMA flood zone
- X (unshaded)
- Chance of flooding over 30 yrs
- 0.0%
- Est. flood insurance / yr
- $507 – $1,088
Fire risk 4/10 · Minor
- Est. fire insurance / yr
- $1,222 – $2,270
Heat risk 8/10 · Major
- Hot days now (above 111°F)
- 7 days/yr
- Hot days in 30 yrs
- 22 days/yr
Wind risk 8/10 · Major
- Chance of severe wind over 30 yrs
- 99.0%
Air-quality risk 2/10 · Minimal
- Unhealthy air days now
- 2 days/yr
- Unhealthy air days in 30 yrs
- 2 days/yr
Risk factors via First Street. Map © Google.
Why this score? — see what drove the D- grade
The composite is a weighted blend of 9 inputs, each scored 0–100. Each bar is that input's sub-score; the figure is the points it added to the 100-point composite (weight × sub-score).
- Appreciation +10.0/10.0
- ARV discount +8.3/15.0
- Cash flow +5.8/30.0
- Schools +3.9/10.0
- Livability +2.8/5.0
- Rent growth +2.6/5.0
- Condition / age +2.5/5.0
- 1% rule +2.3/10.0
- DSCR +0.2/10.0
$339,949
🖨 Deal sheet 📄 Offer letter ✓ Due diligence
Listing remarks MLS
Welcome to 40606 Guillemont Ln in Magnolia, where space, style & value come together. This contemporary 4-bedroom, 2.5-bath home offers 2,606 sq ft & stands out as one of the last fully customized homes in the section at this price point. Inside you’ll find an open-concept layout with wood-look tile flooring, abundant natural light, a spacious living area & a beautifully designed kitchen with a large island, white cabinetry, stainless steel appliances & generous dining space. The private primary suite features a soaking tub, separate shower & a custom accent wall. Upstairs, enjoy the flexibility of a game room PLUS a dedicated media room with surround sound & step-up flooring for the ultimate movie-night experience. Furniture in the home can stay if desired. Outside, the extended back patio creates even more room to relax or entertain. A rare opportunity to get more space & features for your money. Low Tax Rate & neighborhood pool coming this Summer!
Key facts
- Soaking tub
- Large island
- Open-concept layout
Tags
Neighborhood map
What this means for you Summary
Snapshot
- This is a 4-bed/2.5-bath single-family listed at $340k.
Deal economics
- At list price, monthly cash flow is $-682 ($-8k/yr) — negative.
- To cash-flow at today's rent, offer at most $219k (35.4% below list).
- To meet the 1% rule (rent ≥ 1% of price), the offer needs to be $248k (27.1% below list).
- Recommended offer: $219k (35.4% below list) — sets the bar for cash-flow.
- Cap rate 3.9% vs local median 2.0% in Pinehurst — top-decile yield for the area; either an underpriced asset or a hidden risk that comps aren't pricing in. Stress-test before assuming the spread holds.
Location & tenants
- Location reads 55/100 on livability (#1,350 in TX) — a working-class tenant base; expect higher turnover. Strengths: cost of living A+, housing B+; Watch: employment C-, schools F, crime D-.
- Magnolia ISD (rural): math 42% / reading 45% proficiency, ranked #247 of 826 in TX (top 30%) — families likely to look elsewhere, expect single-tenant / working-renter base with shorter leases.
- Market conditions: Rents flat; 1604 active listings in the ZIP; 4 comparable units currently listed for rent nearby; rentals lingering (median 44d on market — plan ~5-8 weeks vacancy on turnover, expect pricing pressure); 75% of comp listings sitting > 30 days — soft ceiling on asking rent; high-income renter base; 13,259 units permitted in Montgomery County in 2024 (1,402 in 5+ unit buildings).
Forward outlook
- In year one you build about $36k of equity ($2k loan paydown + $34k appreciation (10.0% local appreciation)).
- Montgomery County population projected at +65% by 2050 — long-run rental-demand tailwind backs the buy-and-hold thesis.
- By year 2, paydown + projected appreciation supports a ~$58k cash-out refi (75% LTV) — recoverable capital for the next deal without selling this one.
Negotiation context
- It's been on market 62 days — a 6% lower offer ($320k) is reasonable based on typical stale-listing flexibility.
- 3 sale attempts with the ask held roughly flat each time — persistent listings suggest the price (not the market) is what's stuck; bring a comps-based counter.
Risks & watch-outs
- Climate carrying-cost: severe wind risk, 99% chance of damaging wind over 30y; extreme-heat days projected 7→22/yr by 2055 (HVAC capex compounding) — expect insurance premiums to compound above CPI over the hold.
Questions for the listing agent
- What do current leases actually rent for vs. the listed asking? Can we see a recent rent roll and the last 12 months of T-12 income?
- It's been on market 62 days. Have you received any prior offers? Is the seller open to a 35% concession, seller financing, or rate buy-down credit?
- What does the HOA fee cover, when was the last increase, and are there any pending special assessments or reserve-fund shortfalls?
- Why hasn't it sold? Are there any deal-killer items the seller is aware of (foundation, flood, title, zoning, code violations)?
- Is there a deadline driving the sale (1031 exchange, divorce, estate, relocation)? That informs how much negotiation room exists.
- Schools are F-rated, which usually means shorter tenancies and higher turnover. Who's the typical renter profile here, and what's been the actual vacancy rate?
- Crime grade is D in this area — have there been break-ins, vandalism, or insurance claims at this property in the last 3 years? What carrier currently insures it and at what premium?
- The area grade is low — what's the realistic commute time and amenity access for the typical tenant pool here? Any planned neighborhood developments (good or bad) we should know about?
- What's the average days-on-market for RENTAL listings here right now (not sales)? A rising rental-DOM trend means longer vacancies and softer asking-rent achievability than the comps imply.
- What's the recent tenant-quality profile in this submarket — average credit score on applications, eviction rate, late-payment / NSF rate, and stable-employment percentage? A property-management company in the area should have these aggregated.
- How much new for-sale + rental construction is in the pipeline within 1–3 miles? Heavy new supply typically softens prices + rents 12–24 months out; constrained supply supports both.
Investment metrics
- 1% rule
- 0.73% ✗
- Cap rate
- 3.89%
- Cash-on-cash
- -8.60%
- DSCR
- 0.62
- GRM
- 11.4
CMA / ARV
- ARV (median comp)
- $346,460
- List price
- $339,949
- Delta
- -1.88%
- Verdict
- FAIR
- Comps
- 20 within 1.0 mi
Show comp detail 12 sales within ~0.75 mi
| Address | Dist | Beds/Ba | Sqft | Sold | Price | $/sf | Match |
|---|---|---|---|---|---|---|---|
| 40439 Gerygone Ln | 0.15mi | 4/2.5 | 2,502 (-4%) | 9mo | $339,900 | $136 | 79 |
| 40722 Barley Straw Dr | 0.57mi | 4/3.0 | 2,681 (+3%) | 1mo | $349,990 | $131 | 66 |
| 40743 Barley Straw Dr | 0.57mi | 4/3.0 | 2,681 (+3%) | 2mo | $348,990 | $130 | 65 |
| 15235 Tree Swallow Ct | 0.55mi | 3/3.5 (-1) | 2,688 (+3%) | 5mo | $519,900 | $193 | 56 |
| 14894 Whistling Duck Ln | 0.55mi | 4/3.5 | 2,488 (-4%) | 8mo | $499,900 | $201 | 56 |
| 14818 Whistling Duck Ln | 0.64mi | 4/3.5 | 2,488 (-4%) | 6mo | $499,900 | $201 | 54 |
| 14870 Whistling Duck Ln | 0.57mi | 4/3.5 | 2,442 (-6%) | 9mo | $453,900 | $186 | 51 |
| 15531 Vauxs Swift Ln | 0.72mi | 4/3.5 | 2,840 (+9%) | 1mo | $495,000 | $174 | 47 |
| 14706 Band Tailed Pigeon Ct | 0.55mi | 4/3.0 | 2,911 (+12%) | 9mo | $529,900 | $182 | 46 |
| 15110 Rose Willow Ln | 0.57mi | 5/2.5 (+1) | 2,252 (-14%) | 2mo | $299,990 | $133 | 44 |
| 14855 Whistling Duck Ln | 0.58mi | 4/3.0 | 2,300 (-12%) | 10mo | $399,900 | $174 | 44 |
| 15670 Audubon Park Dr | 0.70mi | 4/3.5 | 2,994 (+15%) | 3mo | $689,900 | $230 | 36 |
Match score weights: distance 35% · size 25% · config 20% · recency 20%. Top-matched comps best support the ARV.
Projected returns pro-forma
10.0% appreciation · 0.32% rent growth · sell at horizon
- IRR
- 17.5%
- Equity multiple
- 2.42×
- Total profit
- $135,414
- Equity at exit
- $306,253
- IRR
- 16.0%
- Equity multiple
- 5.43×
- Total profit
- $421,538
- Equity at exit
- $660,446
Cash invested: $95,186 (down + closing). Projections, not guarantees.
Landlord ↔ Tenant lean methodology
- Overall (STATE)
- 87 Strongly Landlord-Friendly
- State Texas
- 87 Strongly Landlord-Friendly · R+5
- County
- — inherits STATE
- City
- — inherits STATE
ZIP-level market 77354
- Home prices YoY
- 2.4%
- Rents YoY
- 0.3%
- Active inventory
- 1604
- Price-to-rent
- 11.4×
Monthly cashflow live
- Estimated rent
- $2,480 medium interval (Pro) →
- Mortgage (P&I)
- −$1,783
- Tax from tax record
- −$563 /mo · $6,752/yr
- Insurance
- −$142
- HOA
- −$154
- Vacancy / Maint / Mgmt
- −$521
- Net cashflow
- $-682
Break-even live
UW: 25.0% down · 7.5% · 30yr · 1.5% tax · 5.0% vac · 8.0% maint · 8.0% mgmt
Financing live
Cash to close
- Down payment
- $84,987
- Closing costs
- $10,198
- Reserves months
- —
- Total cash needed
- —
Loan-product check · same deal, 3 products live
Conventional
25% down · 7.5% · 30yr
- Down + closing
- —
- Monthly P&I
- —
- Monthly cashflow
- —
- DSCR
- —
- Eligible?
- —
Personal DTI + credit; lowest rate.
DSCR
20% down · 8.5% · 30yr
- Down + closing
- —
- Monthly P&I
- —
- Monthly cashflow
- —
- DSCR
- —
- Eligible?
- —
No personal income docs; deal must DSCR.
Hard money
10% down · 12.0% · 12mo
- Down + closing
- —
- Monthly P&I
- —
- Monthly cashflow
- —
- DSCR
- —
- Eligible?
- —
Short-term bridge; refi at stabilization.
Rent comps 4 comps
| Address | Beds | Baths | Sqft | Rent | $/sqft | DOM | Units | Dist |
|---|---|---|---|---|---|---|---|---|
| 40547 Berylline Ln Magnolia, TX | 4.0 | 2.0 | 1753 | $2,300 | $1.31 | 43d | 1 | 0.15mi |
| 14727 Band Tailed Pigeon Ct Magnolia, TX | 4.0 | 3.0 | 1942 | $2,700 | $1.39 | 43d | 1 | 0.62mi |
| 14983 Clay Harvest Rdg Magnolia, TX | 4.0 | 3.0 | 2173 | $2,375 | $1.09 | 43d | 1 | 1.13mi |
| 15128 Lavender Mist Ct Magnolia, TX | 4.0 | 3.0 | 2561 | $2,800 | $1.09 | 19d | 1 | 1.32mi |
HOA detail
- Monthly dues
- $154 · $1,848/yr
- Likely covers
- pool
Listing history 18 events
-
2026-06-18days on market $339,949 Active 62 DOM
-
2026-06-17days on market $339,949 Active 61 DOM
-
2026-06-16days on market $339,949 Active 60 DOM
-
2026-06-15days on market $339,949 Active 59 DOM
-
2026-06-13days on market $339,949 Active 57 DOM
-
2026-06-09days on market $339,949 Active 53 DOM
-
2026-06-08days on market $339,949 Active 52 DOM
-
2026-06-07days on market $339,949 Active 51 DOM
-
2026-06-04days on market $339,949 Active 48 DOM
-
2026-06-03days on market $339,949 Active 47 DOM
-
2026-06-02days on market $339,949 Active 46 DOM
-
2026-06-01days on market $339,949 Active 45 DOM
-
2026-05-31days on market $339,949 Active 44 DOM
-
2026-04-17historical
Show marketing remark (1002 chars)
Welcome to 40606 Guillemont Ln in Magnolia, where space, style & value come together. This contemporary 4-bedroom, 2.5-bath home offers 2,606 sq ft & stands out as one of the last fully customized homes in the section at this price point. Inside you’ll find an open-concept layout with wood-look tile flooring, abundant natural light, a spacious living area & a beautifully designed kitchen with a large island, white cabinetry, stainless steel appliances & generous dining space. The private primary suite features a soaking tub, separate shower & a custom accent wall. Upstairs, enjoy the flexibility of a game room PLUS a dedicated media room with surround sound & step-up flooring for the ultimate movie-night experience. Furniture in the home can stay if desired. Outside, the extended back patio creates even more room to relax or entertain. A rare opportunity to get more space & features for your money. Low Tax Rate & neighborhood pool coming this Summer!
-
2026-04-17$345,000 Active 1002-char remark
Show marketing remark (1002 chars)
Welcome to 40606 Guillemont Ln in Magnolia, where space, style & value come together. This contemporary 4-bedroom, 2.5-bath home offers 2,606 sq ft & stands out as one of the last fully customized homes in the section at this price point. Inside you’ll find an open-concept layout with wood-look tile flooring, abundant natural light, a spacious living area & a beautifully designed kitchen with a large island, white cabinetry, stainless steel appliances & generous dining space. The private primary suite features a soaking tub, separate shower & a custom accent wall. Upstairs, enjoy the flexibility of a game room PLUS a dedicated media room with surround sound & step-up flooring for the ultimate movie-night experience. Furniture in the home can stay if desired. Outside, the extended back patio creates even more room to relax or entertain. A rare opportunity to get more space & features for your money. Low Tax Rate & neighborhood pool coming this Summer!
-
2026-02-13$350,000 Active
-
2026-02-13historical
-
2026-01-17$359,000 Active
ⓘ Source: listings_history table (triggers on properties + properties_extension) + one-shot
backfill from property_details.listing_events for pre-trigger history.
Tax reassessment forecast TX · Resets to sale price
- Current annual tax
- $6,752 · $563/mo
- Projected year-2 tax
- $6,752 · $563/mo
- Expected delta
- $0/yr ($0/mo · -0.0%)
ⓘ Screening estimate from a state-policy table — verify with the county assessor before closing.
Climate risk First Street
- Flood 1/10 Low FEMA zone X (unshaded) · 0% chance over 30 yrs
- Wildfire 4/10 Moderate
- Heat 8/10 Severe 7 d/yr ≥111°F today · 22 d/yr by 30 yrs out
- Wind 8/10 Severe 99% chance of damaging wind over 30 yrs
- Air quality 2/10 Low 2 unhealthy d/yr today · 2 by 30 yrs out
Nearby sold comps map
Loading sold comps map…
Walkable amenities ~0.75 mi
Loading nearby amenities…
Taxation est. · year 1
- Rental income
- $29,758
- − Mortgage interest
- −$19,042
- − Property taxes
- −$6,752
- − Insurance
- −$1,700
- − Repairs & maintenance
- −$2,381
- − Management
- −$2,381
- − HOA
- −$1,848
- − Depreciation
- −$9,889
- Taxable loss
- −$14,235
- Est. tax savings @ 24.0%
- +$3,416
- After-tax cash flow
- $-4,767/yr
For passive investors: Depreciation is non-cash, so a rental often shows a tax loss while cash-flowing — sheltering income. Rental losses are passive: they offset passive income freely, and up to $25,000/yr can offset ordinary (W-2) income if you actively participate and your MAGI is under $100k (phasing out to $0 by $150k); unused losses carry forward. On sale, claimed depreciation is recaptured at up to 25%, and gains may owe capital-gains tax (a 1031 exchange can defer both). Figures are a year-1 estimate at your 24.0% rate — not tax advice; consult a CPA.
Schools (NCES district)
- District
- Magnolia ISD
- NCES district ID
- 4828740
- Math proficiency
- 42% ▼ -7.00%
- Reading proficiency
- 45% ▼ -4.00%
- Median HH income
- $71,692
- Composite
- 39.46/100
- National rank
- #3958
- State rank
- #247 of 826 in TX
Livability — Pinehurst
- Score
- 55/100
- State rank
- #1350
- US rank
- #23272
Category grades
Schools grade is shown separately in the Schools card above.
Census & demographics
- County
- Montgomery County · 663,713 people
- City population
- 106,505
- Metro
- Houston-The Woodlands-Sugar Land, TX
- Population (ZIP)
- 44,900
- Household income
- $112,504
- Rent vs Own
- Severe rent burden
- 586.0
Population outlook (Montgomery County) Hauer SSP2
- Today (2025)
- 713,896 people
- By 2030
- 805,263 · +12.8%
- By 2040
- 992,708 · +39.1%
- By 2050
- 1,179,590 · +65.2%
- By 2075
- 1,628,084 · +128.1%
- By 2100
- 1,937,880 · +171.5%
Race, ethnicity, and origin ACS 2023
- Neighborhood character
- Predominantly White (66%)
- Race & ethnicity
- White 66% Hispanic / Latino 25% Two or more races 18% Black 3% Asian 1%
- Hispanic origin (detail)
- Mexican 14% Puerto Rican 1%
- Common ancestry
- Lithuanian 4% Slovak 2% Italian 2%
- Foreign-born
- 11% · Canada, Vietnam
- Languages at home
- 83% English-only · Spanish 15% Other Indo-European 1% German/W. Germanic 1%
Political lean MEDSL · Montgomery
- 2024 margin
- Solid R (+45.5) · D 26.8% · R 72.3%
- 2008→2024 swing
- +7.2pp toward D · 2008: -52.7pp · 2024: -45.5pp
- All cycles
- 2024: R+45.5 2020: R+43.8 2016: R+51.4 2012: R+60.7 2008: R+52.7
Not yet ingested
- Civics
- —
Market trends
- HPI YoY
- ▲ 12.09%
- Current HPI
- 512.87
- Rent YoY
- ▲ 0.32%
- Metro
- Houston-The Woodlands-Sugar Land, TX
- State GDP YoY
- ▲ 3.95%
- F500 in state
- 110
Industry mix (Fortune 500 HQ in TX)
| Industry | F500 HQs | Revenue |
|---|---|---|
| Energy | 16 | $1,198B |
|
||
| Technology | 5 | $198B |
|
||
| Engineering / Construction | 4 | $72B |
|
||
| Energy Services | 3 | $60B |
|
||
| Utilities | 3 | $41B |
|
||
| Healthcare | 2 | $330B |
|
||
Price history
-3.9% since first listed5 events — show timeline
- 2026-04-17 Listed $345,000 HARMLS
- 2026-04-17 Listing Removed — HARMLS
- 2026-02-13 Listing Removed — HARMLS
- 2026-02-13 Listed $350,000 HARMLS
- 2026-01-17 Listed $359,000 HARMLS
Property tax history
+88.1%/yrLatest (2025): $6,752 · +1.3% YoY. Source: county tax records.
Cash-flow waterfall
monthlySold comps — $/sqft
last 12 mo · ≤1 miLoading sold comps…