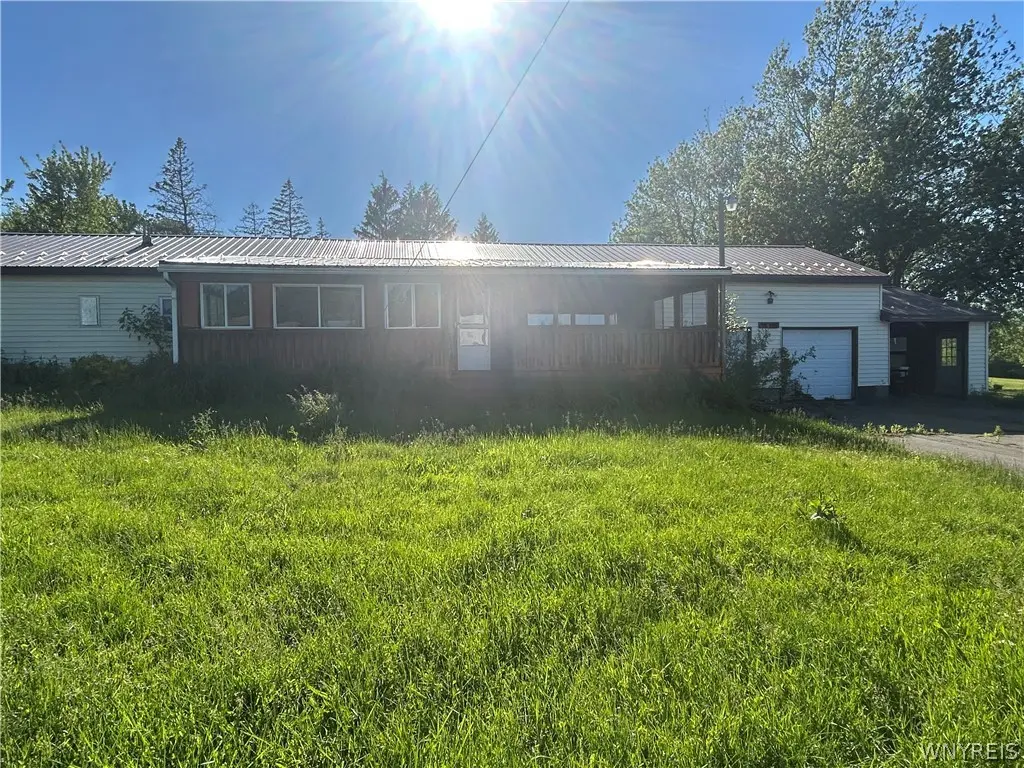
10649 North Rd · Perrysburg, NY
Flood risk 1/10 · Minimal
- FEMA flood zone
- —
- Chance of flooding over 30 yrs
- 0.0%
- Est. flood insurance / yr
- —
Fire risk 3/10 · Minor
- Est. fire insurance / yr
- $691 – $1,283
Heat risk 1/10 · Minimal
- Hot days now (above 92°F)
- 7 days/yr
- Hot days in 30 yrs
- 17 days/yr
Wind risk 1/10 · Minimal
- Chance of severe wind over 30 yrs
- —
Air-quality risk 2/10 · Minimal
- Unhealthy air days now
- 1 days/yr
- Unhealthy air days in 30 yrs
- 2 days/yr
Risk factors via First Street. Map © Google.
Why this score? — see what drove the B grade
The composite is a weighted blend of 9 inputs, each scored 0–100. Each bar is that input's sub-score; the figure is the points it added to the 100-point composite (weight × sub-score).
- Cash flow +30.0/30.0
- 1% rule +10.0/10.0
- DSCR +10.0/10.0
- Appreciation +8.9/10.0
- Schools +3.5/10.0
- Livability +3.1/5.0
- ARV discount +2.5/15.0
- Rent growth +2.5/5.0
- Condition / age +2.5/5.0
$65,000
🖨 Deal sheet 📄 Offer letter ✓ Due diligence
Listing remarks MLS
Are you in the market for a single-family home in the peaceful town of Perrysburg? This charming ranch-style residence is situated on more than an acre of land, just around 5 miles from Zoar Valley and under 3 miles from the Seneca Nation Territory. With over 1,600 square feet of living space, this home features a roomy living room, a spacious kitchen, and an attached three-car garage. Home needs rehab and financing will be limited.
Key facts
- Complete remodel
- Plenty of land
- Over an acre
Tags
Property features AI
Exterior
- Parking: Attached garage; Three-car garage
- Utilities: High-speed internet available; Public water connected; Sewer available; Circuit breaker electric
- Home design: Single-story home; Resale fixer condition; Metal roof; Rectangular lot; Lot dimensions approximately 379 x 145; Frontage on a main thoroughfare
- Construction: Vinyl siding; Blown-in insulation; Crawl space foundation; Existing construction
- Exterior features: Blacktop driveway; Shed(s) / storage
Interior
- Kitchen: Eat-in kitchen; Pantry
- Bedrooms: Three main-level bedrooms
- Flooring: Vinyl; Varies
- Bathrooms: One full bathroom; One half bathroom; Two main-level bathrooms
- Heating & cooling: Gas forced-air heating
- Interior features: Cathedral ceilings; Den; Separate formal dining room; Eat-in kitchen; Pantry
- Laundry & utility: Main-level laundry; Gas water heater
Neighborhood map
What this means for you Summary
Snapshot
- This is a 3-bed/1.5-bath single-family listed at $65k.
Deal economics
- At list price, monthly cash flow is $343 ($4k/yr) — positive.
- The deal already cash-flows at list — no discount required.
- Meets the 1% rule at list price ($1k rent vs $65k).
- Recommended offer: $64k (1.5% below list) — sets the bar for market timing.
Location & tenants
- Location reads 62/100 on livability (#880 in NY) — a middle-class / working-renter tenant base. Strengths: cost of living A+, housing A+, employment A-; Watch: schools F, crime F, amenities F.
- Gowanda Central School District (rural): math 38% / reading 44% proficiency, ranked #513 of 590 in NY (top 87%) — families likely to look elsewhere, expect single-tenant / working-renter base with shorter leases.
- Market conditions: 5 active listings in the ZIP; 128 units permitted in Cattaraugus County in 2024 (21 in 5+ unit buildings).
Forward outlook
- In year one you build about $6k of equity ($449 loan paydown + $5k appreciation (7.8% local appreciation)).
- Cattaraugus County population projected at -28% by 2050 — secular population decline; favor cash flow + early exit over multi-decade hold.
- At projected returns (7.8% appreciation + 3.0% rent growth), your $18k cash investment doubles in ~2 years — after that, you're playing with house money.
- By year 6, paydown + projected appreciation supports a ~$31k cash-out refi (75% LTV) — recoverable capital for the next deal without selling this one.
Negotiation context
- It's been on market 17 days — a 2% lower offer ($64k) is reasonable based on typical stale-listing flexibility.
- 3 sale attempts since 5y ago with the ask held roughly flat each time — persistent listings suggest the price (not the market) is what's stuck; bring a comps-based counter.
Risks & watch-outs
- Watch-outs: property tax is 4.6% of price.
Questions for the listing agent
- Property tax is high relative to price — has the assessment been appealed recently, and will the sale trigger a re-assessment?
- Is there a deadline driving the sale (1031 exchange, divorce, estate, relocation)? That informs how much negotiation room exists.
- Schools are F-rated, which usually means shorter tenancies and higher turnover. Who's the typical renter profile here, and what's been the actual vacancy rate?
- Crime grade is F in this area — have there been break-ins, vandalism, or insurance claims at this property in the last 3 years? What carrier currently insures it and at what premium?
- What's the average days-on-market for RENTAL listings here right now (not sales)? A rising rental-DOM trend means longer vacancies and softer asking-rent achievability than the comps imply.
- What's the recent tenant-quality profile in this submarket — average credit score on applications, eviction rate, late-payment / NSF rate, and stable-employment percentage? A property-management company in the area should have these aggregated.
- How much new for-sale + rental construction is in the pipeline within 1–3 miles? Heavy new supply typically softens prices + rents 12–24 months out; constrained supply supports both.
Investment metrics
- 1% rule
- 1.87% ✓
- Cap rate
- 12.63%
- Cash-on-cash
- 22.62%
- DSCR
- 2.01
- GRM
- 4.5
CMA / ARV
- ARV (on-the-fly)
- $58,520
- Comps found
- 2
Show comp detail 2 sales within ~0.75 mi
| Address | Dist | Beds/Ba | Sqft | Sold | Price | $/sf | Match |
|---|---|---|---|---|---|---|---|
| 10649 North Rd | 0.00mi | 3/1.5 | 1,672 (0%) | 7mo | $59,000 | $35 | 94 |
| 10573 North Rd | 0.18mi | 3/1.0 | 1,440 (-14%) | 24mo | $50,000 | $35 | 47 |
Match score weights: distance 35% · size 25% · config 20% · recency 20%. Top-matched comps best support the ARV.
Projected returns pro-forma
7.83% appreciation · 3.0% rent growth · sell at horizon
- IRR
- 37.7%
- Equity multiple
- 3.64×
- Total profit
- $48,030
- Equity at exit
- $48,622
- IRR
- 33.7%
- Equity multiple
- 7.78×
- Total profit
- $123,345
- Equity at exit
- $95,797
Cash invested: $18,200 (down + closing). Projections, not guarantees.
Landlord ↔ Tenant lean methodology
- Overall (STATE)
- 15 Strongly Tenant-Friendly
- State New York
- 15 Strongly Tenant-Friendly · D+10
- County
- — inherits STATE
- City
- — inherits STATE
ZIP-level market 14129
- Home prices YoY
- 2.9%
- Active inventory
- 5
- Price-to-rent
- 4.5×
Monthly cashflow live
- Estimated rent
- $1,212 medium interval (Pro) →
- Mortgage (P&I)
- −$341
- Tax from tax record
- −$247 /mo · $2,961/yr
- Insurance
- −$27
- HOA
- −$0
- Vacancy / Maint / Mgmt
- −$255
- Net cashflow
- $343
Break-even live
UW: 25.0% down · 7.5% · 30yr · 1.5% tax · 5.0% vac · 8.0% maint · 8.0% mgmt
Financing live
Cash to close
- Down payment
- $16,250
- Closing costs
- $1,950
- Reserves months
- —
- Total cash needed
- —
Loan-product check · same deal, 3 products live
Conventional
25% down · 7.5% · 30yr
- Down + closing
- —
- Monthly P&I
- —
- Monthly cashflow
- —
- DSCR
- —
- Eligible?
- —
Personal DTI + credit; lowest rate.
DSCR
20% down · 8.5% · 30yr
- Down + closing
- —
- Monthly P&I
- —
- Monthly cashflow
- —
- DSCR
- —
- Eligible?
- —
No personal income docs; deal must DSCR.
Hard money
10% down · 12.0% · 12mo
- Down + closing
- —
- Monthly P&I
- —
- Monthly cashflow
- —
- DSCR
- —
- Eligible?
- —
Short-term bridge; refi at stabilization.
Listing history 13 events
-
2026-06-18days on market $65,000 Active 17 DOM
-
2026-06-17days on market $65,000 Active 16 DOM
-
2026-06-16days on market $65,000 Active 15 DOM
-
2026-06-15days on market $65,000 Active 14 DOM
-
2026-06-13days on market $65,000 Active 12 DOM
-
2026-06-12days on market $65,000 Active 11 DOM
-
2026-06-09days on market $65,000 Active 8 DOM
-
2026-06-08days on market $65,000 Active 7 DOM
-
2026-06-07days on market $65,000 Active 6 DOM
-
2026-06-07days on market $65,000 Active 5 DOM
-
2026-06-04days on market $65,000 Active 2 DOM
-
2026-06-01remarks 589-char remark
-
2026-06-01$65,000 Active 1 DOM
ⓘ Source: listings_history table (triggers on properties + properties_extension) + one-shot
backfill from property_details.listing_events for pre-trigger history.
Tax reassessment forecast NY · Partial reset (capped growth)
- Current annual tax
- $2,961 · $247/mo
- Projected year-2 tax
- $2,961 · $247/mo
- Expected delta
- $0/yr ($0/mo · 0.0%)
ⓘ Screening estimate from a state-policy table — verify with the county assessor before closing.
Climate risk First Street
- Flood 1/10 Low 0% chance over 30 yrs
- Wildfire 3/10 Moderate
- Heat 1/10 Low 7 d/yr ≥92°F today · 17 d/yr by 30 yrs out
- Wind 1/10 Low
- Air quality 2/10 Low 1 unhealthy d/yr today · 2 by 30 yrs out
Nearby sold comps map
Loading sold comps map…
Walkable amenities ~0.75 mi
Loading nearby amenities…
Taxation est. · year 1
- Rental income
- $14,548
- − Mortgage interest
- −$3,641
- − Property taxes
- −$2,961
- − Insurance
- −$325
- − Repairs & maintenance
- −$1,164
- − Management
- −$1,164
- − Depreciation
- −$1,891
- Taxable income
- $3,402
- Est. tax owed @ 24.0%
- −$817
- After-tax cash flow
- $3,300/yr
For passive investors: Depreciation is non-cash, so a rental often shows a tax loss while cash-flowing — sheltering income. Rental losses are passive: they offset passive income freely, and up to $25,000/yr can offset ordinary (W-2) income if you actively participate and your MAGI is under $100k (phasing out to $0 by $150k); unused losses carry forward. On sale, claimed depreciation is recaptured at up to 25%, and gains may owe capital-gains tax (a 1031 exchange can defer both). Figures are a year-1 estimate at your 24.0% rate — not tax advice; consult a CPA.
Schools (NCES district)
- District
- Gowanda Central School District
- NCES district ID
- 3612390
- Math proficiency
- 38% ▼ -13.00%
- Reading proficiency
- 44% ▲ 3.00%
- Median HH income
- $43,777
- Composite
- 34.71/100
- National rank
- #5138
- State rank
- #513 of 590 in NY
Livability — Perrysburg
- Score
- 62/100
- State rank
- #880
- US rank
- #17139
Category grades
Schools grade is shown separately in the Schools card above.
Census & demographics
- Census place
- Perrysburg, NY
- Population (ZIP)
- 1,228
Population outlook (Cattaraugus County) Hauer SSP2
- Today (2025)
- 71,623 people
- By 2030
- 67,751 · -5.4%
- By 2040
- 59,488 · -16.9%
- By 2050
- 51,601 · -28.0%
- By 2075
- 35,025 · -51.1%
- By 2100
- 21,243 · -70.3%
Race, ethnicity, and origin ACS 2023
- Neighborhood character
- Predominantly White (74%)
- Race & ethnicity
- White 74% Native American 10% Two or more races 8% Hispanic / Latino 4%
- Common ancestry
- Romanian 14% Lithuanian 3% Slovak 1%
- Foreign-born
- 0%
- Languages at home
- 90% English-only · Spanish 5% Other Indo-European 1%
Political lean MEDSL · Cattaraugus
- 2024 margin
- Solid R (+32.8) · D 33.6% · R 66.4%
- 2008→2024 swing
- -22.2pp toward R · 2008: -10.6pp · 2024: -32.8pp
- All cycles
- 2024: R+32.8 2020: R+29.5 2016: R+34.4 2012: R+13.4 2008: R+10.6
Not yet ingested
- Civics
- —
Market trends
- HPI YoY
- ▲ 7.83%
- Current HPI
- 276.8443
- Rent YoY
- —
- Metro
- —
- State GDP YoY
- ▲ 2.60%
- F500 in state
- 92
Industry mix (Fortune 500 HQ in NY)
| Industry | F500 HQs | Revenue |
|---|---|---|
| Financial Services | 10 | $950B |
|
||
| Consumer Goods | 9 | $162B |
|
||
| Insurance | 4 | $225B |
|
||
| Telecommunications | 2 | $144B |
|
||
| Pharmaceuticals | 2 | $112B |
|
||
| Media / Entertainment | 2 | $69B |
|
||
Price history
-45.8% since first listed15 events — show timeline
- 2026-06-01 Listed $65,000 WNYREIS
- 2025-11-19 Sold (MLS) $59,000 WNYREIS
- 2025-10-08 Price Changed $59,900 WNYREIS
- 2025-09-10 Price Changed $64,900 WNYREIS
- 2025-07-30 Price Changed $74,900 WNYREIS
- 2025-06-28 Price Changed $89,900 WNYREIS
- 2025-05-28 Price Changed $94,900 WNYREIS
- 2025-04-27 Price Changed $99,900 WNYREIS
- 2025-03-25 Listed $104,900 WNYREIS
- 2021-09-07 Sold (MLS) $100,700 WNYREIS
- 2021-09-01 Sold (Public Records) $100,700 Public Records
- 2021-06-02 Pending — WNYREIS
- 2021-05-27 Price Changed $109,900 WNYREIS
- 2021-05-24 Price Changed $115,000 WNYREIS
- 2021-04-23 Listed $120,000 WNYREIS
Property tax history
+3.5%/yrLatest (2025): $2,961 · -4.1% YoY. Source: county tax records.
Cash-flow waterfall
monthlySold comps — $/sqft
last 12 mo · ≤1 miLoading sold comps…