 🏷️ Likely Rental
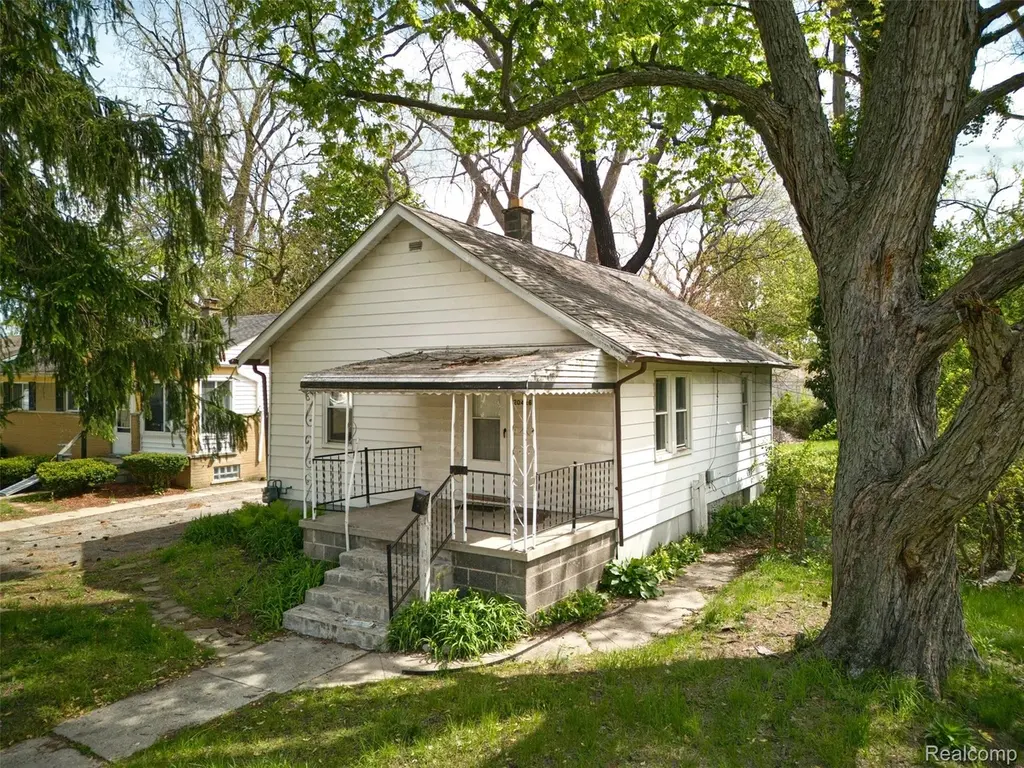
20426 Salem St · Detroit, MI
Flood risk 1/10 · Minimal
- FEMA flood zone
- X (unshaded)
- Chance of flooding over 30 yrs
- 0.0%
- Est. flood insurance / yr
- $507 – $1,088
Fire risk 1/10 · Minimal
- Est. fire insurance / yr
- $784 – $1,456
Heat risk 3/10 · Minor
- Hot days now (above 98°F)
- 7 days/yr
- Hot days in 30 yrs
- 15 days/yr
Wind risk 2/10 · Minimal
- Chance of severe wind over 30 yrs
- —
Air-quality risk 3/10 · Minor
- Unhealthy air days now
- 2 days/yr
- Unhealthy air days in 30 yrs
- 3 days/yr
Risk factors via First Street. Map © Google.
Why this score? — see what drove the B+ grade
The composite is a weighted blend of 9 inputs, each scored 0–100. Each bar is that input's sub-score; the figure is the points it added to the 100-point composite (weight × sub-score).
- Cash flow +30.0/30.0
- ARV discount +15.0/15.0
- 1% rule +10.0/10.0
- DSCR +10.0/10.0
- Rent growth +4.5/5.0
- Livability +3.7/5.0
- Condition / age +2.5/5.0
- Schools +1.3/10.0
- Appreciation +0.0/10.0
$72,999
🖨 Deal sheet 📄 Offer letter ✓ Due diligence
Listing remarks MLS
National Real Estate Management Group is excited to announce your next investment opportunity. Welcome to this charming home featuring 3 bedrooms and 1 full bathroom. Outside you will find a covered front porch and fenced-in back yard. This property provides convenient access to major roadways, and is located near parks, schools, shopping and dining. A great addition to any investment portfolio. At National Real Estate Management Group, our listings come with built-in property management for seamless, turnkey investments. Our full-service approach covers everything from construction completion to tenant placement and ongoing management. Services include comprehensive property management, tenant screening, financial reporting, legal compliance, and streamlined communication. Choose National Real Estate Management Group for a worry-free investment experience.
Key facts
- Covered front porch
- Near schools
- Near dining
Tags
Property features AI
Finance
- Financial info: Annual taxes listed
Exterior
- Parking: No garage
- Utilities: Public water; Public sewer
- Home design: Single-family residence; One story; Ground-level entry with steps
- Construction: Aluminum siding; Slab foundation
- Exterior features: Paved road access; Lot approximately 0.28 acres (133 x 90)
Interior
- Bathrooms: 1 full bathroom
- Heating & cooling: Forced air heating; Natural gas heating; No cooling
- Interior features: Total of 4 rooms
Neighborhood map
What this means for you Summary
Snapshot
- This is a 3-bed/1.0-bath single-family listed at $73k.
Deal economics
- At list price, monthly cash flow is $498 ($6k/yr) — positive.
- The deal already cash-flows at list — no discount required.
- Meets the 1% rule at list price ($1k rent vs $73k).
- Recommended offer: $71k (3.0% below list) — sets the bar for market timing.
- Cap rate 14.5% vs local median 10.2% in Detroit — top-decile yield for the area; either an underpriced asset or a hidden risk that comps aren't pricing in. Stress-test before assuming the spread holds.
Location & tenants
- Location reads 73/100 on livability (#218 in MI) — a middle-class / working-renter tenant base. Strengths: amenities A+, commute A+, cost of living A+; Watch: schools F, crime F, employment F.
- Detroit Public Schools Community District (urban): math 10% / reading 24% proficiency, ranked #499 of 540 in MI (top 92%) — low school quality limits family demand, transient renter base, plan for 1-2y turnover; 90% free/reduced lunch — lower-income household profile, screen leases tightly.
- Market conditions: Rents rising fast (+8.0%/yr); 305 active listings in the ZIP; 25 comparable units currently listed for rent nearby; rentals lingering (median 44d on market — plan ~5-8 weeks vacancy on turnover, expect pricing pressure); 52% of comp listings sitting > 30 days — soft ceiling on asking rent; lower-income renter base — watch delinquency; 2,639 units permitted in Wayne County in 2024 (1,216 in 5+ unit buildings).
- This rent runs 36% of the median local income ($44k/yr) — at the standard rent-burdened threshold; future hikes will face affordability resistance.
Forward outlook
- Local home prices are declining (-3.0%/yr); year-one equity from $504 of loan paydown is wiped out by about $2k of value loss. Plan a longer hold.
- Wayne County population projected at -17% by 2050 — secular population decline; favor cash flow + early exit over multi-decade hold.
- At projected returns (-3.0% appreciation + 8.0% rent growth), your $20k cash investment doubles in ~4 years — after that, you're playing with house money.
Negotiation context
- It's been on market 34 days — a 3% lower offer ($71k) is reasonable based on typical stale-listing flexibility.
- 11 sale attempts since 12y ago; this cycle's ask has dropped $16k (18%) from the opening price — seller is motivated, your offer sets the floor, not the list.
- Current owner paid $60k; 22% above their basis — modest negotiation headroom, anchor on the comps not their cost.
Risks & watch-outs
- Watch-outs: built in 1918 — expect roof / HVAC / electrical / plumbing capex.
Questions for the listing agent
- It's been on market 34 days. Have you received any prior offers? Is the seller open to a 3% concession, seller financing, or rate buy-down credit?
- Built in 1918 — when were the roof, HVAC, electrical panel, plumbing, and water heater last replaced?
- Is there a deadline driving the sale (1031 exchange, divorce, estate, relocation)? That informs how much negotiation room exists.
- Schools are F-rated, which usually means shorter tenancies and higher turnover. Who's the typical renter profile here, and what's been the actual vacancy rate?
- Crime grade is F in this area — have there been break-ins, vandalism, or insurance claims at this property in the last 3 years? What carrier currently insures it and at what premium?
- What's the average days-on-market for RENTAL listings here right now (not sales)? A rising rental-DOM trend means longer vacancies and softer asking-rent achievability than the comps imply.
- What's the recent tenant-quality profile in this submarket — average credit score on applications, eviction rate, late-payment / NSF rate, and stable-employment percentage? A property-management company in the area should have these aggregated.
- How much new for-sale + rental construction is in the pipeline within 1–3 miles? Heavy new supply typically softens prices + rents 12–24 months out; constrained supply supports both.
Investment metrics
- 1% rule
- 1.79% ✓
- Cap rate
- 14.47%
- Cash-on-cash
- 29.22%
- DSCR
- 2.30
- GRM
- 4.7
CMA / ARV
- ARV (median comp)
- $119,121
- List price
- $72,999
- Delta
- -38.72%
- Verdict
- UNDERPRICED
- Comps
- 20 within 1.0 mi
Show comp detail 12 sales within ~0.75 mi
| Address | Dist | Beds/Ba | Sqft | Sold | Price | $/sf | Match |
|---|---|---|---|---|---|---|---|
| 20403 Grandview St | 0.04mi | 3/1.0 | 908 (+5%) | 6mo | $83,000 | $91 | 85 |
| 20441 Fenton St | 0.16mi | 2/1.0 (-1) | 858 (-1%) | 12mo | $85,000 | $99 | 76 |
| 20441 Five Points St | 0.10mi | 2/1.0 (-1) | 814 (-6%) | 11mo | $65,000 | $80 | 71 |
| 19978 Grandview St | 0.18mi | 3/1.0 | 939 (+8%) | 8mo | $100,000 | $106 | 71 |
| 20531 Lennane | 0.35mi | 3/1.0 | 922 (+6%) | 7mo | $140,000 | $152 | 67 |
| 19916 Salem St | 0.26mi | 2/1.0 (-1) | 816 (-6%) | 11mo | $64,000 | $78 | 64 |
| 19940 Salem St | 0.22mi | 3/1.0 | 972 (+12%) | 12mo | $99,900 | $103 | 59 |
| 19309 Lenore | 0.62mi | 3/1.0 | 920 (+6%) | 2mo | $86,900 | $94 | 59 |
| 19512 Garfield | 0.47mi | 2/1.0 (-1) | 920 (+6%) | 11mo | $115,000 | $125 | 54 |
| 20430 Beech Daly Rd | 0.56mi | 3/1.0 | 922 (+6%) | 12mo | $148,000 | $161 | 53 |
| 19371 Winston St | 0.53mi | 3/1.5 | 960 (+11%) | 5mo | $120,200 | $125 | 51 |
| 19495 Dalby | 0.52mi | 3/1.0 | 960 (+11%) | 12mo | $172,000 | $179 | 48 |
Match score weights: distance 35% · size 25% · config 20% · recency 20%. Top-matched comps best support the ARV.
Projected returns pro-forma
-3.0% appreciation · 8.0% rent growth · sell at horizon
- IRR
- 29.4%
- Equity multiple
- 2.31×
- Total profit
- $26,798
- Equity at exit
- $10,884
- IRR
- 39.6%
- Equity multiple
- 5.68×
- Total profit
- $95,673
- Equity at exit
- $6,312
Cash invested: $20,440 (down + closing). Projections, not guarantees.
Landlord ↔ Tenant lean methodology
- Overall (STATE)
- 62 Landlord-Friendly
- State Michigan
- 62 Landlord-Friendly · EVEN
- County
- — inherits STATE
- City
- — inherits STATE
ZIP-level market 48219
- Home prices YoY
- -10.3%
- Rents YoY
- 8.0%
- Active inventory
- 305
- Price-to-rent
- 4.7×
Monthly cashflow live
- Estimated rent
- $1,304 high interval (Pro) →
- Mortgage (P&I)
- −$383
- Tax from tax record
- −$120 /mo · $1,434/yr
- Insurance
- −$30
- HOA
- −$0
- Vacancy / Maint / Mgmt
- −$274
- Net cashflow
- $498
Break-even live
UW: 25.0% down · 7.5% · 30yr · 1.5% tax · 5.0% vac · 8.0% maint · 8.0% mgmt
Financing live
Cash to close
- Down payment
- $18,250
- Closing costs
- $2,190
- Reserves months
- —
- Total cash needed
- —
Loan-product check · same deal, 3 products live
Conventional
25% down · 7.5% · 30yr
- Down + closing
- —
- Monthly P&I
- —
- Monthly cashflow
- —
- DSCR
- —
- Eligible?
- —
Personal DTI + credit; lowest rate.
DSCR
20% down · 8.5% · 30yr
- Down + closing
- —
- Monthly P&I
- —
- Monthly cashflow
- —
- DSCR
- —
- Eligible?
- —
No personal income docs; deal must DSCR.
Hard money
10% down · 12.0% · 12mo
- Down + closing
- —
- Monthly P&I
- —
- Monthly cashflow
- —
- DSCR
- —
- Eligible?
- —
Short-term bridge; refi at stabilization.
Rent comps 25 comps
| Address | Beds | Baths | Sqft | Rent | $/sqft | DOM | Units | Dist |
|---|---|---|---|---|---|---|---|---|
| 20410 Five Points St Redford, MI | 3.0 | 1.0 | 950 | $1,600 | $1.68 | 5d | 1 | 0.07mi |
| 20083 Salem St Detroit, MI | 3.0 | 1.0 | 969 | $1,050 | $1.08 | 11d | 1 | 0.08mi |
| 20083 Salem St Detroit, MI | 3.0 | 1.0 | 969 | $1,050 | $1.08 | 5d | 1 | 0.08mi |
| 25400 Basin St Southfield, MI | 1.0–2.0 | 1.0 | 825 | $1,400 | $1.70 | 5d | 11 | 0.49mi |
| 25740 Shiawassee St Southfield, MI | 1.0–2.0 | 1.0 | 850 | $1,253 | $1.47 | 44d | 10 | 0.53mi |
| 19800 Telegraph Rd Detroit, MI | 2.0 | 1.0 | 855 | $1,020 | $1.19 | 44d | 1 | 0.58mi |
| 23411 W Eight Mile Rd Detroit, MI | 1.0–2.0 | 1.0 | 742 | $1,000 | $1.35 | 44d | 1 | 0.67mi |
| 19264 Telegraph Rd Unit G7 Detroit, MI | 2.0 | 1.0 | 820 | $975 | $1.19 | 44d | 1 | 0.75mi |
| 19276 Telegraph Rd Detroit, MI | 2.0 | 1.0 | 820 | $975 | $1.19 | 44d | 1 | 0.76mi |
| 19248 Telegraph Rd Unit P7 Detroit, MI | 2.0 | 1.0 | 820 | $975 | $1.19 | 24d | 1 | 0.78mi |
| 19250 Telegraph Rd Unit O7 Detroit, MI | 2.0 | 1.0 | 820 | $975 | $1.19 | 24d | 1 | 0.78mi |
| 24224 W 7 Mile Rd Detroit, MI | 1.0–2.0 | 1.0 | 600 | $875 | $1.46 | 44d | 3 | 0.84mi |
| 19301 Shiawassee Dr Detroit, MI | 1.0–2.0 | 1.0 | 740 | $1,150 | $1.55 | 44d | 2 | 0.85mi |
| 18732 Salem Unit 2 Detroit, MI | 2.0 | 1.0 | 925 | $1,050 | $1.14 | 12d | 1 | 0.90mi |
| 19800 Berg Rd Detroit, MI | 3.0 | 1.0 | 1000 | $1,550 | $1.55 | 17d | 1 | 0.98mi |
| 22649 Frisbee St Detroit, MI | 3.0 | 1.0 | 1100 | $1,495 | $1.36 | 44d | 1 | 1.02mi |
| 18302 Wormer St Detroit, MI | 3.0 | 1.0 | 1046 | $1,475 | $1.41 | 44d | 1 | 1.20mi |
| 20516 Denby Redford, MI | 4.0 | 1.5 | 950 | $1,800 | $1.89 | 18d | 1 | 1.25mi |
| 22238 Pembroke Ave Detroit, MI | 3.0 | 1.5 | 1100 | $1,500 | $1.36 | 44d | 1 | 1.25mi |
| 22570 Seven Mile W Detroit, MI | 2.0 | 1.0 | 890 | $875 | $0.98 | 44d | 1 | 1.27mi |
| 19928 Houghton St Detroit, MI | 3.0 | 1.0 | 880 | $1,495 | $1.70 | 11d | 1 | 1.30mi |
| 20524 Indian Redford, MI | 3.0 | 1.0 | 988 | $1,600 | $1.62 | 24d | 1 | 1.32mi |
| 20555 Lahser Rd Detroit, MI | 1.0–2.0 | 1.0 | 737 | $975 | $1.32 | 44d | 2 | 1.34mi |
| 26539 Clarita Redford, MI | 3.0 | 1.5 | 931 | $1,875 | $2.01 | 24d | 1 | 1.41mi |
| 47129 Wedgewood Southfield, MI | 1.0–2.0 | 1.0–2.0 | 1000 | $1,275 | $1.27 | 44d | 1 | 1.42mi |
Listing history 48 events
-
2026-06-18days on market $72,999 Active 34 DOM
-
2026-06-17days on market $72,999 Active 33 DOM
-
2026-06-15days on market $72,999 Active 31 DOM
-
2026-06-13days on market $72,999 Active 29 DOM
-
2026-06-13days on market $72,999 Active 28 DOM
-
2026-06-10price $72,999 Active 25 DOM
Show marketing remark (869 chars)
National Real Estate Management Group is excited to announce your next investment opportunity. Welcome to this charming home featuring 3 bedrooms and 1 full bathroom. Outside you will find a covered front porch and fenced-in back yard. This property provides convenient access to major roadways, and is located near parks, schools, shopping and dining. A great addition to any investment portfolio. At National Real Estate Management Group, our listings come with built-in property management for seamless, turnkey investments. Our full-service approach covers everything from construction completion to tenant placement and ongoing management. Services include comprehensive property management, tenant screening, financial reporting, legal compliance, and streamlined communication. Choose National Real Estate Management Group for a worry-free investment experience.
-
2026-06-09days on market $89,000 Active 25 DOM
-
2026-06-08days on market $89,000 Active 24 DOM
-
2026-06-07days on market $89,000 Active 23 DOM
-
2026-06-04days on market $89,000 Active 20 DOM
-
2026-06-03days on market $89,000 Active 19 DOM
-
2026-06-02days on market $89,000 Active 18 DOM
-
2026-06-01days on market $89,000 Active 17 DOM
-
2026-05-31days on market $89,000 Active 16 DOM
-
2026-05-15$89,000 Active 869-char remark
Show marketing remark (869 chars)
National Real Estate Management Group is excited to announce your next investment opportunity. Welcome to this charming home featuring 3 bedrooms and 1 full bathroom. Outside you will find a covered front porch and fenced-in back yard. This property provides convenient access to major roadways, and is located near parks, schools, shopping and dining. A great addition to any investment portfolio. At National Real Estate Management Group, our listings come with built-in property management for seamless, turnkey investments. Our full-service approach covers everything from construction completion to tenant placement and ongoing management. Services include comprehensive property management, tenant screening, financial reporting, legal compliance, and streamlined communication. Choose National Real Estate Management Group for a worry-free investment experience.
-
2026-01-13historical
-
2026-01-13historical
-
2025-11-21price $94,000
-
2025-11-20price $94,000
-
2025-11-07$99,000 Active
-
2025-11-07$99,000 Active
-
2025-11-07historical
-
2025-11-07historical
-
2025-09-12price $121,000
-
2025-09-11price $121,000
-
2025-08-23price $123,000
-
2025-08-22price $123,000
-
2025-07-18price $125,000
-
2025-07-18price $125,000
-
2025-06-26price $130,000
-
2025-06-26price $130,000
-
2025-06-05$140,000 Active
-
2025-06-05$140,000 Active
-
2024-05-16historical $950
-
2024-04-30price $950
-
2024-04-06price $1,050
-
2024-01-21$1,150
-
2021-10-08soldstatus $60,000
-
2015-06-02historical
-
2014-12-03historical
-
2014-12-02$4,600
-
2014-12-02$4,600
-
2014-10-31historical
-
2014-09-11historical
-
2014-03-17$4,600
-
2014-03-17$4,600
-
2002-11-14soldstatus $25,500
ⓘ Source: listings_history table (triggers on properties + properties_extension) + one-shot
backfill from property_details.listing_events for pre-trigger history.
Tax reassessment forecast MI · Partial reset (capped growth)
- Current annual tax
- $1,434 · $120/mo
- Projected year-2 tax
- $1,434 · $120/mo
- Expected delta
- $0/yr ($0/mo · 0.0%)
ⓘ Screening estimate from a state-policy table — verify with the county assessor before closing.
Climate risk First Street
- Flood 1/10 Low FEMA zone X (unshaded) · 0% chance over 30 yrs
- Wildfire 1/10 Low
- Heat 3/10 Moderate 7 d/yr ≥98°F today · 15 d/yr by 30 yrs out
- Wind 2/10 Low
- Air quality 3/10 Moderate 2 unhealthy d/yr today · 3 by 30 yrs out
Nearby sold comps map
Loading sold comps map…
Walkable amenities ~0.75 mi
Loading nearby amenities…
Taxation est. · year 1
- Rental income
- $15,652
- − Mortgage interest
- −$4,089
- − Property taxes
- −$1,434
- − Insurance
- −$365
- − Repairs & maintenance
- −$1,252
- − Management
- −$1,252
- − Depreciation
- −$2,124
- Taxable income
- $5,136
- Est. tax owed @ 24.0%
- −$1,233
- After-tax cash flow
- $4,739/yr
For passive investors: Depreciation is non-cash, so a rental often shows a tax loss while cash-flowing — sheltering income. Rental losses are passive: they offset passive income freely, and up to $25,000/yr can offset ordinary (W-2) income if you actively participate and your MAGI is under $100k (phasing out to $0 by $150k); unused losses carry forward. On sale, claimed depreciation is recaptured at up to 25%, and gains may owe capital-gains tax (a 1031 exchange can defer both). Figures are a year-1 estimate at your 24.0% rate — not tax advice; consult a CPA.
Schools (NCES district)
- District
- Detroit Public Schools Community District
- NCES district ID
- 2601103
- Math proficiency
- 10% ▼ -2.00%
- Reading proficiency
- 24% ▲ 6.00%
- Median HH income
- $25,815
- Composite
- 13.06/100
- National rank
- #9564
- State rank
- #499 of 540 in MI
Livability — Detroit
- Score
- 73/100
- State rank
- #218
- US rank
- #5427
Category grades
Schools grade is shown separately in the Schools card above.
Census & demographics
- Census place
- Detroit, MI
- County
- Wayne County · 1,562,939 people
- City population
- 572,865
- Metro
- Detroit-Warren-Dearborn, MI
- Population (ZIP)
- 47,208
- Household income
- $43,655
- Rent vs Own
- Severe rent burden
- 3584.0
Population outlook (Wayne County) Hauer SSP2
- Today (2025)
- 1,675,273 people
- By 2030
- 1,620,300 · -3.3%
- By 2040
- 1,502,341 · -10.3%
- By 2050
- 1,384,039 · -17.4%
- By 2075
- 1,124,592 · -32.9%
- By 2100
- 881,193 · -47.4%
Race, ethnicity, and origin ACS 2023
- Neighborhood character
- Predominantly Black (88%)
- Race & ethnicity
- Black 88% White 5% Two or more races 4% Hispanic / Latino 1%
- Common ancestry
- Romanian 1% Lithuanian 1%
- Foreign-born
- 2% · Canada
- Languages at home
- 96% English-only · Spanish 1% French/Haitian/Cajun 1%
Political lean MEDSL · Wayne
- 2024 margin
- Strong D (+29.0) · D 62.7% · R 33.7% · Other 3.6%
- 2008→2024 swing
- -20.5pp toward R · 2008: 49.5pp · 2024: 29.0pp
- All cycles
- 2024: D+29.0 2020: D+38.1 2016: D+37.3 2012: D+46.9 2008: D+49.5
Not yet ingested
- Civics
- —
Market trends
- HPI YoY
- ▼ -65.06%
- Current HPI
- 563.3263
- Rent YoY
- ▲ 8.04%
- Metro
- Detroit-Warren-Dearborn, MI
- State GDP YoY
- ▲ 1.37%
- F500 in state
- 28
Industry mix (Fortune 500 HQ in MI)
| Industry | F500 HQs | Revenue |
|---|---|---|
| Automotive Parts | 3 | $48B |
|
||
| Automotive | 2 | $372B |
|
||
| Chemicals | 1 | $45B |
|
||
| Automotive Retail | 1 | $29B |
|
||
| Healthcare / Medical Devices | 1 | $23B |
|
||
| Automotive Technology | 1 | $20B |
|
||
Price history
+186.3% since first listed36 events — show timeline
- 2026-06-10 Price Changed $72,999 MiRealSource-MiMLS
- 2026-06-09 Price Changed $72,999 REALCOMP
- 2026-05-15 Listed $89,000 REALCOMP
- 2026-05-15 Listed $89,000 MiRealSource-MiMLS
- 2026-01-13 Listing Removed — MiRealSource-MiMLS
- 2026-01-13 Listing Removed — REALCOMP
- 2025-11-21 Price Changed $94,000 MiRealSource-MiMLS
- 2025-11-20 Price Changed $94,000 REALCOMP
- 2025-11-07 Listing Removed — MiRealSource-MiMLS
- 2025-11-07 Listing Removed — REALCOMP
- 2025-11-07 Listed $99,000 MiRealSource-MiMLS
- 2025-11-07 Listed $99,000 REALCOMP
- 2025-09-12 Price Changed $121,000 MiRealSource-MiMLS
- 2025-09-11 Price Changed $121,000 REALCOMP
- 2025-08-23 Price Changed $123,000 MiRealSource-MiMLS
- 2025-08-22 Price Changed $123,000 REALCOMP
- 2025-07-18 Price Changed $125,000 MiRealSource-MiMLS
- 2025-07-18 Price Changed $125,000 REALCOMP
- 2025-06-26 Price Changed $130,000 MiRealSource-MiMLS
- 2025-06-26 Price Changed $130,000 REALCOMP
- 2025-06-05 Listed $140,000 REALCOMP
- 2025-06-05 Listed $140,000 MiRealSource-MiMLS
- 2024-05-16 Rental Removed $950 BUILDIUM
- 2024-04-30 Price Changed $950 BUILDIUM
- 2024-04-06 Price Changed $1,050 BUILDIUM
- 2024-01-21 Listed for Rent $1,150 BUILDIUM
- 2021-10-08 Sold (Public Records) $60,000 Public Records
- 2015-06-02 Listing Removed — MiRealSource-MiMLS
- 2014-12-03 Listing Removed — REALCOMP
- 2014-12-02 Listed $4,600 MiRealSource-MiMLS
- 2014-12-02 Listed $4,600 REALCOMP
- 2014-10-31 Listing Removed — MiRealSource-MiMLS
- 2014-09-11 Listing Removed — REALCOMP
- 2014-03-17 Listed $4,600 REALCOMP
- 2014-03-17 Listed $4,600 MiRealSource-MiMLS
- 2002-11-14 Sold (Public Records) $25,500 Public Records
Property tax history
+0.5%/yrLatest (2025): $1,434 · +1.5% YoY. Source: county tax records.
Cash-flow waterfall
monthlySold comps — $/sqft
last 12 mo · ≤1 miLoading sold comps…