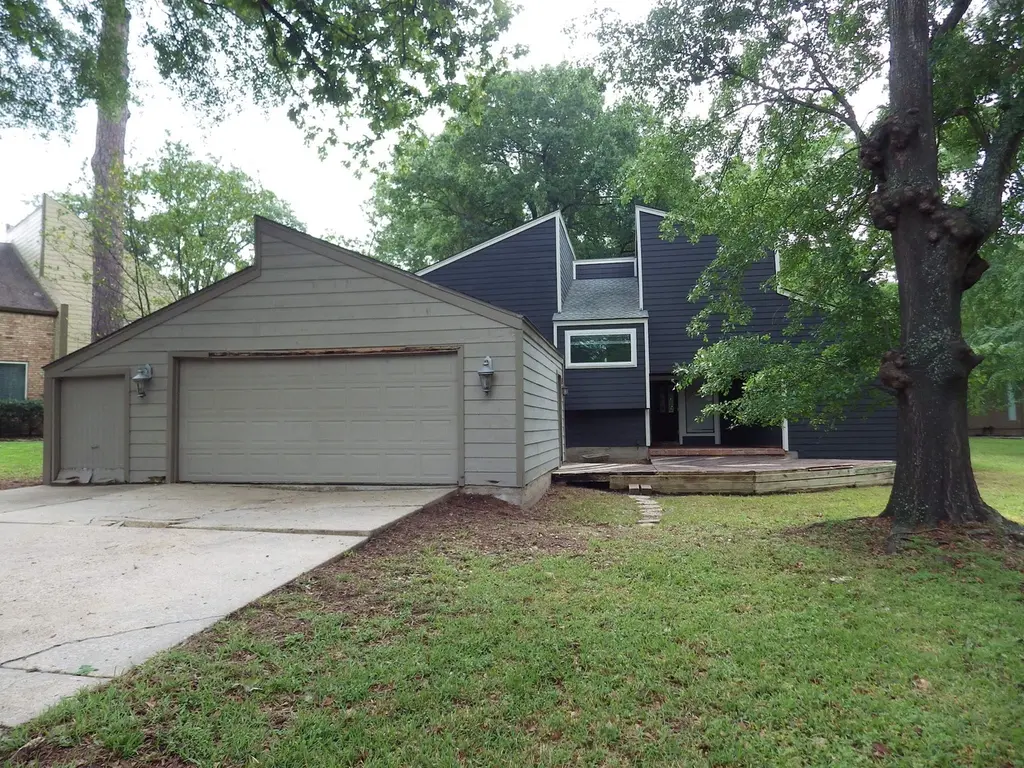
109 Springs Edge Dr · Conroe, TX
Flood risk 6/10 · Moderate
- FEMA flood zone
- X (unshaded)
- Chance of flooding over 30 yrs
- 0.75%
- Est. flood insurance / yr
- $507 – $1,088
Fire risk 2/10 · Minimal
- Est. fire insurance / yr
- $1,222 – $2,270
Heat risk 8/10 · Major
- Hot days now (above 110°F)
- 7 days/yr
- Hot days in 30 yrs
- 24 days/yr
Wind risk 8/10 · Major
- Chance of severe wind over 30 yrs
- 99.0%
Air-quality risk 2/10 · Minimal
- Unhealthy air days now
- 1 days/yr
- Unhealthy air days in 30 yrs
- 1 days/yr
Risk factors via First Street. Map © Google.
Why this score? — see what drove the C+ grade
The composite is a weighted blend of 9 inputs, each scored 0–100. Each bar is that input's sub-score; the figure is the points it added to the 100-point composite (weight × sub-score).
- Cash flow +19.7/30.0
- ARV discount +15.0/15.0
- 1% rule +7.5/10.0
- DSCR +6.2/10.0
- Schools +5.4/10.0
- Livability +3.7/5.0
- Condition / age +2.5/5.0
- Rent growth +1.7/5.0
- Appreciation +0.0/10.0
$207,000
🖨 Deal sheet (PDF) 📄 Offer letter ✓ Due diligence
Listing remarks MLS
Don't miss out on this 4-bedroom home in April Sound on Lake Conroe! Situated on an oversized lot at the end of a cul-de-sac. This property offers an open floor plan with Spanish style tile flooring, a large kitchen, double-sided fireplace, spacious secondary bedrooms, a flex space, front patio/deck, and more. The primary bedroom boasts an en-suite with dual sinks and walk-in shower. Here you'll be walking distance to Lake Conroe and surrounded by trees, this home is perfect for lake living. With tons of potential, this one-of-a-kind property won't last long!
Key facts
- Open floor plan
- Large kitchen
- Oversized lot
Tags
Neighborhood map
What this means for you Summary
Snapshot
- This is a 4-bed/2.5-bath single-family listed at $207k.
Deal economics
- At list price, monthly cash flow is $244 ($3k/yr) — positive.
- The deal already cash-flows at list — no discount required.
- Meets the 1% rule at list price ($3k rent vs $207k).
- Recommended offer: $195k (6.0% below list) — sets the bar for market timing.
- Cap rate 7.7% vs local median 3.1% in Conroe — top-decile yield for the area; either an underpriced asset or a hidden risk that comps aren't pricing in. Stress-test before assuming the spread holds.
Location & tenants
- Location reads 74/100 on livability (#169 in TX, #4,447 nationally) — a middle-class / working-renter tenant base. Strengths: cost of living A+, housing A+, amenities B; Watch: commute F, health & safety F.
- Montgomery ISD (rural): math 63% / reading 57% proficiency, ranked #49 of 826 in TX (top 6%) — acceptable for families but not a draw, mixed tenant base, ~2y average lease.
- Zoned schools: Stewart Creek El (math 49% / reading 58%, grade C, #686 of 4,322 statewide, top 16%, 738 students, 46% FRL); Montgomery J H (math 68% / reading 54%, grade B+, #145 of 1,662 statewide, top 9%, 1,045 students, 30% FRL); Montgomery H S (math 53% / reading 62%, grade C, #327 of 1,632 statewide, top 20%, 1,556 students, 25% FRL).
- Market conditions: Rents falling (-3.3%/yr); 1069 active listings in the ZIP; 9 comparable units currently listed for rent nearby; rentals lingering (median 45d on market — plan ~5-8 weeks vacancy on turnover, expect pricing pressure); 78% of comp listings sitting > 30 days — soft ceiling on asking rent; solid renter incomes; 13,259 units permitted in Montgomery County in 2024 (1,402 in 5+ unit buildings).
Forward outlook
- Local home prices are declining (-3.0%/yr); year-one equity from $1k of loan paydown is wiped out by about $6k of value loss. Plan a longer hold.
- Montgomery County population projected at +65% by 2050 — long-run rental-demand tailwind backs the buy-and-hold thesis.
Negotiation context
- It's been on market 72 days — a 6% lower offer ($195k) is reasonable based on typical stale-listing flexibility.
- 4 sale attempts since 9y ago with the ask held roughly flat each time — persistent listings suggest the price (not the market) is what's stuck; bring a comps-based counter.
- Current owner paid $89k; list at $207k implies a 133% gain — meaningful room to come down on a strong offer.
Risks & watch-outs
- Watch-outs: property tax is 3.2% of price.
- Climate carrying-cost: major flood risk; severe wind risk, 99% chance of damaging wind over 30y; extreme-heat days projected 7→24/yr by 2055 (HVAC capex compounding) — expect insurance premiums to compound above CPI over the hold.
Questions for the listing agent
- It's been on market 72 days. Have you received any prior offers? Is the seller open to a 6% concession, seller financing, or rate buy-down credit?
- Built in 1975 — when were the roof, HVAC, electrical panel, plumbing, and water heater last replaced?
- Property tax is high relative to price — has the assessment been appealed recently, and will the sale trigger a re-assessment?
- What does the HOA fee cover, when was the last increase, and are there any pending special assessments or reserve-fund shortfalls?
- Why hasn't it sold? Are there any deal-killer items the seller is aware of (foundation, flood, title, zoning, code violations)?
- Is there a deadline driving the sale (1031 exchange, divorce, estate, relocation)? That informs how much negotiation room exists.
- Schools are D-rated, which usually means shorter tenancies and higher turnover. Who's the typical renter profile here, and what's been the actual vacancy rate?
- What's the average days-on-market for RENTAL listings here right now (not sales)? A rising rental-DOM trend means longer vacancies and softer asking-rent achievability than the comps imply.
- What's the recent tenant-quality profile in this submarket — average credit score on applications, eviction rate, late-payment / NSF rate, and stable-employment percentage? A property-management company in the area should have these aggregated.
- How much new for-sale + rental construction is in the pipeline within 1–3 miles? Heavy new supply typically softens prices + rents 12–24 months out; constrained supply supports both.
Investment metrics
- 1% rule
- 1.25% ✓
- Cap rate
- 7.71%
- Cash-on-cash
- 5.05%
- DSCR
- 1.22
- GRM
- 6.6
CMA / ARV
- ARV (median comp)
- $283,284
- List price
- $207,000
- Delta
- -26.93%
- Verdict
- UNDERPRICED
- Comps
- 20 within 1.0 mi
Show comp detail 12 sales within ~0.75 mi
| Address | Dist | Beds/Ba | Sqft | Sold | Price | $/sf | Match |
|---|---|---|---|---|---|---|---|
| 537 Mohawk Bnd | 0.23mi | 3/2.5 (-1) | 1,920 (-5%) | 5mo | $300,000 | $156 | 71 |
| 101 Fairway View Ct | 0.28mi | 3/2.5 (-1) | 1,905 (-6%) | 1mo | $379,500 | $199 | 71 |
| 82 April Wind Dr S | 0.22mi | 4/3.5 | 2,205 (+9%) | 3mo | $199,900 | $91 | 68 |
| 286 Carriage Trl | 0.41mi | 3/2.5 (-1) | 2,127 (+5%) | 1mo | $399,900 | $188 | 67 |
| 106 Golfview Dr | 0.51mi | 3/2.5 (-1) | 1,975 (-2%) | 2mo | $365,000 | $185 | 66 |
| 268 Springs Edge Dr | 0.26mi | 3/2.5 (-1) | 2,263 (+12%) | 4mo | $375,000 | $166 | 60 |
| 126 April Wind Ct | 0.32mi | 3/3.5 (-1) | 2,168 (+7%) | 6mo | $299,900 | $138 | 59 |
| 16350 Eastchase St | 0.55mi | 4/2.0 | 1,842 (-9%) | 2mo | $165,000 | $90 | 56 |
| 106 Harbour Town Ct | 0.67mi | 3/2.0 (-1) | 1,944 (-4%) | 1mo | $310,000 | $159 | 54 |
| 132 Golfview Dr | 0.50mi | 3/2.0 (-1) | 1,792 (-12%) | 4mo | $299,000 | $167 | 47 |
| 1608 Mohawk Dr | 0.74mi | 3/2.0 (-1) | 1,896 (-6%) | 2mo | $500,000 | $264 | 47 |
| 145 Dawns Edge Dr | 0.61mi | 3/2.0 (-1) | 2,290 (+13%) | 1mo | $366,000 | $160 | 42 |
Match score weights: distance 35% · size 25% · config 20% · recency 20%. Top-matched comps best support the ARV.
Projected returns pro-forma
-3.0% appreciation · 0.0% rent growth · sell at horizon
- IRR
- -12.6%
- Equity multiple
- 0.56×
- Total profit
- $-25,336
- Equity at exit
- $30,864
- IRR
- -10.3%
- Equity multiple
- 0.48×
- Total profit
- $-30,354
- Equity at exit
- $17,898
Cash invested: $57,960 (down + closing). Projections, not guarantees.
Landlord ↔ Tenant lean methodology
- Overall (STATE)
- 87 Strongly Landlord-Friendly
- State Texas
- 87 Strongly Landlord-Friendly · R+5
- County
- — inherits STATE
- City
- — inherits STATE
ZIP-level market 77356
- Home prices YoY
- -30.3%
- Rents YoY
- -3.3%
- Active inventory
- 1069
- Price-to-rent
- 6.6×
Monthly cashflow live
- Estimated rent
- $2,597 high interval (Pro) →
- Mortgage (P&I)
- −$1,086
- Tax from tax record
- −$545 /mo · $6,536/yr
- Insurance
- −$86
- HOA
- −$91
- Vacancy / Maint / Mgmt
- −$545
- Net cashflow
- $244
Break-even live
Sensitivity live
| Price | -10% $361 | -5% $303 | +0% $244 | +5% $186 | +10% $127 |
|---|---|---|---|---|---|
| Rent | -10% $39 | -5% $142 | +0% $244 | +5% $347 | +10% $449 |
| Rate | -1.0pp $348 | -0.5pp $297 | base $244 | +0.5pp $190 | +1.0pp $136 |
UW: 25.0% down · 7.5% · 30yr · 1.5% tax · 5.0% vac · 8.0% maint · 8.0% mgmt
Financing live
Cash to close
- Down payment
- $51,750
- Closing costs
- $6,210
- Reserves months
- —
- Total cash needed
- —
Loan-product check · same deal, 3 products live
Conventional
25% down · 7.5% · 30yr
- Down + closing
- —
- Monthly P&I
- —
- Monthly cashflow
- —
- DSCR
- —
- Eligible?
- —
Personal DTI + credit; lowest rate.
DSCR
20% down · 8.5% · 30yr
- Down + closing
- —
- Monthly P&I
- —
- Monthly cashflow
- —
- DSCR
- —
- Eligible?
- —
No personal income docs; deal must DSCR.
Hard money
10% down · 12.0% · 12mo
- Down + closing
- —
- Monthly P&I
- —
- Monthly cashflow
- —
- DSCR
- —
- Eligible?
- —
Short-term bridge; refi at stabilization.
Rent comps 9 comps
| Address | Beds | Baths | Sqft | Rent | $/sqft | DOM | Units | Dist |
|---|---|---|---|---|---|---|---|---|
| 135 April Point Dr N Montgomery, TX | 3.0 | 3.0 | 1624 | $1,900 | $1.17 | 45d | 1 | 0.76mi |
| 130 April Point Dr N Montgomery, TX | 3.0 | 3.0 | 1680 | $2,250 | $1.34 | 45d | 1 | 0.80mi |
| 116 Lake View Cir Montgomery, TX | 3.0 | 2.5 | 1751 | $2,250 | $1.28 | 45d | 1 | 0.82mi |
| 16913 Glenheath Montgomery, TX | 4.0 | 2.5 | 1700 | $1,571 | $0.92 | 45d | 1 | 0.83mi |
| 124 April Point Dr N Montgomery, TX | 4.0 | 3.0 | 1624 | $2,900 | $1.79 | 45d | 1 | 0.83mi |
| 702 Crystal River Rd Montgomery, TX | 4.0 | 2.5 | 1820 | $4,000 | $2.20 | 45d | 1 | 0.87mi |
| 16984 W Juneau Montgomery, TX | 3.0 | 3.0 | 1530 | $2,900 | $1.90 | 45d | 1 | 0.91mi |
| 35 Lakeview Vlg Montgomery, TX | 3.0 | 2.0 | 2100 | $3,000 | $1.43 | 20d | 1 | 1.26mi |
| 15310 Abella Dr Montgomery, TX | 3.0 | 2.0 | 1412 | $1,720 | $1.22 | 3d | 1 | 1.46mi |
HOA detail
- Monthly dues
- $91 · $1,092/yr
Listing history 37 events
-
2026-06-21days on market $207,000 Active 72 DOM
-
2026-06-18days on market $207,000 Active 69 DOM
-
2026-06-17days on market $207,000 Active 68 DOM
-
2026-06-16days on market $207,000 Active 67 DOM
-
2026-06-15days on market $207,000 Active 66 DOM
-
2026-06-13days on market $207,000 Active 64 DOM
-
2026-06-13days on market $207,000 Active 63 DOM
-
2026-06-09days on market $207,000 Active 60 DOM
-
2026-06-08days on market $207,000 Active 59 DOM
-
2026-06-07days on market $207,000 Active 58 DOM
-
2026-06-04days on market $207,000 Active 55 DOM
-
2026-06-03days on market $207,000 Active 54 DOM
-
2026-06-02days on market $207,000 Active 53 DOM
-
2026-06-01days on market $207,000 Active 52 DOM
-
2026-05-31days on market $207,000 Active 51 DOM
-
2026-04-10$207,000 Active 565-char remark
Show marketing remark (565 chars)
Don't miss out on this 4-bedroom home in April Sound on Lake Conroe! Situated on an oversized lot at the end of a cul-de-sac. This property offers an open floor plan with Spanish style tile flooring, a large kitchen, double-sided fireplace, spacious secondary bedrooms, a flex space, front patio/deck, and more. The primary bedroom boasts an en-suite with dual sinks and walk-in shower. Here you'll be walking distance to Lake Conroe and surrounded by trees, this home is perfect for lake living. With tons of potential, this one-of-a-kind property won't last long!
-
2023-11-19historical
-
2023-09-16price $250,000
-
2023-08-12price $269,000
-
2023-07-31price $275,000
-
2023-06-19price $285,000
-
2023-06-19price $279,000
-
2023-05-18$305,000 Active
-
2021-07-27soldstatus
-
2021-07-26soldstatus Sold
-
2021-06-16status Pending
-
2021-06-10status Option Pending
-
2021-06-06$220,000 Active
-
2018-05-31soldstatus
-
2018-05-30soldstatus Sold
-
2018-05-06status Pending
-
2018-04-25status Option Pending
-
2018-04-18price $179,000
-
2018-02-21price $185,000
-
2017-11-15$196,500 Active
-
2001-02-05soldstatus
-
1991-09-23soldstatus $88,790
ⓘ Source: listings_history table (triggers on properties + properties_extension) + one-shot
backfill from property_details.listing_events for pre-trigger history.
Tax reassessment forecast TX · Resets to sale price
- Current annual tax
- $6,536 · $545/mo
- Projected year-2 tax
- $6,536 · $545/mo
- Expected delta
- $0/yr ($0/mo · 0.0%)
ⓘ Screening estimate from a state-policy table — verify with the county assessor before closing.
Climate risk First Street
- Flood 6/10 Major FEMA zone X (unshaded) · 75% chance over 30 yrs
- Wildfire 2/10 Low
- Heat 8/10 Severe 7 d/yr ≥110°F today · 24 d/yr by 30 yrs out
- Wind 8/10 Severe 99% chance of damaging wind over 30 yrs
- Air quality 2/10 Low 1 unhealthy d/yr today · 1 by 30 yrs out
Nearby sold comps map
Loading sold comps map…
Walkable amenities ~0.75 mi
Loading nearby amenities…
Taxation est. · year 1
- Rental income
- $31,163
- − Mortgage interest
- −$11,595
- − Property taxes
- −$6,536
- − Insurance
- −$1,035
- − Repairs & maintenance
- −$2,493
- − Management
- −$2,493
- − HOA
- −$1,092
- − Depreciation
- −$6,022
- Taxable loss
- −$103
- Est. tax savings @ 24.0%
- +$25
- After-tax cash flow
- $2,954/yr
For passive investors: Depreciation is non-cash, so a rental often shows a tax loss while cash-flowing — sheltering income. Rental losses are passive: they offset passive income freely, and up to $25,000/yr can offset ordinary (W-2) income if you actively participate and your MAGI is under $100k (phasing out to $0 by $150k); unused losses carry forward. On sale, claimed depreciation is recaptured at up to 25%, and gains may owe capital-gains tax (a 1031 exchange can defer both). Figures are a year-1 estimate at your 24.0% rate — not tax advice; consult a CPA.
Schools (NCES district)
- District
- Montgomery ISD
- NCES district ID
- 4831260
- Math proficiency
- 63% ▼ -3.00%
- Reading proficiency
- 57% ▼ -3.00%
- Median HH income
- $75,596
- Composite
- 53.55/100
- National rank
- #1445
- State rank
- #49 of 826 in TX
Livability — Conroe
- Score
- 74/100
- State rank
- #169
- US rank
- #4447
Category grades
Schools grade is shown separately in the Schools card above.
Census & demographics
- Census place
- Conroe, TX
- County
- Montgomery County · 663,713 people
- City population
- 205,417
- Metro
- Houston-The Woodlands-Sugar Land, TX
- Population (ZIP)
- 32,583
- Household income
- $106,804
- Rent vs Own
- Severe rent burden
- 414.0
Population outlook (Montgomery County) Hauer SSP2
- Today (2025)
- 713,896 people
- By 2030
- 805,263 · +12.8%
- By 2040
- 992,708 · +39.1%
- By 2050
- 1,179,590 · +65.2%
- By 2075
- 1,628,084 · +128.1%
- By 2100
- 1,937,880 · +171.5%
Race, ethnicity, and origin ACS 2023
- Neighborhood character
- Predominantly White (87%)
- Race & ethnicity
- White 87% Two or more races 5% Hispanic / Latino 5% Black 4%
- Common ancestry
- Lithuanian 8% Slovak 2% Romanian 2%
- Foreign-born
- 3% · Canada, China
- Languages at home
- 96% English-only · Spanish 3%
Political lean MEDSL · Montgomery
- 2024 margin
- Solid R (+45.5) · D 26.8% · R 72.3%
- 2008→2024 swing
- +7.2pp toward D · 2008: -52.7pp · 2024: -45.5pp
- All cycles
- 2024: R+45.5 2020: R+43.8 2016: R+51.4 2012: R+60.7 2008: R+52.7
Not yet ingested
- Civics
- —
Market trends
- HPI YoY
- ▼ -101.28%
- Current HPI
- 233.0032
- Rent YoY
- ▼ -3.30%
- Metro
- Houston-The Woodlands-Sugar Land, TX
- State GDP YoY
- ▲ 3.95%
- F500 in state
- 110
Industry mix (Fortune 500 HQ in TX)
| Industry | F500 HQs | Revenue |
|---|---|---|
| Energy | 16 | $1,198B |
|
||
| Technology | 5 | $198B |
|
||
| Engineering / Construction | 4 | $72B |
|
||
| Energy Services | 3 | $60B |
|
||
| Utilities | 3 | $41B |
|
||
| Healthcare | 2 | $330B |
|
||
Price history
+133.1% since first listed22 events — show timeline
- 2026-04-10 Listed $207,000 HARMLS
- 2023-11-19 Listing Removed — HARMLS
- 2023-09-16 Price Changed $250,000 HARMLS
- 2023-08-12 Price Changed $269,000 HARMLS
- 2023-07-31 Price Changed $275,000 HARMLS
- 2023-06-19 Price Changed $285,000 HARMLS
- 2023-06-19 Price Changed $279,000 HARMLS
- 2023-05-18 Listed $305,000 HARMLS
- 2021-07-27 Sold (Public Records) — Public Records
- 2021-07-26 Sold (MLS) — HARMLS
- 2021-06-16 Pending — HARMLS
- 2021-06-10 Pending — HARMLS
- 2021-06-06 Listed $220,000 HARMLS
- 2018-05-31 Sold (Public Records) — Public Records
- 2018-05-30 Sold (MLS) — HARMLS
- 2018-05-06 Pending — HARMLS
- 2018-04-25 Pending — HARMLS
- 2018-04-18 Price Changed $179,000 HARMLS
- 2018-02-21 Price Changed $185,000 HARMLS
- 2017-11-15 Listed $196,500 HARMLS
- 2001-02-05 Sold (Public Records) — Public Records
- 1991-09-23 Sold (Public Records) $88,790 Public Records
Property tax history
+4.5%/yrLatest (2025): $6,536 · +7.0% YoY. Source: county tax records.
Cash-flow waterfall
monthlySold comps — $/sqft
last 12 mo · ≤1 miLoading sold comps…