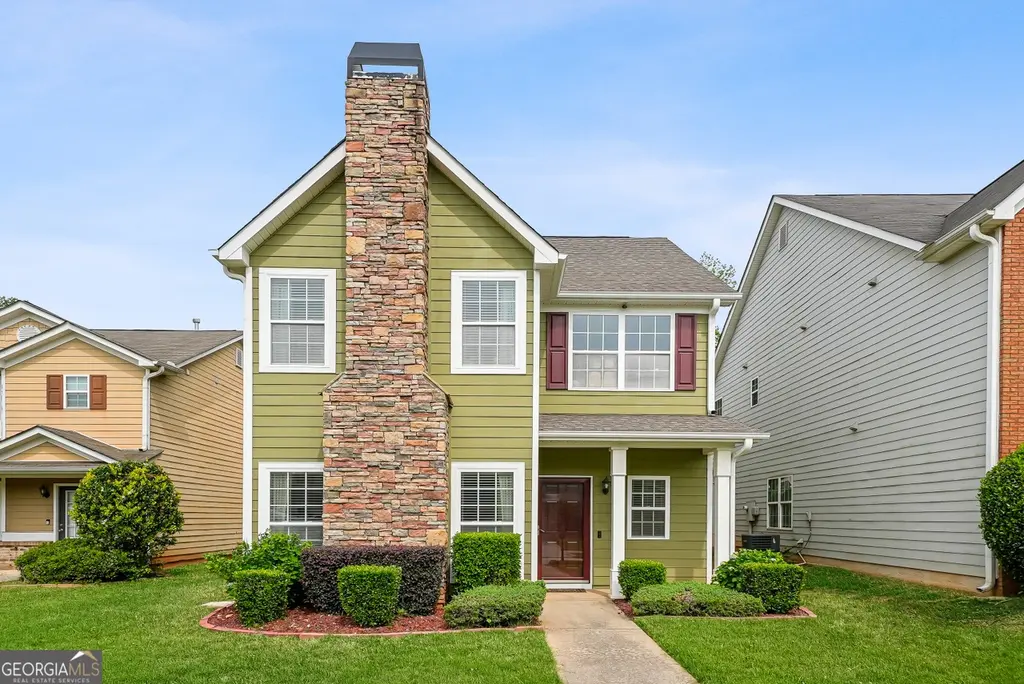
2316 Polaris Way SW · South Fulton, GA
Flood risk 1/10 · Minimal
- FEMA flood zone
- X (unshaded)
- Chance of flooding over 30 yrs
- 0.0%
- Est. flood insurance / yr
- $507 – $1,088
Fire risk 3/10 · Minor
- Est. fire insurance / yr
- $963 – $1,789
Heat risk 6/10 · Moderate
- Hot days now (above 104°F)
- 7 days/yr
- Hot days in 30 yrs
- 19 days/yr
Wind risk 5/10 · Moderate
- Chance of severe wind over 30 yrs
- 25.0%
Air-quality risk 4/10 · Minor
- Unhealthy air days now
- 4 days/yr
- Unhealthy air days in 30 yrs
- 5 days/yr
Risk factors via First Street. Map © Google.
Why this score? — see what drove the D grade
The composite is a weighted blend of 9 inputs, each scored 0–100. Each bar is that input's sub-score; the figure is the points it added to the 100-point composite (weight × sub-score).
- ARV discount +12.9/15.0
- Cash flow +12.0/30.0
- Schools +4.5/10.0
- DSCR +3.5/10.0
- Rent growth +3.2/5.0
- 1% rule +2.6/10.0
- Livability +2.5/5.0
- Condition / age +2.5/5.0
- Appreciation +0.0/10.0
$275,000
🖨 Deal sheet (PDF) 📄 Offer letter ✓ Due diligence
Listing remarks
Beautifully Maintained 3BR/2.5BA Home Near Atlanta Airport & Westlake High! Welcome to this wellkept, moveinready gem perfectly positioned for convenience and comfort. Located just minutes from HartsfieldJackson Atlanta International Airport, major interstates, shopping, parks, and vibrant downtown Atlanta, this home offers the best of city access with a peaceful neighborhood feel. Step inside to a bright, open layout with spacious living areas ideal for relaxing or entertaining. The kitchen flows effortlessly into the dining and family spaces, creating a warm, inviting atmosphere. Upstairs, you'll find three generous bedrooms-including a comfortable primary suite with its own priv
Key facts
- Well maintained yard
- Bright open layout
- Private bath
Tags
Property features AI
Finance
- Other: Home warranty included
- HOA & community: Has association; Association amenities include swimming
Exterior
- Parking: Attached garage; Attached parking
- Utilities: Public water; Public sewer; Electricity available; Cable available; High-speed internet available
- Home design: Single family residence; House; Two levels; Resale property; Subdivision: Anatole
- Construction: Built in 2008; Concrete construction; Composition roof
- Exterior features: Level lot; Clubhouse; Sidewalks; Street lights; Near public transportation
Interior
- Kitchen: Dishwasher; Ice maker; Microwave; Refrigerator
- Bedrooms: 3 bedrooms
- Flooring: Carpet; Laminate
- Bathrooms: 2 full bathrooms; 1 half bathroom (2.5 total bathrooms)
- Heating & cooling: Central heating (electric); Dual heating zones; Central air conditioning (electric); Dual cooling zones
- Interior features: Double vanity in bath(s); Separate shower; Soaking tub; Family room; One fireplace
- Laundry & utility: Washer and Dryer; Laundry located in hall; Electric water heater
Neighborhood map
What this means for you Summary
Snapshot
- This is a 3-bed/2.0-bath single-family listed at $275k.
Deal economics
- At list price, monthly cash flow is $-65 ($-779/yr) — negative.
- To cash-flow at today's rent, offer at most $264k (4.2% below list).
- To meet the 1% rule (rent ≥ 1% of price), the offer needs to be $208k (24.4% below list).
- Recommended offer: $208k (24.4% below list) — sets the bar for 1% rule.
- Cap rate 6.0% vs local median 4.6% in South Fulton — top-decile yield for the area; either an underpriced asset or a hidden risk that comps aren't pricing in. Stress-test before assuming the spread holds.
Location & tenants
- Location reads: area grade D — affects rentability + tenant quality, not the cash-flow math above.
- Fulton County (suburban): math 49% / reading 53% proficiency, ranked #12 of 174 in GA (top 7%) — acceptable for families but not a draw, mixed tenant base, ~2y average lease.
- Zoned schools: Cliftondale Elementary School (math 27% / reading 37%, grade F, #582 of 1,228 statewide, top 50%, 667 students, 62% FRL); Sandtown Middle School (math 24% / reading 35%, grade F, #249 of 470 statewide, top 55%, 1,057 students, 57% FRL); Westlake High School (math 27% / reading 5%, grade F, #287 of 424 statewide, top 68%, 2,461 students, 43% FRL).
- Zoned-school proficiency averages 26% at this address vs 51% district-wide (-25 pts) — the specific schools serving this property underperform the Fulton County average; the district grade overstates school quality for this exact location.
- Market conditions: Rents rising (+2.6%/yr); 485 active listings in the ZIP; 11 comparable units currently listed for rent nearby; rentals lingering (median 46d on market — plan ~5-8 weeks vacancy on turnover, expect pricing pressure); 64% of comp listings sitting > 30 days — soft ceiling on asking rent; 11,565 units permitted in Fulton County in 2024 (8,159 in 5+ unit buildings).
- This rent runs 40% of the median local income ($63k/yr) — at the standard rent-burdened threshold; future hikes will face affordability resistance.
Forward outlook
- Local home prices are declining (-3.0%/yr); year-one equity from $2k of loan paydown is wiped out by about $8k of value loss. Plan a longer hold.
- Fulton County population projected at +38% by 2050 — long-run rental-demand tailwind backs the buy-and-hold thesis.
Negotiation context
- It's been on market 40 days — a 3% lower offer ($267k) is reasonable based on typical stale-listing flexibility.
Risks & watch-outs
- Climate carrying-cost: moderate wind risk, 25% chance of damaging wind over 30y; extreme-heat days projected 7→19/yr by 2055 (HVAC capex compounding) — expect insurance premiums to compound above CPI over the hold.
Questions for the listing agent
- What do current leases actually rent for vs. the listed asking? Can we see a recent rent roll and the last 12 months of T-12 income?
- It's been on market 40 days. Have you received any prior offers? Is the seller open to a 24% concession, seller financing, or rate buy-down credit?
- Is there a deadline driving the sale (1031 exchange, divorce, estate, relocation)? That informs how much negotiation room exists.
- The area grade is low — what's the realistic commute time and amenity access for the typical tenant pool here? Any planned neighborhood developments (good or bad) we should know about?
- What's the average days-on-market for RENTAL listings here right now (not sales)? A rising rental-DOM trend means longer vacancies and softer asking-rent achievability than the comps imply.
- What's the recent tenant-quality profile in this submarket — average credit score on applications, eviction rate, late-payment / NSF rate, and stable-employment percentage? A property-management company in the area should have these aggregated.
- How much new for-sale + rental construction is in the pipeline within 1–3 miles? Heavy new supply typically softens prices + rents 12–24 months out; constrained supply supports both.
Investment metrics
- 1% rule
- 0.76% ✗
- Cap rate
- 6.01%
- Cash-on-cash
- -1.01%
- DSCR
- 0.95
- GRM
- 11.0
CMA / ARV
- ARV (median comp)
- $312,736
- List price
- $275,000
- Delta
- -12.07%
- Verdict
- UNDERPRICED
- Comps
- 20 within 1.0 mi
Projected returns pro-forma
-3.0% appreciation · 2.63% rent growth · sell at horizon
- IRR
- -18.4%
- Equity multiple
- 0.36×
- Total profit
- $-49,556
- Equity at exit
- $41,003
- IRR
- -11.5%
- Equity multiple
- 0.33×
- Total profit
- $-51,974
- Equity at exit
- $23,777
Cash invested: $77,000 (down + closing). Projections, not guarantees.
Landlord ↔ Tenant lean methodology
- Overall (STATE)
- 90 Strongly Landlord-Friendly
- State Georgia
- 90 Strongly Landlord-Friendly · R+3
- County
- — inherits STATE
- City
- — inherits STATE
ZIP-level market 30331
- Home prices YoY
- -34.2%
- Rents YoY
- 2.6%
- Active inventory
- 485
- Price-to-rent
- 11.0×
Monthly cashflow live
- Estimated rent
- $2,079 high interval (Pro) →
- Mortgage (P&I)
- −$1,442
- Tax from tax record
- −$151 /mo · $1,810/yr
- Insurance
- −$115
- HOA
- −$0
- Vacancy / Maint / Mgmt
- −$437
- Net cashflow
- $-65
Break-even live
Sensitivity live
| Price | -10% $91 | -5% $13 | +0% $-65 | +5% $-143 | +10% $-221 |
|---|---|---|---|---|---|
| Rent | -10% $-229 | -5% $-147 | +0% $-65 | +5% $17 | +10% $99 |
| Rate | -1.0pp $74 | -0.5pp $5 | base $-65 | +0.5pp $-136 | +1.0pp $-209 |
UW: 25.0% down · 7.5% · 30yr · 1.5% tax · 5.0% vac · 8.0% maint · 8.0% mgmt
Financing live
Cash to close
- Down payment
- $68,750
- Closing costs
- $8,250
- Reserves months
- —
- Total cash needed
- —
Loan-product check · same deal, 3 products live
Conventional
25% down · 7.5% · 30yr
- Down + closing
- —
- Monthly P&I
- —
- Monthly cashflow
- —
- DSCR
- —
- Eligible?
- —
Personal DTI + credit; lowest rate.
DSCR
20% down · 8.5% · 30yr
- Down + closing
- —
- Monthly P&I
- —
- Monthly cashflow
- —
- DSCR
- —
- Eligible?
- —
No personal income docs; deal must DSCR.
Hard money
10% down · 12.0% · 12mo
- Down + closing
- —
- Monthly P&I
- —
- Monthly cashflow
- —
- DSCR
- —
- Eligible?
- —
Short-term bridge; refi at stabilization.
Rent comps 11 comps
| Address | Beds | Baths | Sqft | Rent | $/sqft | DOM | Units | Dist |
|---|---|---|---|---|---|---|---|---|
| 7195 Rigel Bnd SW Atlanta, GA | 3.0 | 2.5 | 1244 | $1,900 | $1.53 | 45d | 1 | 0.11mi |
| 2162 Capella Cir SW Atlanta, GA | 3.0 | 2.5 | 1974 | $2,000 | $1.01 | 45d | 1 | 0.12mi |
| 7151 Chara Ln SW Atlanta, GA | 3.0 | 2.5 | 1528 | $2,140 | $1.40 | 19d | 1 | 0.14mi |
| 7151 Chara Ln SW Atlanta, GA | 3.0 | 2.5 | 1528 | $2,140 | $1.40 | 45d | 1 | 0.14mi |
| 2442 Capella Cir SW Atlanta, GA | 3.0 | 2.5 | 1694 | $1,850 | $1.09 | 45d | 1 | 0.15mi |
| 2542 Polaris Way SW Atlanta, GA | 3.0 | 2.5 | 1504 | $2,200 | $1.46 | 6d | 1 | 0.23mi |
| 6386 Sundowner Pl SW Atlanta, GA | 4.0 | 2.5 | 1773 | $2,795 | $1.58 | 45d | 1 | 1.05mi |
| 6386 Sundowner Pl SW Atlanta, GA | 4.0 | 2.5 | 1695 | $2,499 | $1.47 | 18d | 1 | 1.05mi |
| 6384 Sundowner Pl SW Atlanta, GA | 3.0 | 2.5 | 1695 | $2,350 | $1.39 | 4d | 1 | 1.05mi |
| 3996 King Dr Douglasville, GA | 4.0 | 3.0 | 1608 | $1,755 | $1.09 | 45d | 1 | 1.06mi |
| 3171 Redwood Run Atlanta, GA | 2.0 | 1.0 | 1938 | $1,500 | $0.77 | 45d | 1 | 1.42mi |
Listing history 14 events
-
2026-06-21days on market $275,000 Active 40 DOM
-
2026-06-18days on market $275,000 Active 37 DOM
-
2026-06-17days on market $275,000 Active 36 DOM
-
2026-06-16days on market $275,000 Active 35 DOM
-
2026-06-15days on market $275,000 Active 34 DOM
-
2026-06-13days on market $275,000 Active 32 DOM
-
2026-06-09days on market $275,000 Active 28 DOM
-
2026-06-08days on market $275,000 Active 27 DOM
-
2026-06-07days on market $275,000 Active 26 DOM
-
2026-06-04days on market $275,000 Active 23 DOM
-
2026-06-03days on market $275,000 Active 22 DOM
-
2026-06-01days on market $275,000 Active 20 DOM
-
2026-05-31days on market $275,000 Active 19 DOM
-
2026-05-12$275,000 New 1158-char remark
ⓘ Source: listings_history table (triggers on properties + properties_extension) + one-shot
backfill from property_details.listing_events for pre-trigger history.
Tax reassessment forecast GA · Resets to sale price
- Current annual tax
- $1,810 · $151/mo
- Projected year-2 tax
- $2,530 · $211/mo
- Expected delta
- +$720/yr (+$60/mo · 39.8%)
ⓘ Screening estimate from a state-policy table — verify with the county assessor before closing.
Climate risk First Street
- Flood 1/10 Low FEMA zone X (unshaded) · 0% chance over 30 yrs
- Wildfire 3/10 Moderate
- Heat 6/10 Major 7 d/yr ≥104°F today · 19 d/yr by 30 yrs out
- Wind 5/10 Major 25% chance of damaging wind over 30 yrs
- Air quality 4/10 Moderate 4 unhealthy d/yr today · 5 by 30 yrs out
Nearby sold comps map
Loading sold comps map…
Walkable amenities ~0.75 mi
Loading nearby amenities…
Taxation est. · year 1
- Rental income
- $24,951
- − Mortgage interest
- −$15,404
- − Property taxes
- −$1,810
- − Insurance
- −$1,375
- − Repairs & maintenance
- −$1,996
- − Management
- −$1,996
- − Depreciation
- −$8,000
- Taxable loss
- −$5,630
- Est. tax savings @ 24.0%
- +$1,351
- After-tax cash flow
- $572/yr
For passive investors: Depreciation is non-cash, so a rental often shows a tax loss while cash-flowing — sheltering income. Rental losses are passive: they offset passive income freely, and up to $25,000/yr can offset ordinary (W-2) income if you actively participate and your MAGI is under $100k (phasing out to $0 by $150k); unused losses carry forward. On sale, claimed depreciation is recaptured at up to 25%, and gains may owe capital-gains tax (a 1031 exchange can defer both). Figures are a year-1 estimate at your 24.0% rate — not tax advice; consult a CPA.
Schools (NCES district)
- District
- Fulton County
- NCES district ID
- 1302280
- Math proficiency
- 49% ▼ -2.00%
- Reading proficiency
- 53% ▬ 0.00%
- Median HH income
- $68,035
- Composite
- 45.33/100
- National rank
- #2640
- State rank
- #12 of 174 in GA
Livability — South Fulton
No livability data for this city. (Only ~50 U.S. cities are tracked.)
Census & demographics
- Census place
- South Fulton, GA
- County
- Fulton County · 1,094,430 people
- City population
- 127,674
- Metro
- Atlanta-Sandy Springs-Alpharetta, GA
- Population (ZIP)
- 62,567
- Household income
- $62,623
- Rent vs Own
- Severe rent burden
- 3748.0
Population outlook (Fulton County) Hauer SSP2
- Today (2025)
- 1,203,707 people
- By 2030
- 1,299,706 · +8.0%
- By 2040
- 1,488,256 · +23.6%
- By 2050
- 1,664,580 · +38.3%
- By 2075
- 2,036,072 · +69.2%
- By 2100
- 2,222,402 · +84.6%
Race, ethnicity, and origin ACS 2023
- Neighborhood character
- Predominantly Black (94%)
- Race & ethnicity
- Black 94% Two or more races 3% Hispanic / Latino 2%
- Common ancestry
- Hispanic 1%
- Foreign-born
- 4% · Canada
- Languages at home
- 95% English-only · Spanish 1% French/Haitian/Cajun 1%
Political lean MEDSL · Fulton
- 2024 margin
- Solid D (+44.9) · D 71.9% · R 27.0% · Other 1.1%
- 2008→2024 swing
- +9.8pp toward D · 2008: 35.0pp · 2024: 44.9pp
- All cycles
- 2024: D+44.9 2020: D+46.4 2016: D+42.1 2012: D+29.6 2008: D+35.0
Not yet ingested
- Civics
- —
Market trends
- HPI YoY
- ▼ -106.38%
- Current HPI
- 204.5402
- Rent YoY
- ▲ 2.63%
- Metro
- Atlanta-Sandy Springs-Alpharetta, GA
- State GDP YoY
- ▲ 2.66%
- F500 in state
- 28
Industry mix (Fortune 500 HQ in GA)
| Industry | F500 HQs | Revenue |
|---|---|---|
| Paper / Packaging | 2 | $29B |
|
||
| Retail | 1 | $160B |
|
||
| Transportation / Logistics | 1 | $91B |
|
||
| Airlines | 1 | $62B |
|
||
| Consumer Goods | 1 | $47B |
|
||
| Utilities | 1 | $25B |
|
||
Price history
1 event — show timeline
- 2026-05-12 Listed $275,000 GAMLS
Property tax history
+1.6%/yrLatest (2025): $1,810 · +3.8% YoY. Source: county tax records.
Cash-flow waterfall
monthlySold comps — $/sqft
last 12 mo · ≤1 miLoading sold comps…